Windows Events Connector
Configure the Windows Events connector to collect Windows Event Log data from servers and workstations for AI-powered analysis of system events, application logs, and security events.
12 minute read
Overview
The Windows Events connector collects Windows Event Log data from Windows servers and workstations. Windows Event Logs are the primary logging mechanism in Windows operating systems, capturing system events, application behavior, security audits, and operational activities. Content streams into Edge Delta Pipelines for analysis by AI teammates through the Edge Delta MCP connector.
The connector reads events directly from Windows Event Log channels using native Windows Event Log APIs, providing real-time event streaming from channels like Application, System, Security, and Setup. It supports custom event channels, XML event parsing, and automatic metadata extraction.
When you add this streaming connector, it appears as a Windows Event source in your selected pipeline. AI teammates access this data by querying the Edge Delta backend with the Edge Delta MCP connector.
Platform: Windows only (Windows Server 2012 R2+, Windows 10+)
For comprehensive Windows Event source configuration details, see the Windows Event Source documentation.
Add the Windows Events Connector
To add the Windows Events connector, you configure which Windows Event Log channels to monitor and deploy to Windows agents.
Prerequisites
Before configuring the connector, ensure you have:
- Windows Server 2012 R2+ or Windows 10+ on target systems
- Edge Delta agent installed and running on Windows hosts
- Appropriate permissions to read Event Log channels:
- Application/System channels: Local Users group or higher
- Security channel: Administrator or Event Log Readers group
- Custom channels: Specific channel read permissions
Configuration Steps
- Navigate to AI Team > Connectors in the Edge Delta application
- Find the Windows Events connector in Streaming Connectors
- Click the connector card
- Configure Channel (Application, System, Security, etc.)
- Optionally configure Advanced Settings for metadata and rate limiting
- Select a target environment (Windows agents only)
- Click Save
The connector deploys to Windows agents and begins reading events from the specified channel.
Configuration Options
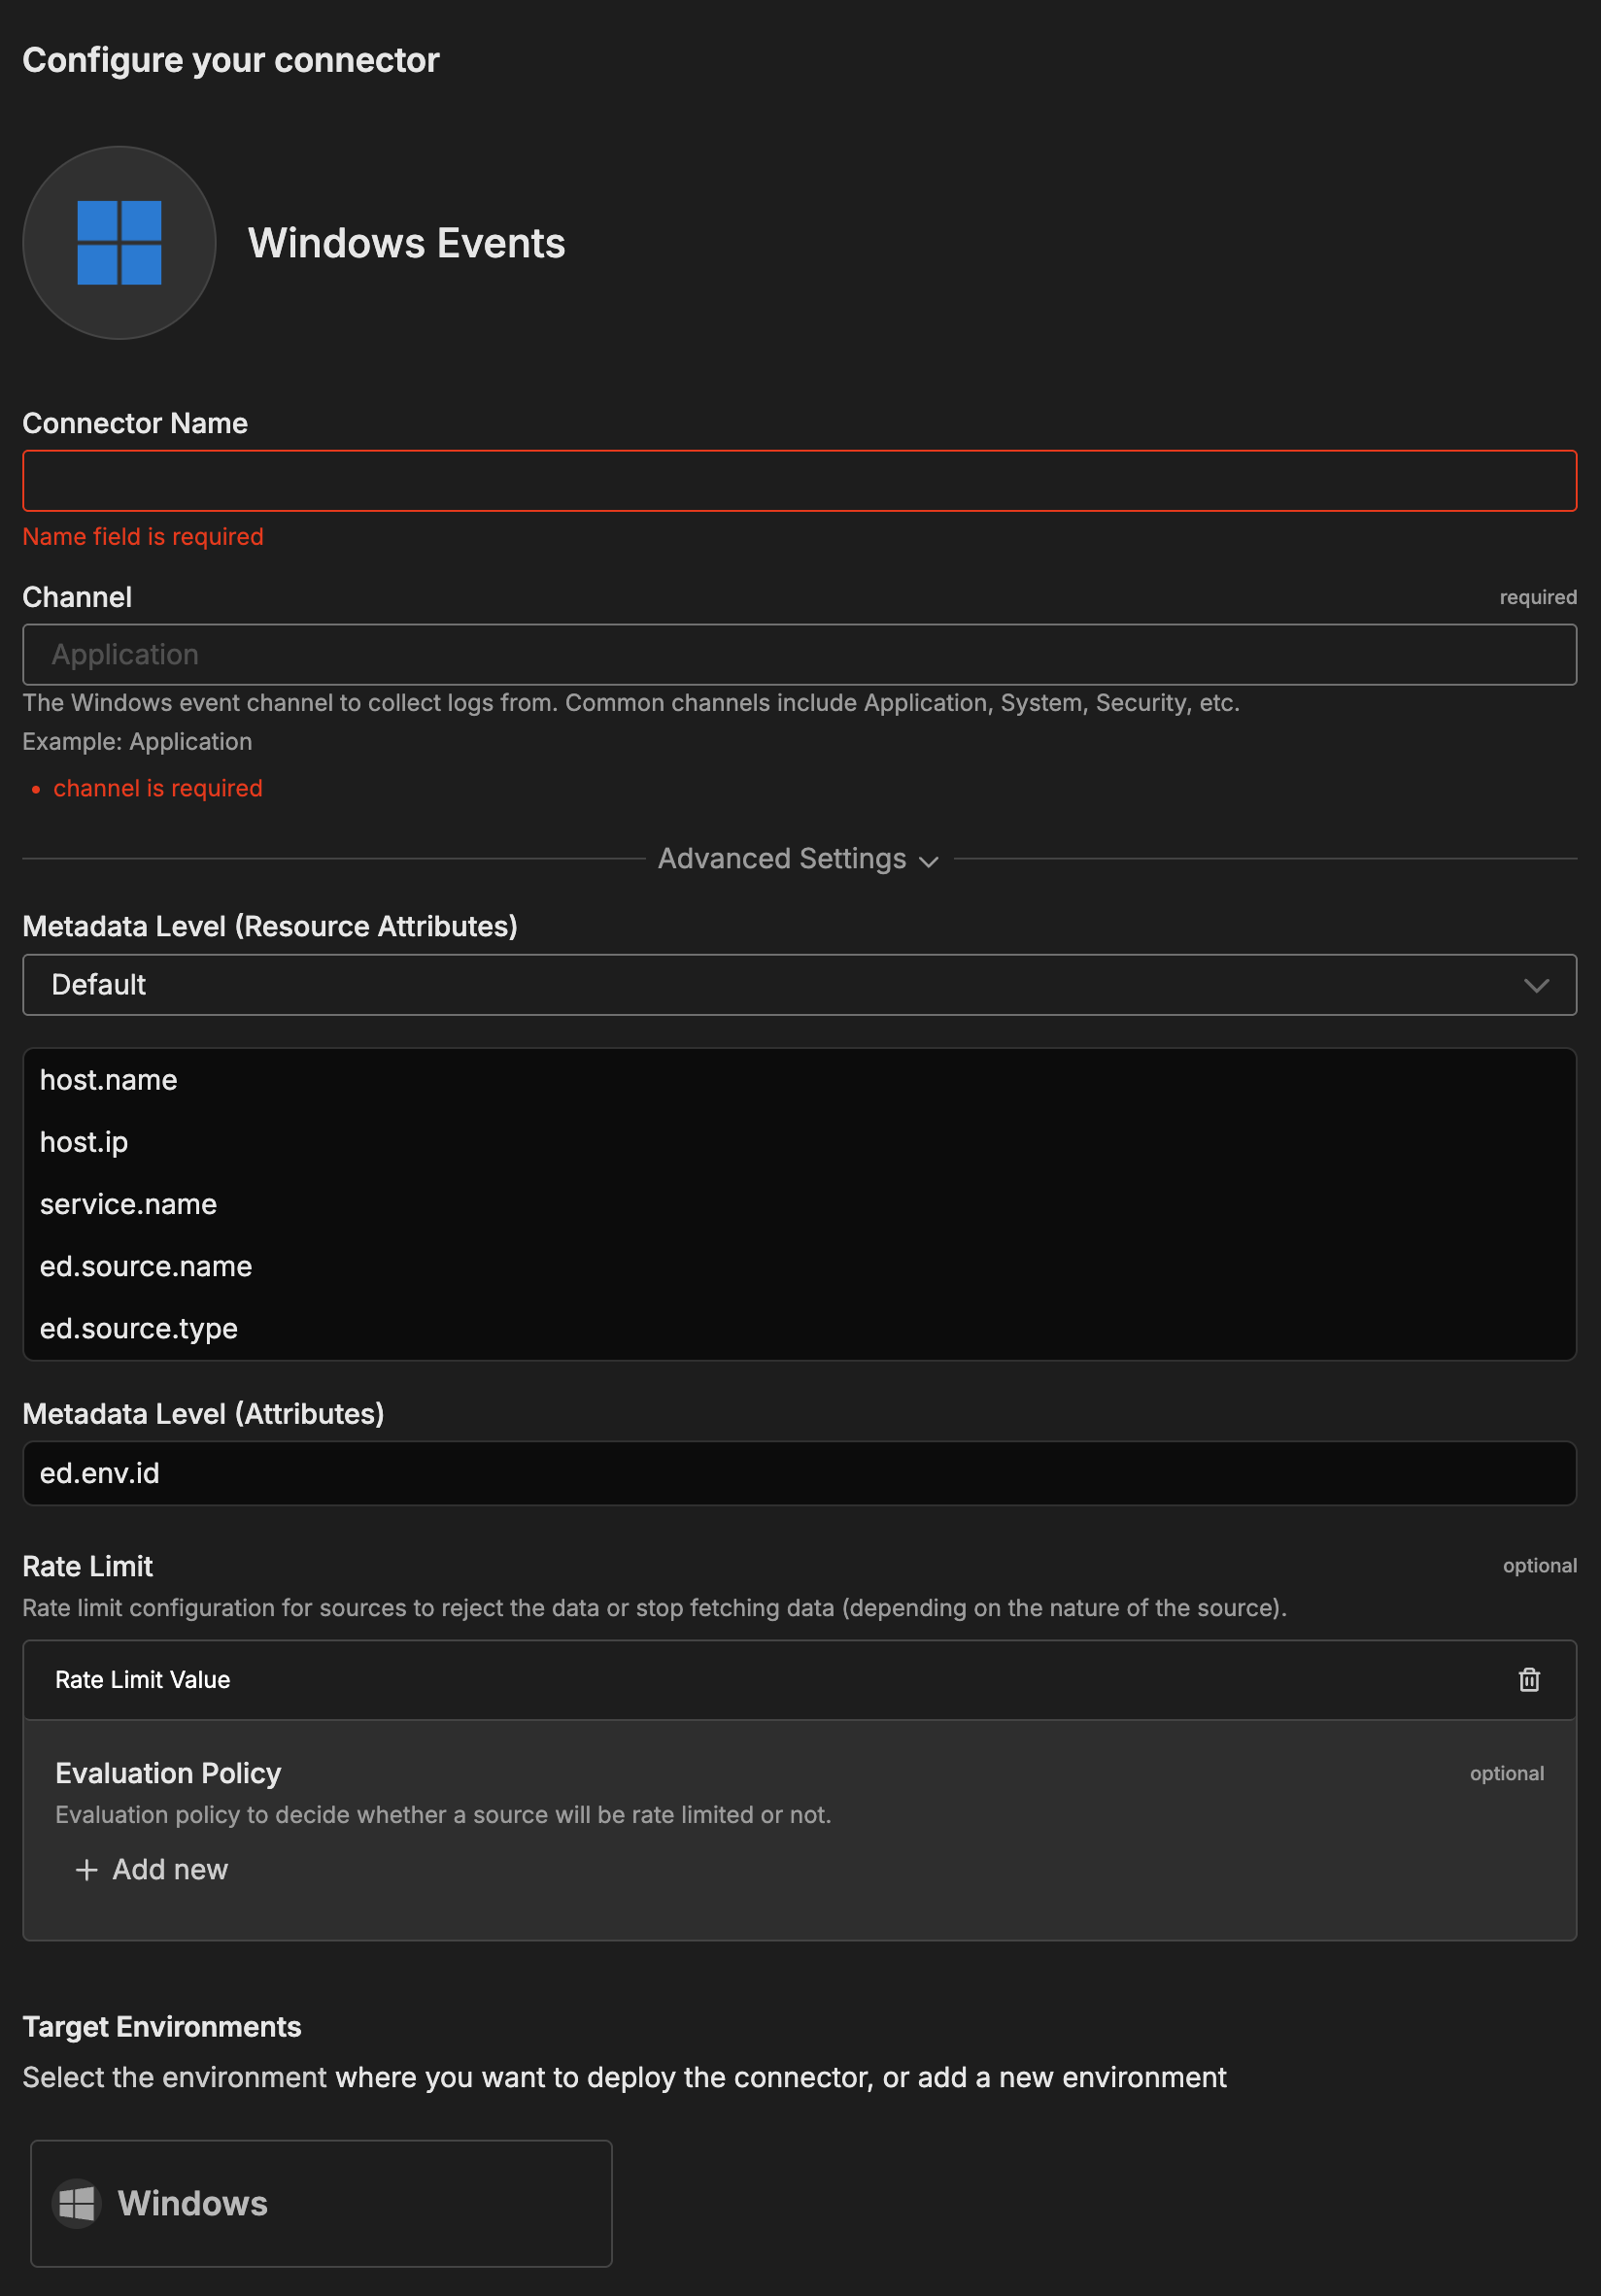
Connector Name
Name to identify this Windows Events connector instance.
Channel
Windows Event Log channel to collect logs from.
Format: Exact channel name as shown in Event Viewer
Examples:
Application- Application events, crashes, errorsSystem- System events, service status, driver issuesSecurity- Security audit events, logon/logoff (requires elevated permissions)Setup- Windows installation and update eventsMicrosoft-Windows-PowerShell/Operational- PowerShell command executionMicrosoft-Windows-TaskScheduler/Operational- Scheduled task eventsMicrosoft-Windows-DNS-Client/Operational- DNS client queries
Common Channels:
| Channel | Description | Permission Required |
|---|---|---|
| Application | Application logs and errors | Local Users |
| System | Operating system events | Local Users |
| Security | Security audit logs | Administrator or Event Log Readers |
| Setup | Windows setup and updates | Local Users |
| ForwardedEvents | Events forwarded from other systems | Event Log Readers |
Finding Channels: Open Event Viewer (eventvwr.msc) on Windows, expand Windows Logs or Applications and Services Logs to see available channels
Advanced Settings
Metadata Level (Resource Attributes)
This option is used to define which detected resources and attributes to add to each data item as it is ingested by Edge Delta. You can select:
- Required Only: This option includes the minimum required resources and attributes for Edge Delta to operate.
- Default: This option includes the required resources and attributes plus those selected by Edge Delta
- High: This option includes the required resources and attributes along with a larger selection of common optional fields.
- Custom: With this option selected, you can choose which attributes and resources to include. The required fields are selected by default and can’t be unchecked.
Based on your selection in the GUI, the source_metadata YAML is populated as two dictionaries (resource_attributes and attributes) with Boolean values.
See Choose Data Item Metadata for more information on selecting metadata.
Windows Events-specific metadata included:
- Host name - Windows hostname
- Host IP - Windows host IP address
- Service name - Service identifier
- Source name - Connector instance name
- Source type - Windows Events connector type
Event metadata extracted:
- Event ID - Numeric event identifier
- Event Level - Severity (Critical, Error, Warning, Information, Verbose)
- Event Source - Application or component that logged the event
- Event Channel - Event Log channel name
- Computer - Computer name from event
- User - User account associated with event (if available)
- Timestamp - Event timestamp
Metadata Level (Attributes)
Additional attribute-level metadata fields to include.
Default: ed.env.id
Rate Limit
The rate_limit parameter enables you to control data ingestion based on system resource usage. This advanced setting helps prevent source nodes from overwhelming the agent by automatically throttling or stopping data collection when CPU or memory thresholds are exceeded.
Use rate limiting to prevent runaway log collection from overwhelming the agent in high-volume sources, protect agent stability in resource-constrained environments with limited CPU/memory, automatically throttle during bursty traffic patterns, and ensure fair resource allocation across source nodes in multi-tenant deployments.
When rate limiting triggers, pull-based sources (File, S3, HTTP Pull) stop fetching new data, push-based sources (HTTP, TCP, UDP, OTLP) reject incoming data, and stream-based sources (Kafka, Pub/Sub) pause consumption. Rate limiting operates at the source node level, where each source with rate limiting enabled independently monitors and enforces its own thresholds.
Rate limiting vs backpressure: Rate limiting and backpressure are different mechanisms. Rate limiting controls data ingestion at the source based on CPU or memory thresholds. Backpressure controls data output at the destination when in-memory queues fill up. Backpressure logs such as
backpressure: dataCh at 92% capacitydo not appear when rate limiting triggers, and rate limiting logs do not appear during backpressure events.
Observability: When rate limiting is active in enforce mode, the agent does not produce INFO, WARN, or ERROR level logs. To confirm that rate limiting is triggering, check the source node’s Bytes I/O metrics in the Edge Delta app for gaps or drops that coincide with expected throttling periods.
Configuration Steps:
- Click Add New in the Rate Limit section
- Click Add New for Evaluation Policy
- Select Policy Type:
- CPU Usage: Monitors CPU consumption and rate limits when usage exceeds defined thresholds. Use for CPU-intensive sources like file parsing or complex transformations.
- Memory Usage: Monitors memory consumption and rate limits when usage exceeds defined thresholds. Use for memory-intensive sources like large message buffers or caching.
- AND (composite): Combines multiple sub-policies with AND logic. All sub-policies must be true simultaneously to trigger rate limiting. Use when you want conservative rate limiting (both CPU and memory must be high).
- OR (composite): Combines multiple sub-policies with OR logic. Any sub-policy can trigger rate limiting. Use when you want aggressive rate limiting (either CPU or memory being high triggers).
- Select Evaluation Mode. Choose how the policy behaves when thresholds are exceeded:
- Enforce (default): Actively applies rate limiting when thresholds are met. Pull-based sources (File, S3, HTTP Pull) stop fetching new data, push-based sources (HTTP, TCP, UDP, OTLP) reject incoming data, and stream-based sources (Kafka, Pub/Sub) pause consumption. Use in production to protect agent resources.
- Monitor: Logs when rate limiting would occur without actually limiting data flow. Use for testing thresholds before enforcing them in production.
- Passthrough: Disables rate limiting entirely while keeping the configuration in place. Use to temporarily disable rate limiting without removing configuration.
- Set Absolute Limits and Relative Limits (for CPU Usage and Memory Usage policies)
Note: If you specify both absolute and relative limits, the system evaluates both conditions and rate limiting triggers when either condition is met (OR logic). For example, if you set absolute limit to
1.0CPU cores and relative limit to50%, rate limiting triggers when the source uses either 1 full core OR 50% of available CPU, whichever happens first.
For CPU Absolute Limits: Enter value in full core units:
0.1= one-tenth of a CPU core0.5= half a CPU core1.0= one full CPU core2.0= two full CPU cores
For CPU Relative Limits: Enter percentage of total available CPU (0-100):
50= 50% of available CPU75= 75% of available CPU85= 85% of available CPU
For Memory Absolute Limits: Enter value in bytes
104857600= 100Mi (100 × 1024 × 1024)536870912= 512Mi (512 × 1024 × 1024)1073741824= 1Gi (1 × 1024 × 1024 × 1024)
For Memory Relative Limits: Enter percentage of total available memory (0-100)
60= 60% of available memory75= 75% of available memory80= 80% of available memory
- Set Refresh Interval (for CPU Usage and Memory Usage policies). Specify how frequently the system checks resource usage:
- Recommended Values:
10sto30sfor most use cases5sto10sfor high-volume sources requiring quick response1mor higher for stable, low-volume sources
The system fetches current CPU/memory usage at the specified refresh interval and uses that value for evaluation until the next refresh. Shorter intervals provide more responsive rate limiting but incur slightly higher overhead, while longer intervals are more efficient but slower to react to sudden resource spikes.
The GUI generates YAML as follows:
# Simple CPU-based rate limiting
nodes:
  - name: <node name>
    type: <node type>
    rate_limit:
      evaluation_policy:
        policy_type: cpu_usage
        evaluation_mode: enforce
        absolute_limit: 0.5  # Limit to half a CPU core
        refresh_interval: 10s
# Simple memory-based rate limiting
nodes:
  - name: <node name>
    type: <node type>
    rate_limit:
      evaluation_policy:
        policy_type: memory_usage
        evaluation_mode: enforce
        absolute_limit: 536870912  # 512Mi in bytes
        refresh_interval: 30s
Composite Policies (AND / OR)
When using AND or OR policy types, you define sub-policies instead of limits. Sub-policies must be siblings (at the same level)—do not nest sub-policies within other sub-policies. Each sub-policy is independently evaluated, and the parent policy’s evaluation mode applies to the composite result.
- AND Logic: All sub-policies must evaluate to true at the same time to trigger rate limiting. Use when you want conservative rate limiting (limit only when CPU AND memory are both high).
- OR Logic: Any sub-policy evaluating to true triggers rate limiting. Use when you want aggressive protection (limit when either CPU OR memory is high).
Configuration Steps:
- Select AND (composite) or OR (composite) as the Policy Type
- Choose the Evaluation Mode (typically Enforce)
- Click Add New under Sub-Policies to add the first condition
- Configure the first sub-policy by selecting policy type (CPU Usage or Memory Usage), selecting evaluation mode, setting absolute and/or relative limits, and setting refresh interval
- In the parent policy (not within the child), click Add New again to add a sibling sub-policy
- Configure additional sub-policies following the same pattern
The GUI generates YAML as follows:
# AND composite policy - both CPU AND memory must exceed limits
nodes:
  - name: <node name>
    type: <node type>
    rate_limit:
      evaluation_policy:
        policy_type: and
        evaluation_mode: enforce
        sub_policies:
          # First sub-policy (sibling)
          - policy_type: cpu_usage
            evaluation_mode: enforce
            absolute_limit: 0.75  # Limit to 75% of one core
            refresh_interval: 15s
          # Second sub-policy (sibling)
          - policy_type: memory_usage
            evaluation_mode: enforce
            absolute_limit: 1073741824  # 1Gi in bytes
            refresh_interval: 15s
# OR composite policy - either CPU OR memory can trigger
nodes:
  - name: <node name>
    type: <node type>
    rate_limit:
      evaluation_policy:
        policy_type: or
        evaluation_mode: enforce
        sub_policies:
          - policy_type: cpu_usage
            evaluation_mode: enforce
            relative_limit: 85  # 85% of available CPU
            refresh_interval: 20s
          - policy_type: memory_usage
            evaluation_mode: enforce
            relative_limit: 80  # 80% of available memory
            refresh_interval: 20s
# Monitor mode for testing thresholds
nodes:
  - name: <node name>
    type: <node type>
    rate_limit:
      evaluation_policy:
        policy_type: memory_usage
        evaluation_mode: monitor  # Only logs, doesn't limit
        relative_limit: 70  # Test at 70% before enforcing
        refresh_interval: 30s
How to Use the Windows Events Connector
The Windows Events connector integrates seamlessly with AI Team, enabling data ingestion from Windows infrastructure. AI teammates automatically leverage Windows Events data to monitor system health, investigate security incidents, analyze application failures, and troubleshoot Windows services.
Use Case: Application Error Monitoring
Monitor application crashes and errors on Windows servers. AI teammates analyze Application channel events to identify failing applications, detect error patterns, and correlate crashes with system changes. This is valuable for troubleshooting application stability issues and identifying problematic updates.
Configuration:
- Channel:
Application
Common Event IDs:
- 1000 - Application Error (crash)
- 1001 - Application Error reporting
- 1002 - Application hang
Use Case: Security Incident Investigation
Track security events for intrusion detection and compliance. AI teammates analyze Security channel events to detect failed login attempts, identify unauthorized access, track privilege escalation, and monitor security policy changes. Combined with PagerDuty alerts, teammates automatically investigate security incidents.
Configuration:
- Channel:
Security
Common Event IDs:
- 4624 - Successful logon
- 4625 - Failed logon attempt
- 4648 - Logon with explicit credentials
- 4672 - Special privileges assigned to new logon
- 4688 - New process created
- 4697 - Service installed
Use Case: Windows Service Monitoring
Monitor Windows services for failures and restarts. AI teammates analyze System channel events to detect service crashes, identify startup failures, and track unexpected restarts. This enables proactive service health monitoring across Windows infrastructure.
Configuration:
- Channel:
System
Common Event IDs:
- 7034 - Service crashed unexpectedly
- 7036 - Service entered running/stopped state
- 7040 - Service startup type changed
- 7045 - New service installed
Troubleshooting
No events collected: Verify Edge Delta running on Windows system with Get-Service edgedelta. Check agent has permissions to read channel (Security requires Administrator or Event Log Readers). Confirm channel name spelled exactly as in Event Viewer (eventvwr.msc). Review Edge Delta logs for permission errors.
Access denied on Security channel: Security channel requires elevated permissions. Add Edge Delta service account to Event Log Readers group or run as Administrator. Verify with wevtutil gl Security to check channel permissions. Restart Edge Delta service after permission changes.
Events missing or delayed: Check Event Log service running with Get-Service EventLog. Verify Windows Event Log not full (default 20MB, rotates automatically). Monitor Event Log for errors with Event ID 1104 (log cleared), 6008 (unexpected shutdown). Increase Event Log size if frequently full.
High CPU usage on Windows agent: Reduce event volume with rate limiting. Monitor event rate in Event Viewer. Check for misconfigured applications generating excessive logs. Filter events at source when possible. Deploy multiple agents if needed.
Channel not found: Verify channel exists in Event Viewer. Channel names are case-sensitive. Some channels only exist after specific Windows features installed (IIS, DNS, etc.). Use exact path for operational channels (e.g., Microsoft-Windows-PowerShell/Operational). Check for typos in channel name.
Events truncated or incomplete: Some events contain large XML data. Check Edge Delta logs for parsing errors. Verify Windows Event Log XML format valid. Monitor for corrupt events in Event Viewer. Increase memory if processing very large events.
Forwarded events not appearing: Verify Windows Event Collector (WEC) configured correctly if using ForwardedEvents channel. Check source systems forwarding to correct collector. Verify WinRM service running on both source and collector. Test with wecutil ss to check subscriptions.
Next Steps
- Learn about Windows Event source configuration for advanced pipeline integration
- Learn about Edge Delta MCP connector for querying Windows Events data
- Learn about creating custom teammates that can use Windows Events data
For additional help, visit AI Team Support.