K8s Workloads
3 minute read
Overview
Click Dashboards and select the K8s Workloads tab to view the Deployments, CronJobs, StatefulSets, ReplicaSets and DaemonSets detected in your clusters by your Edge Delta Agents.
Metrics have the following prerequisites:
- To ingest Kube State Metrics, KSM must be deployed in the same cluster as the Edge Delta agent.
- To ingest node-exporter metrics, node-exporter must be deployed in the same cluster as the Edge Delta agent.
- All metric processing nodes, such as logs to metrics nodes, must be connected to the Metrics destination node.
The Edge Delta agent uses eBPF to collect network metrics. Therefore, the following Kubernetes environment configuration is required for Kubernetes network metrics and eBPF to work:
- Linux kernel version 5.8 or later.
- Linux kernel built with the
CONFIG_DEBUG_INFO_BTF=yandCONFIG_DEBUG_INFO_BTF_MODULES=yflags.
To check for the flag:
docker run -it --rm --privileged --pid=host ubuntu nsenter -t 1 -m -u -n -i sh -c 'cat /proc/config.gz | gunzip | grep CONFIG_DEBUG_INFO_BTF'
The output should show CONFIG_DEBUG_INFO_BTF=y and CONFIG_DEBUG_INFO_BTF_MODULES=y.
In the case of minikube, the agent can run on minikube with the Docker driver. Docker must be at least v26.0.0 (Docker Desktop v4.29.0) and it is started as follows:
minikube start --driver docker
If you want to disable eBPF:
- Delete the Kubernetes Traffic source node.
- Disable the tracer:
Helm
Rerun the Helm upgrade command with the --set tracerProps.enabled=false flag.
Kubectl Update and re-apply the kubernetes manifest with the following parameter change:
ED_ENABLE_TRAFFIC_TRACER = "0"
Workloads
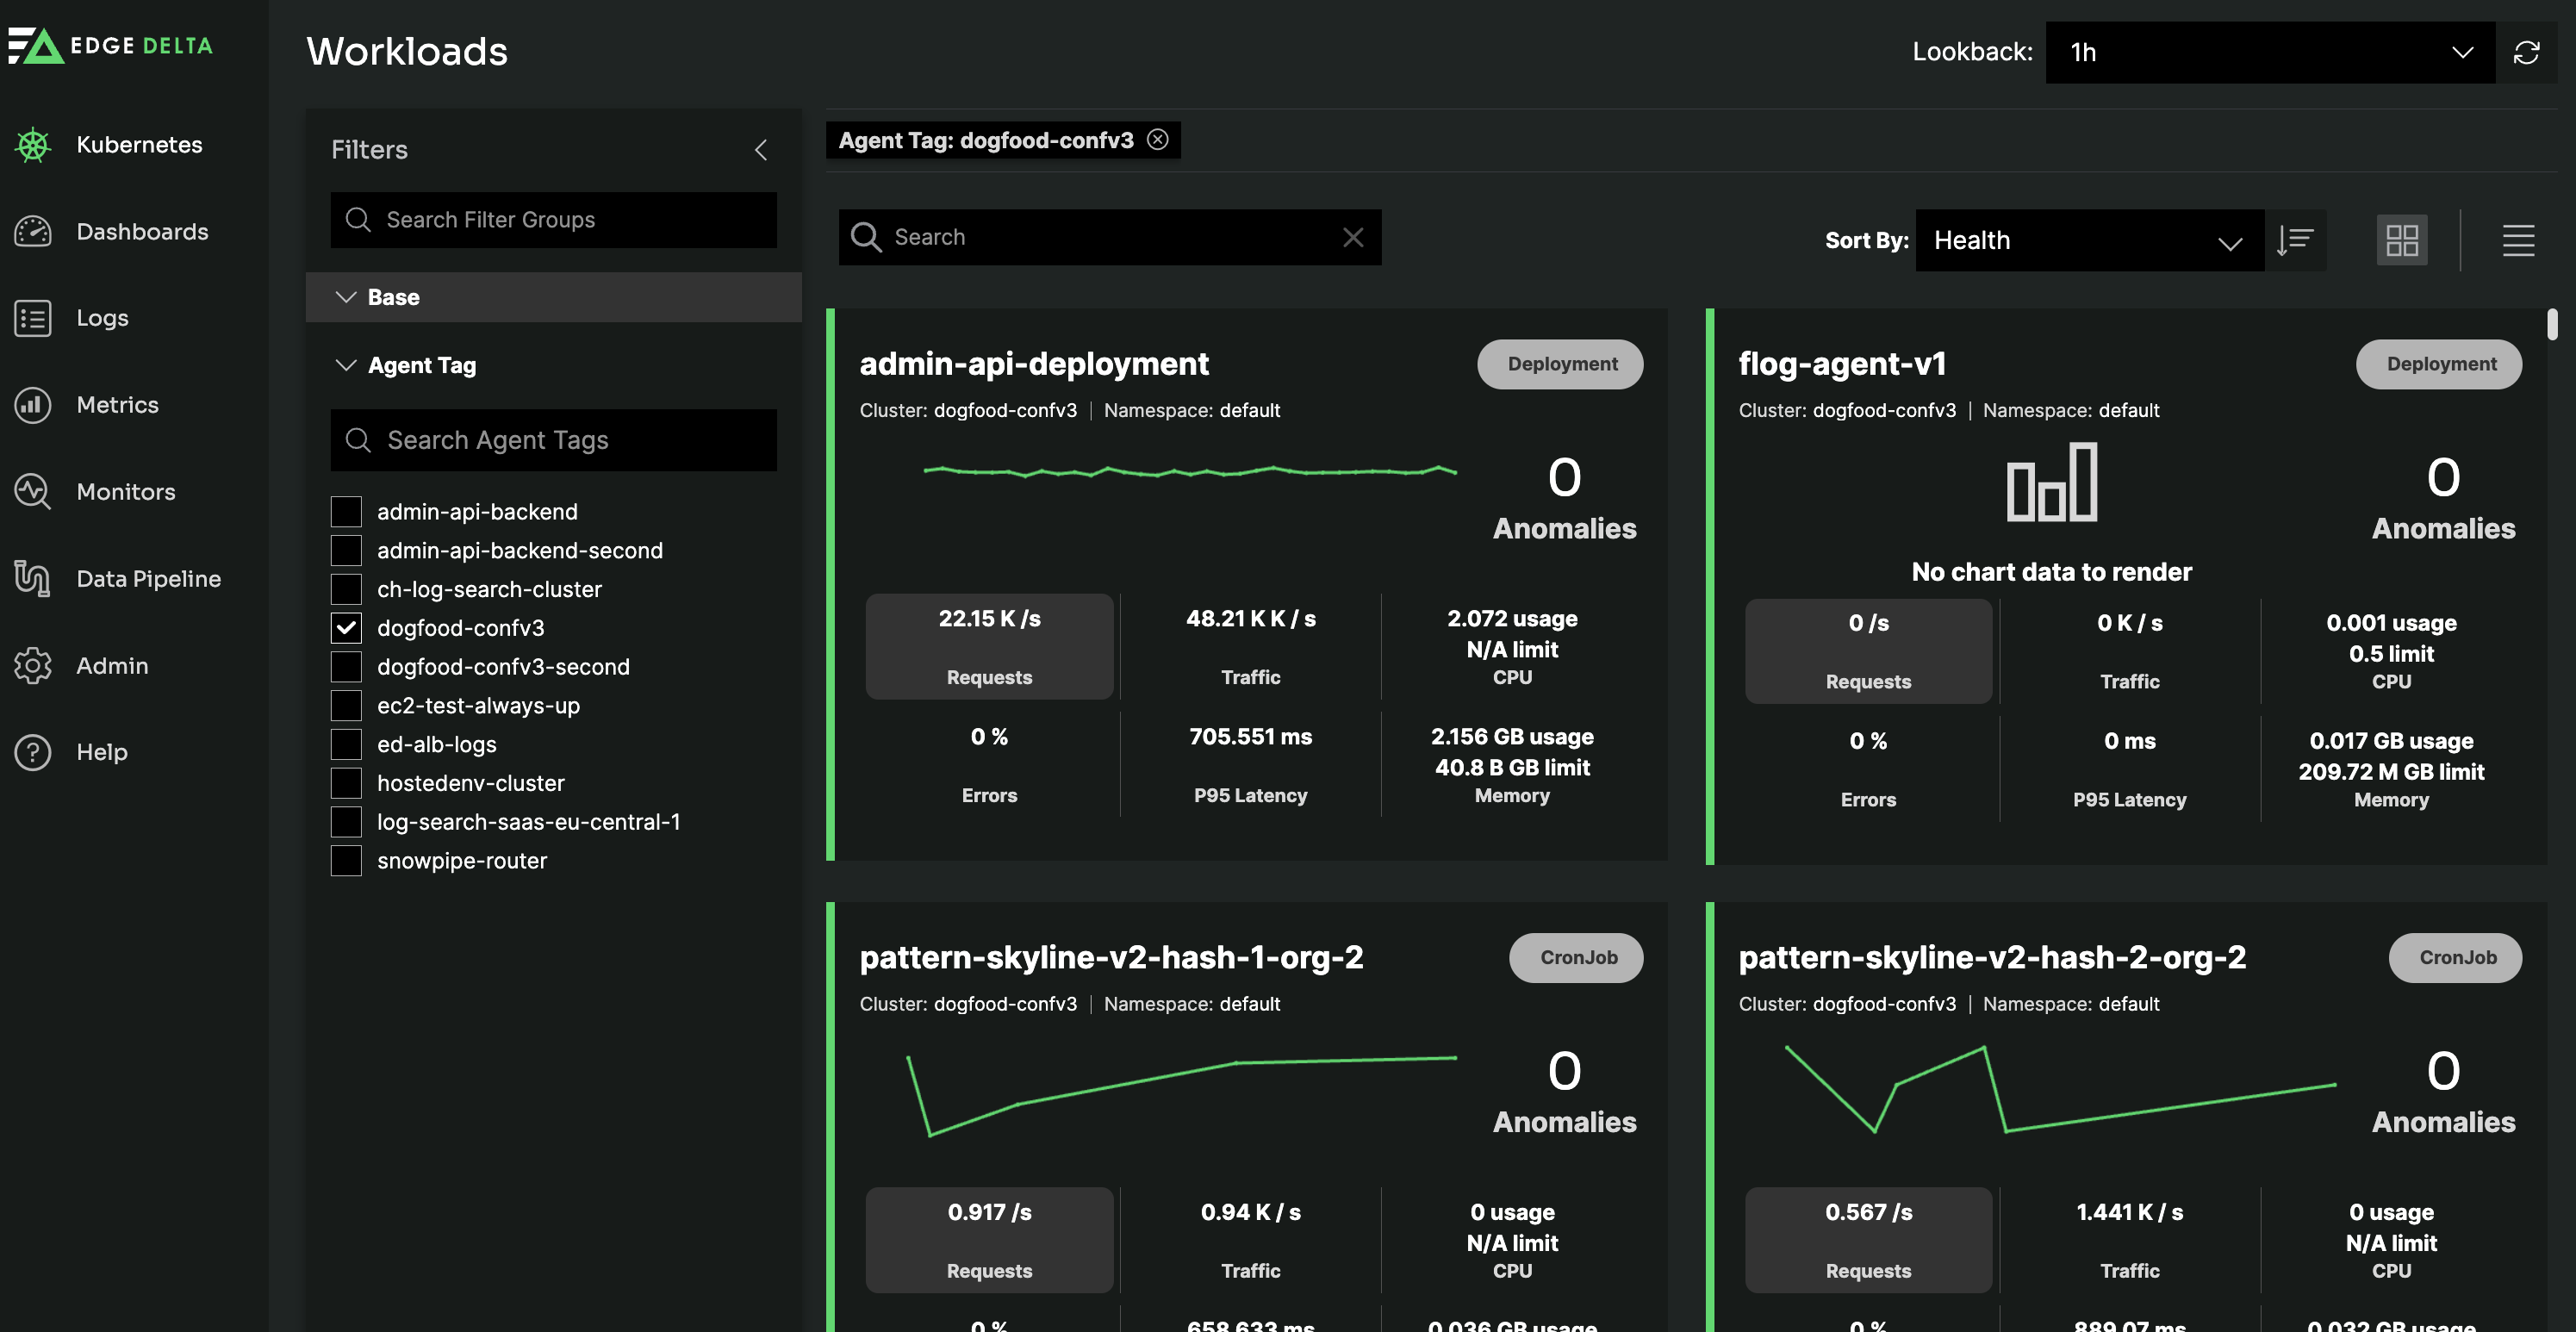
You can filter the workloads by agent tag in the Filters pane and search for particular workloads in the Filters bar. You can also sort by different attributes and set the lookback period.
The sort by Health option orders the workloads by anomaly and sentiment count.
Each workload lists the cluster name, namespace, and Kubernetes resource type.
Golden Signals
Each Workload card shows real-time Golden Signal metrics for that particular workload. Each card also shows a high level graph for the selected Golden Signal metric to see trends at a glance. Each card also shows summary metrics.
- Request Count
- Traffic Volume (which includes both incoming and outgoing traffic volumes)
- Error Count
- P95 Latency
- CPU and
- MEM Usage
Click any of the Golden Signal metrics on any card to change the data that’s displayed for every workload. For example, clicking on P95 Latency in one Workload card will change every Workload card to display P95 Latency, allowing you to view the same Golden Signal data across all workloads.
Workload Details
Click a Workload card to view Workload details, including all Golden Signal metrics for that Workload. You can zoom into any metrics chart by selecting a section of the metrics data, this adjusts the look back period for a specific time period.
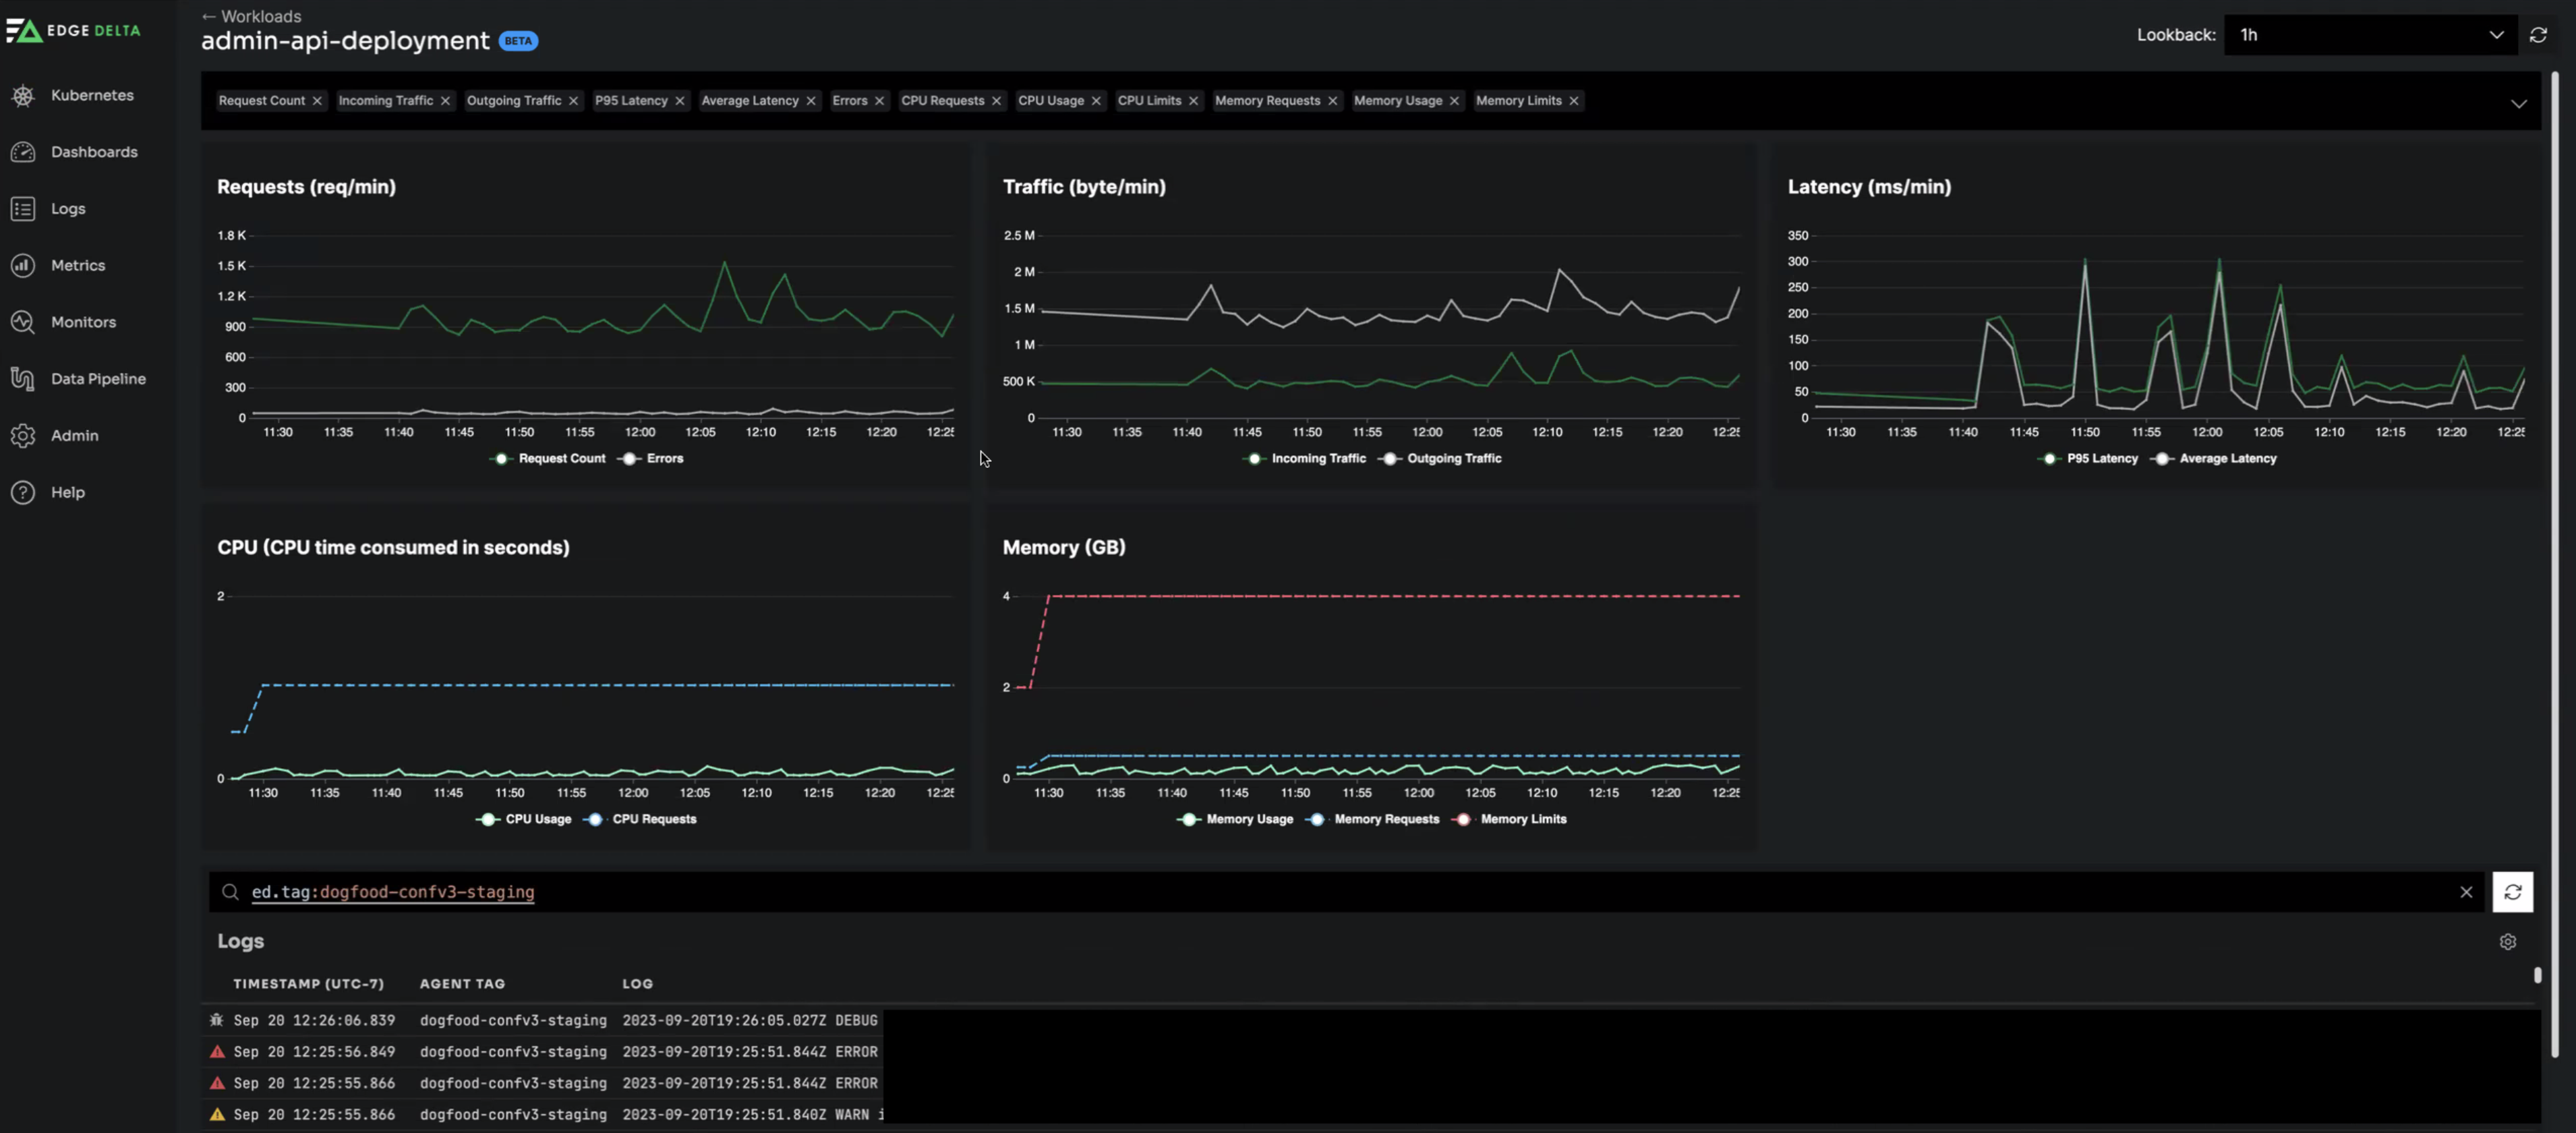
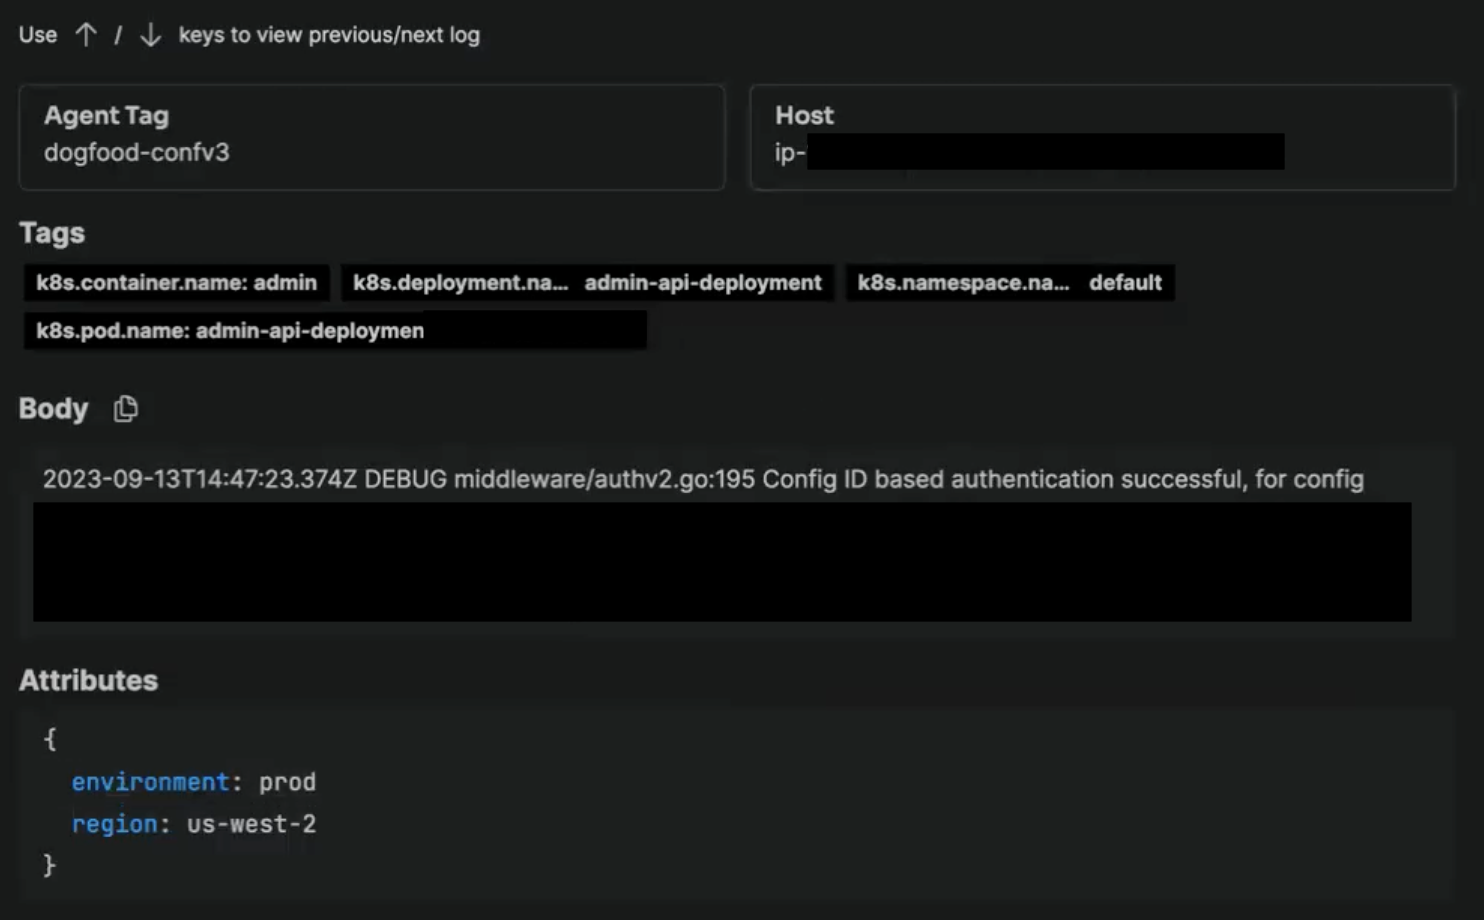
The logs pane is scoped to the logs from the workload being viewed. You filter the logs list by agent tag for the workload in the Search bar or you can filter on other resources using OTEL style resource names. You select a log to view more details about it.