Pipeline Triggers
Configure threshold-based triggers in Edge Delta pipelines to send alerts to webhooks, Slack, and other destinations.
4 minute read
Overview
Edge Delta provides two complementary approaches to threshold-based alerting:
| Approach | Location | Scope | Use Case |
|---|---|---|---|
| Pipeline Triggers | Edge (within pipelines) | Single pipeline | Low-latency alerts for pipeline-specific conditions |
| Monitors | Centralized back end | All pipelines | Cross-pipeline correlation and aggregated thresholds |
This page covers Pipeline Triggers, which operate at the edge within individual pipelines. For centralized monitoring across all pipelines, see Monitors.
Pipeline Triggers vs Monitors
The following diagram illustrates how both alerting approaches work together:
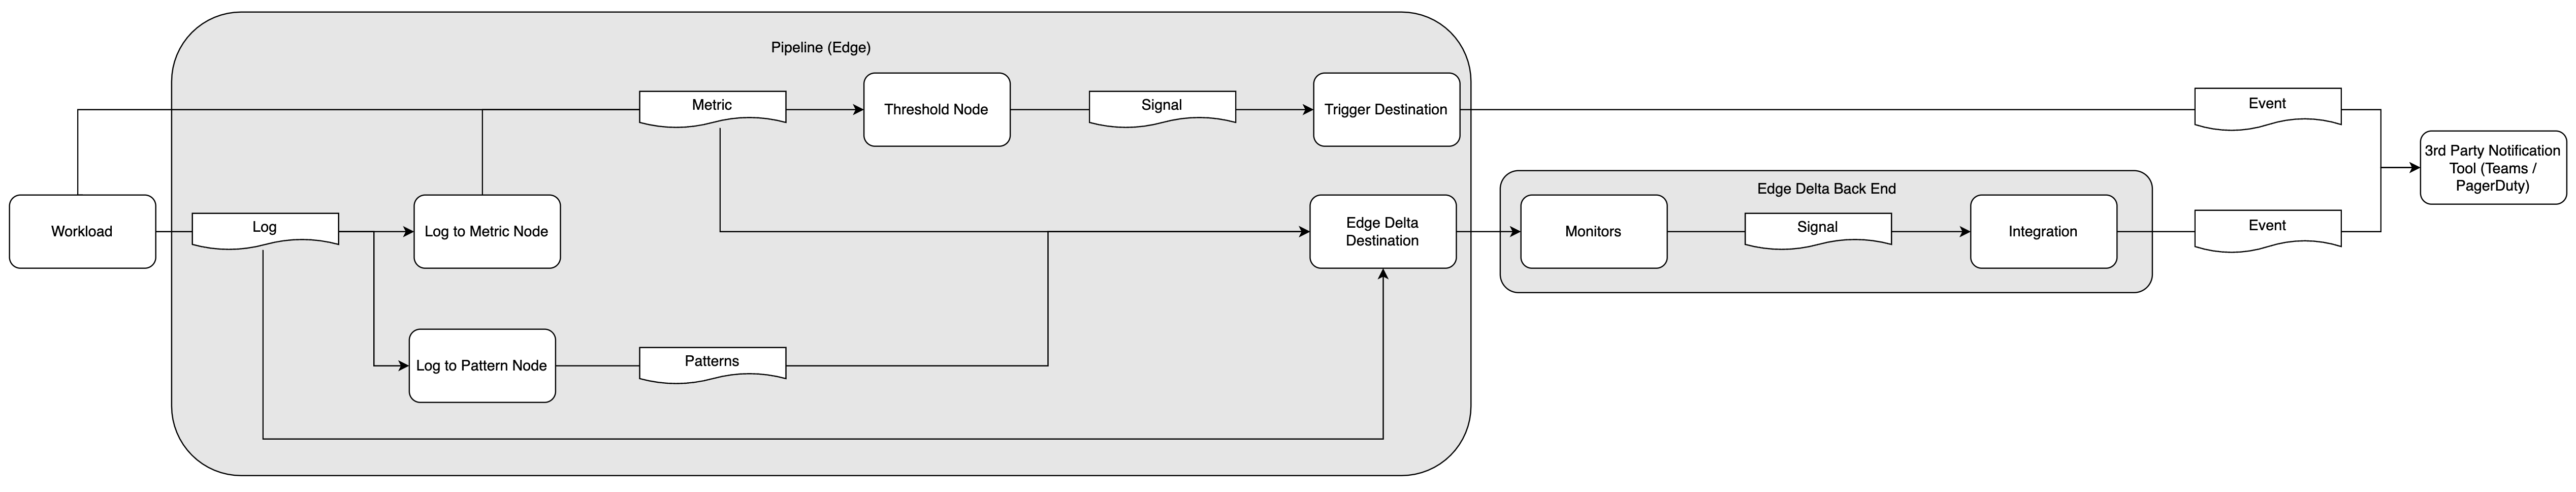
A workload generates logs and metrics. Data flows through the pipeline where it can take two paths:
Edge path (Pipeline Triggers): Metrics flow to a threshold node within the pipeline. If conditions are met, a signal is sent directly to a trigger destination (webhook, Slack, etc.). These alerts are specific to that single pipeline and provide the lowest latency response.
Central path (Monitors): Data flows to the Edge Delta Destination, which archives logs, metrics, and patterns in the Edge Delta back end. Monitors then evaluate this aggregated data across all pipelines.
When to Use Pipeline Triggers
Pipeline triggers are ideal when you need to:
- Minimize alert latency: Respond immediately to conditions without waiting for data to reach the back end
- Alert on pipeline-specific conditions: Trigger notifications for issues relevant to a single service or environment
- Reduce back-end load: Process alerts at the edge without requiring centralized evaluation
- Isolate alert logic: Keep alerting configuration close to the data source it monitors
Threshold-based alerts automate the detection of anomalies by signaling when a metric crosses a predefined threshold, such as a spike in error rates, a drop in throughput, or unusual resource consumption. By alerting only when thresholds are breached, teams can respond to significant events without being overwhelmed by minor fluctuations.
Alerts and Triggers on the Edge
Monitoring system health at the edge is increasingly important in modern, distributed IT environments. By transforming verbose log data into actionable metrics directly at the edge, organizations reduce data volume and processing overhead while gaining clearer, more immediate insights. This is particularly beneficial for systems that span many locations or generate high volumes of telemetry data.
Using edge-based processing to aggregate logs into metrics simplifies data management and supports real-time analysis. This enables quicker identification of issues and trends that would otherwise be buried in raw logs. The result is a more scalable and cost-effective observability approach that enhances responsiveness across complex architectures.
How Pipeline Triggers Work
Data processing: Logs flow through your pipeline and are processed by nodes such as Extract Metric and Aggregate Metric to create metrics.
Threshold evaluation: A Threshold node evaluates the metrics against defined conditions.
Signal generation: When conditions are met, the threshold node generates a signal containing context about the triggered alert.
Destination delivery: The signal is sent to a destination node (webhook, Slack, etc.) which formats and delivers the notification.
Implementing Metric-Based Monitoring Effectively
- Identify key performance indicators (KPIs) and service level indicators (SLIs): Derive metrics from logs and telemetry that reflect system performance, reliability, and user experience.
- Aggregate data near the source: Use edge processing to transform and reduce raw data early, minimizing transfer and storage overhead.
- Select appropriate aggregation intervals: Choose intervals (e.g., per minute, per hour) that balance responsiveness with data volume and clarity.
- Establish baselines: Record metrics under normal operating conditions to understand typical system behavior and inform initial threshold values.
- Set thresholds with context: Define thresholds that reflect the expected behavior of each component or service. The same metric may require different thresholds depending on its role or environment.
- Refine thresholds iteratively: Use historical trends and incident postmortems to tune thresholds over time. Avoid static thresholds that no longer reflect real-world usage patterns.
- Avoid overly sensitive thresholds: Prevent alert fatigue by accounting for natural variability. Focus alerts on meaningful deviations that require attention.
- Review and adjust regularly: Reevaluate aggregation logic and thresholds as the system and business needs evolve, ensuring the monitoring remains relevant and actionable.
Getting Started
| Guide | Description |
|---|---|
| Trigger a Metric Threshold | Configure a threshold node to trigger alerts based on metric conditions |
Webhook Integrations
| Guide | Description |
|---|---|
| Webhook Destination Reference | Full reference for the webhook destination node |
| Send Alerts to Microsoft Teams | Send alerts to Teams using Adaptive Cards |
| Send Alerts to Microsoft Teams with Power Automate | Recommended approach for new Teams integrations |
| Send Alerts to Slack | Slack destination and webhook with Block Kit |
| Send Alerts to ServiceNow | Create ServiceNow incidents from alerts |
| Send Alerts to PagerDuty | Trigger PagerDuty incidents using Events API v2 |
| Send Alerts to Opsgenie | Create Opsgenie alerts for incident management |
Metrics to Webhooks
| Guide | Description |
|---|---|
| Send Metrics to a Webhook | Extract metrics from logs and send to a webhook |
| Send Metrics to a Custom API | Send metrics to custom dashboard APIs |