Anomaly Detection
Edge Delta's Anomaly Detection organizes logs into patterns, evaluates anomalies, and provides insights for AI monitoring and service performance.
6 minute read
Edge Delta’s Anomaly Detection capabilities enable intelligent telemetry data that help teams reduce noise, catch regressions earlier, and support applied observability use cases such as AI monitoring and service performance tracking. Edge Delta supports cost-aware observability by organizing logs into patterns, evaluating those patterns for anomalies, and providing clear, actionable insights. This results in higher signal-to-noise, faster detection, and cleaner telemetry for downstream systems.
Pattern Detection and Sentiment Evaluation
Edge Delta uses the Drain algorithm to dynamically aggregate log entries into patterns. The algorithm groups similar logs by replacing variable elements—timestamps, request IDs, user identifiers, and other dynamic values—with wildcards while preserving the structural template. This approach identifies recurring log structures regardless of specific parameter values.
For example, logs like:
User 12345 logged in from 192.168.1.1User 67890 logged in from 10.0.0.5
Become a single pattern: User * logged in from *
These patterns can be counted and summarized instead of streaming all logs. This reduces the volume of data sent downstream while preserving the structure and meaning of the logs.
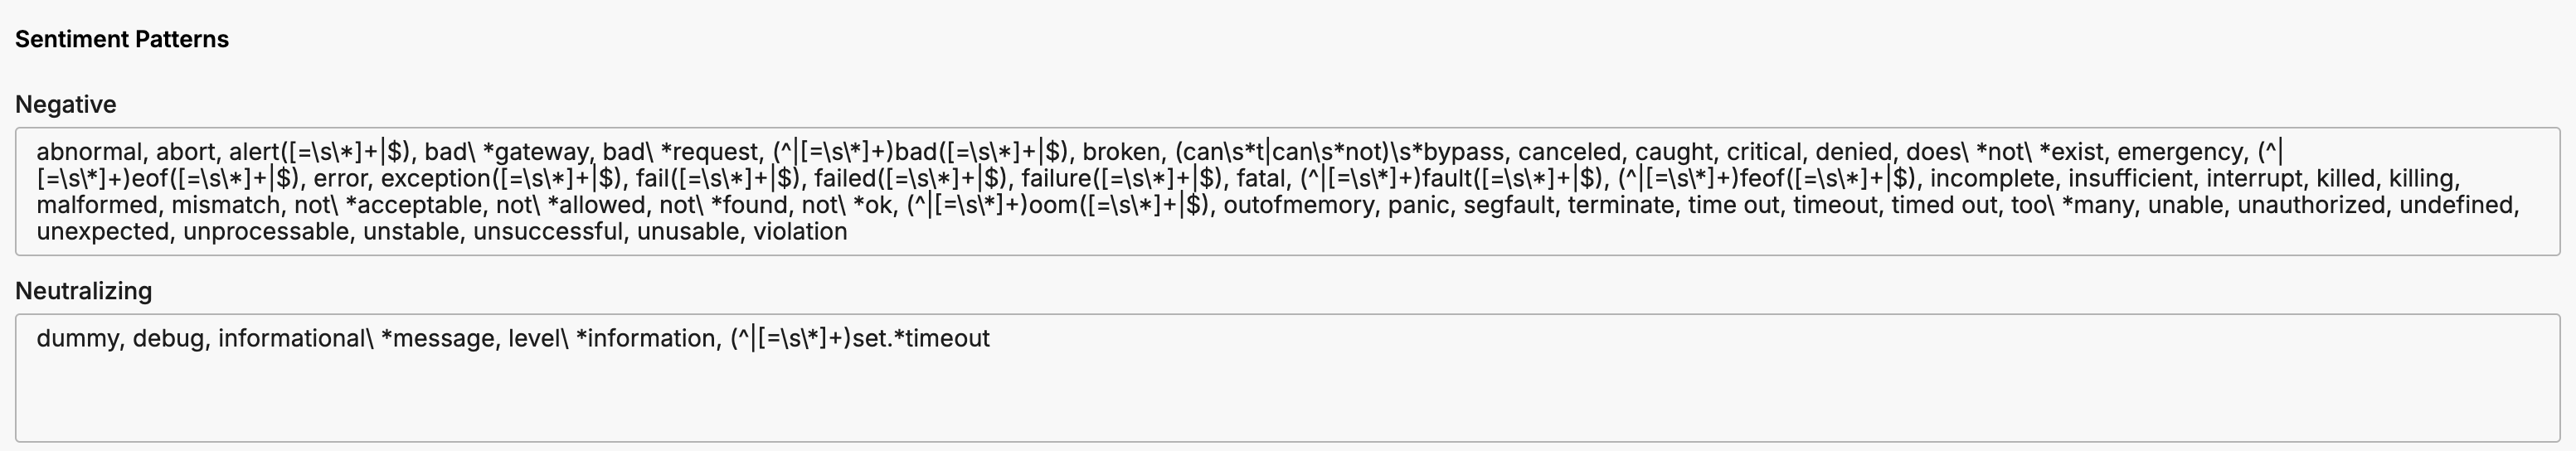
Each pattern is evaluated for sentiment and classified as either negative or neutral. This process checks for signs of instability, failure, or degradation using custom keyword or regex matches such as error, failed, or panic.
You can also configure neutralizing terms like debug that prevent false positives when present in a pattern. To modify sentiment logic, visit the Global Data Settings tab of the Admin page. Restart the agent after making changes for them to take effect.
How Anomaly Scoring Works
Edge Delta evaluates pattern behavior against a historical baseline to determine whether current activity is anomalous. The scoring pipeline operates in three stages:
Baseline establishment. The system collects pattern frequency and volume data over a rolling window determined by the lookback period configured in the monitor. This window represents normal behavior for each pattern and source combination.
Spike detection. Current pattern counts are compared against the baseline. When a pattern’s count deviates significantly from its baseline, the system registers that deviation as a spike. Both increases in existing negative patterns and the appearance of new patterns contribute to the spike count.
Sensitivity filtering. The sensitivity setting controls how large a deviation must be before the system counts it as a spike. Lower sensitivity means smaller deviations qualify as spikes, producing a higher spike count and more potential alerts. Higher sensitivity requires larger deviations, filtering out minor fluctuations.
The output of this pipeline is a pattern anomaly count: the number of spikes detected in the evaluation window. The Pattern Anomaly Monitor compares this count against your configured warning and alert thresholds.
flowchart LR
    A[Pattern
Metrics] --> B[Baseline
Window]
    B --> C[Compare Current
vs Baseline]
    C --> D[Sensitivity
Filter]
    D --> E[Spike
Count]
    E --> F[Threshold
Evaluation]
Key scoring concepts
| Concept | Description |
|---|---|
| Baseline | A rolling window of historical pattern behavior representing normal activity, determined by the monitor’s lookback period. |
| Spike | A deviation in pattern frequency or volume that exceeds the sensitivity threshold. |
| Sensitivity | Controls the minimum deviation size required to register as a spike. Configure this in the Pattern Anomaly Monitor. |
| Pattern anomaly count | The total number of detected spikes in the evaluation window, compared against warning and alert thresholds. |
Visualizing and Exploring Patterns
The Patterns tab of the Logs page in the Edge Delta web application displays the results of log pattern detection. It highlights changes in volume, frequency, and sentiment, helping you track which behaviors are increasing, decreasing, or disappearing. Filters help focus the view on specific types of behavior. For example, you can isolate patterns that are newly detected or those that have disappeared, using the lifecycle filter.
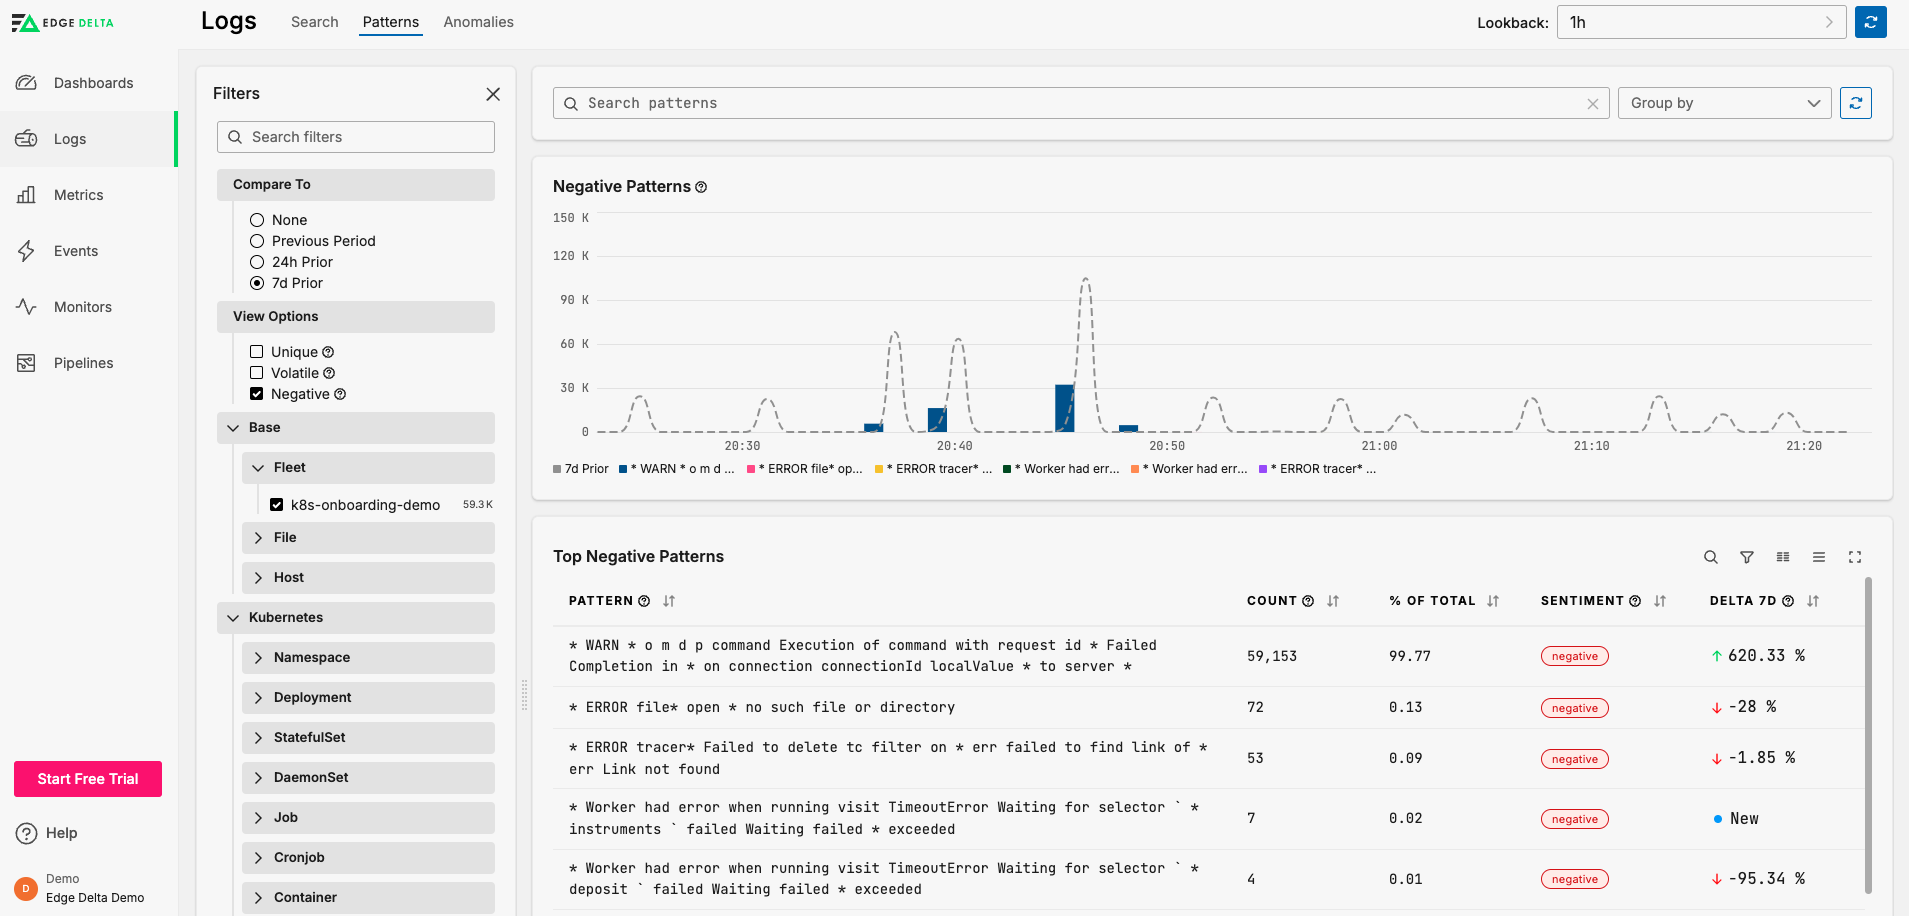
Key Features
- View top patterns by frequency and sentiment
- Compare pattern behavior across time periods
- Filter by sentiment, source, lifecycle status, or tags
- Spot volatile or unique patterns
Drill into specific patterns to review log samples and metadata:
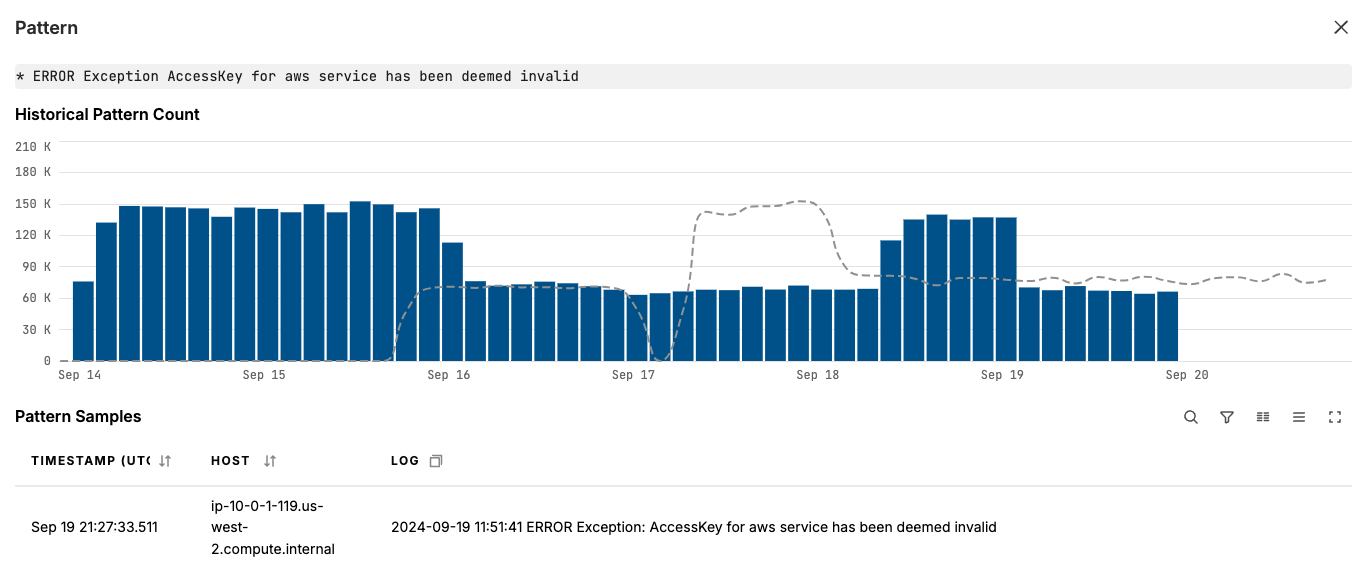
Click Raw JSON to view the pattern data item.
Anomaly Detection and Alerting
Edge Delta continuously analyzes pattern behavior to detect anomalies by comparing current pattern counts against a historical baseline. For details on how baselines, spikes, and sensitivity work together, see How anomaly scoring works.
Each organization starts with two default monitors: a Pattern Anomaly Monitor for service anomaly detection and a Metric Threshold Monitor for pipeline liveness. The Pattern Anomaly Monitor watches for:
- Surges in total volume of negative logs
- Increases in the number of unique negative patterns
- Behavior changes in specific environments or sources
Anomalies can trigger alerts via your preferred incident response platforms, including PagerDuty, Slack, Microsoft Teams, and more.
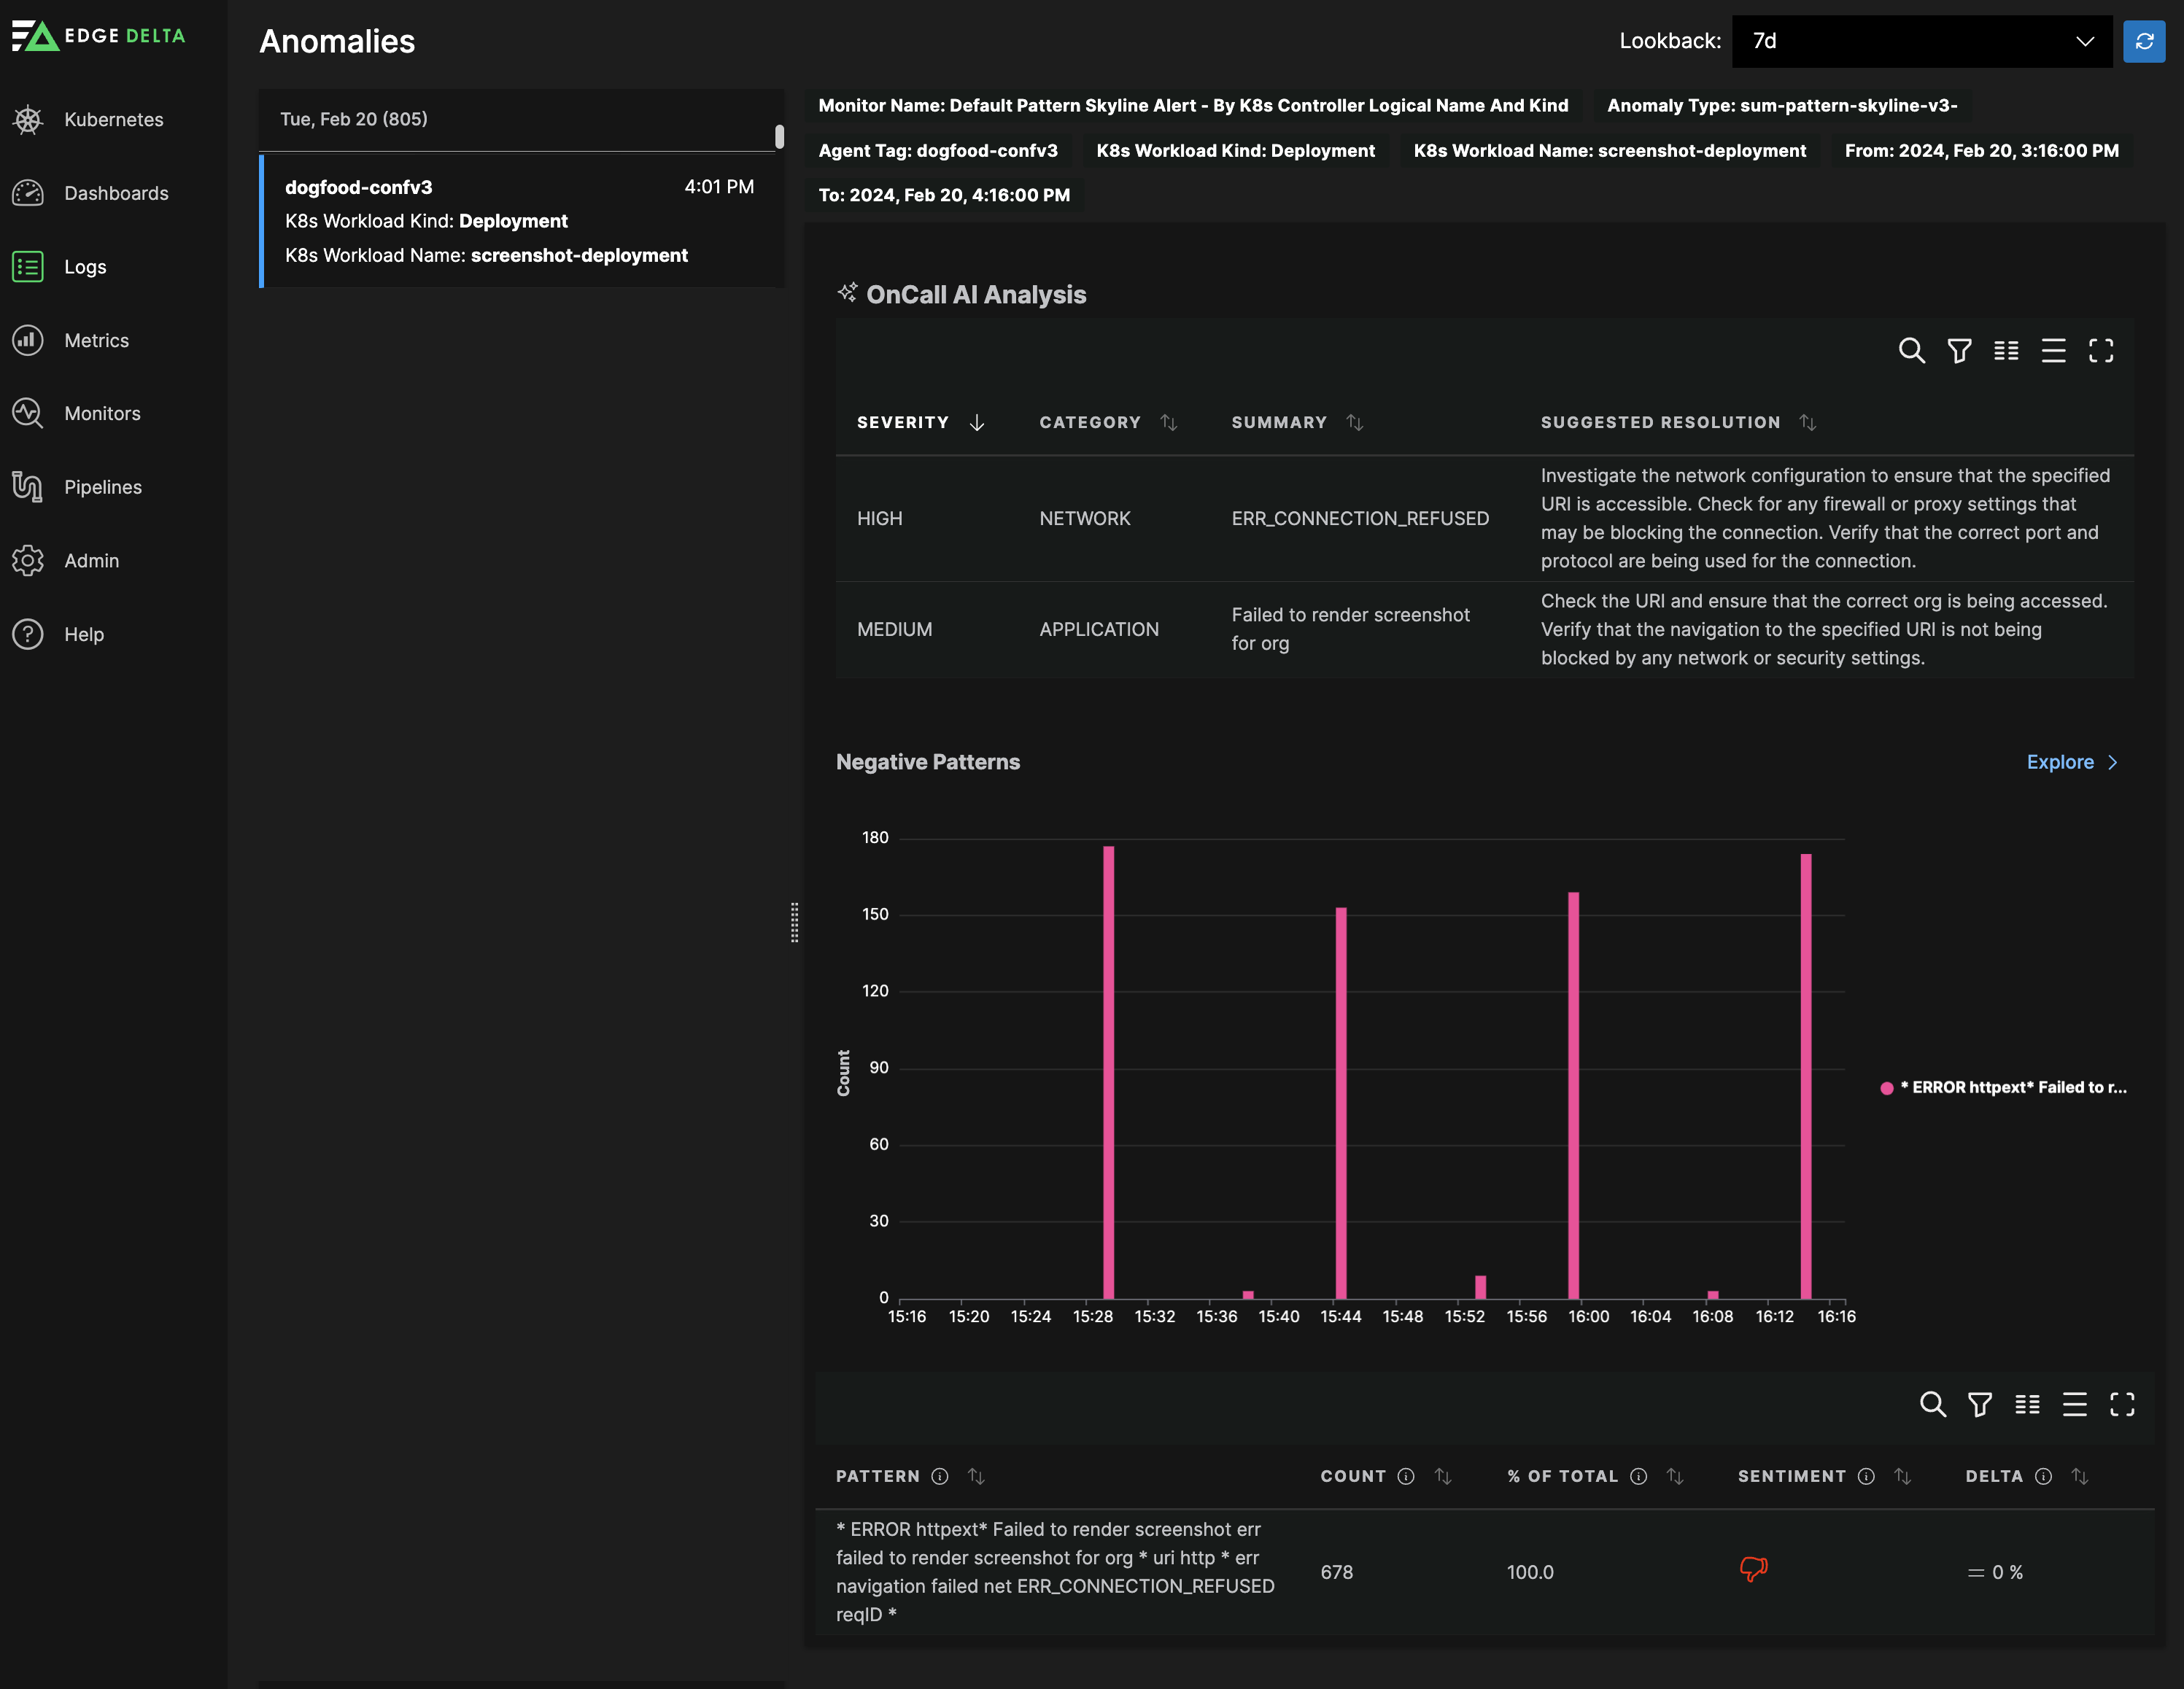
OnCall AI for Context and Remediation
OnCall AI reviews detected anomalies and provides contextual summaries to help engineers understand what changed, why it matters, and how to fix it.
Autonomous Investigation Workflow
When anomalies are detected, AI teammates can investigate autonomously by:
- Pulling relevant telemetry: Querying logs, metrics, and traces related to the affected service during the anomaly window
- Identifying root causes: Analyzing patterns to surface specific error conditions (for example, null pointer exceptions, connection timeouts, or resource exhaustion)
- Proposing remediation: Generating mitigation plans with specific steps based on the identified cause
- Providing context links: Including direct links to relevant log patterns and anomaly events for further investigation
Extended Analysis
Beyond immediate remediation, AI teammates perform deeper analysis when investigating anomalies:
- Historical pattern review: Examining trend data to determine if similar patterns occurred previously
- Cross-service correlation: Identifying statistical relationships between events across services, including services without explicit trace identifiers. For example, teammates can discover that database timeouts consistently precede payment service errors, even when no distributed trace connects the two.
- Change correlation: Linking anomalies to recent deployments, configuration changes, or dependency updates to shift investigation from speculation to evidence
- Failure scenario validation: Evaluating whether the pattern matches known failure modes or represents a new issue
For each anomaly, OnCall AI offers:
- A plain-language summary of the pattern behavior
- Severity and potential impact
- Recommended remediation steps
This helps reduce time-to-resolution and limits alert fatigue by offering clarity and direction.
Benefits for Modern Observability
Edge Delta’s Anomaly Detection is purpose-built to:
- Improve the quality of telemetry flowing into your models and analytics systems
- Reduce observability spend through smart summarization
- Gain insight without ingesting every log
- Use out-of-the-box monitors to surface real problems faster
- Maintain pipeline hygiene across distributed environments
- Feed the broader AIOps cycle where early detection enables proactive response before incidents escalate
Fleet-Wide Alerting
Edge Delta supports multiple alert mechanisms for monitoring your pipelines and infrastructure.
Alert Types
Health alerts cover:
- Agent connectivity failures
- Version drift across pipelines
- Configuration sync failures
- Resource exhaustion (CPU, memory, disk)
Performance alerts trigger on:
- Throughput drops below threshold
- Processing latency exceeding SLA
- Error rate spikes
- Backpressure buildup
Data quality alerts detect:
- Unexpected traffic patterns
- Missing expected data sources
- Schema changes or parsing failures
- Anomalous field values
Integration with Alerting Platforms
Edge Delta integrates with external alerting systems including:
- PagerDuty: Incident management and on-call routing
- Slack: Team notifications and collaboration
- Microsoft Teams: Team notifications and collaboration
- Webhooks: Custom integrations with internal systems
- Email: Direct notifications to operations teams
Learn More
- Configure Log to Pattern node
- Set Up Monitors
- Pattern Anomaly Monitor
- Log Threshold Monitor
- Monitoring and Visibility - Track pipeline health metrics