Effective Pipeline Design
5 minute read
Know your Data
To design an effective data handling pipeline you should have a good understanding of the data your workloads generate. It is important to understand their structure and content, as well as whether they are homogeneous - of the same type and structure.
When logs are ingested into the pipeline, the entire log becomes the body and metadata is added to the log to build an OTEL data item.
Bear in mind that the OTEL source node attempts to use the incoming OTEL log fields.
Build Telemetry Generator Source Templates
Telemetry Templates are used by the Telemetry Generator Source to generate sample logs, metrics or traces. The templates define the data structure of the generated telemetry. This is useful for testing a pipeline with data that looks like your production data.
Enhanced Template Features
- Multi-line log support: Paste multi-line logs directly into templates. The system automatically detects log boundaries using newlines, JSON objects, or custom regex patterns.
- Multi-metric templates: Create templates that generate multiple metrics simultaneously for comprehensive testing scenarios.
- Import/Export capabilities: Share templates between organizations or save them to the shared template library for reuse.
- Attribute enrichment: Add resource attributes to templates for more realistic test data generation.
To access templates, click Pipelines, select the Knowledge tab, and click Telemetry Templates.
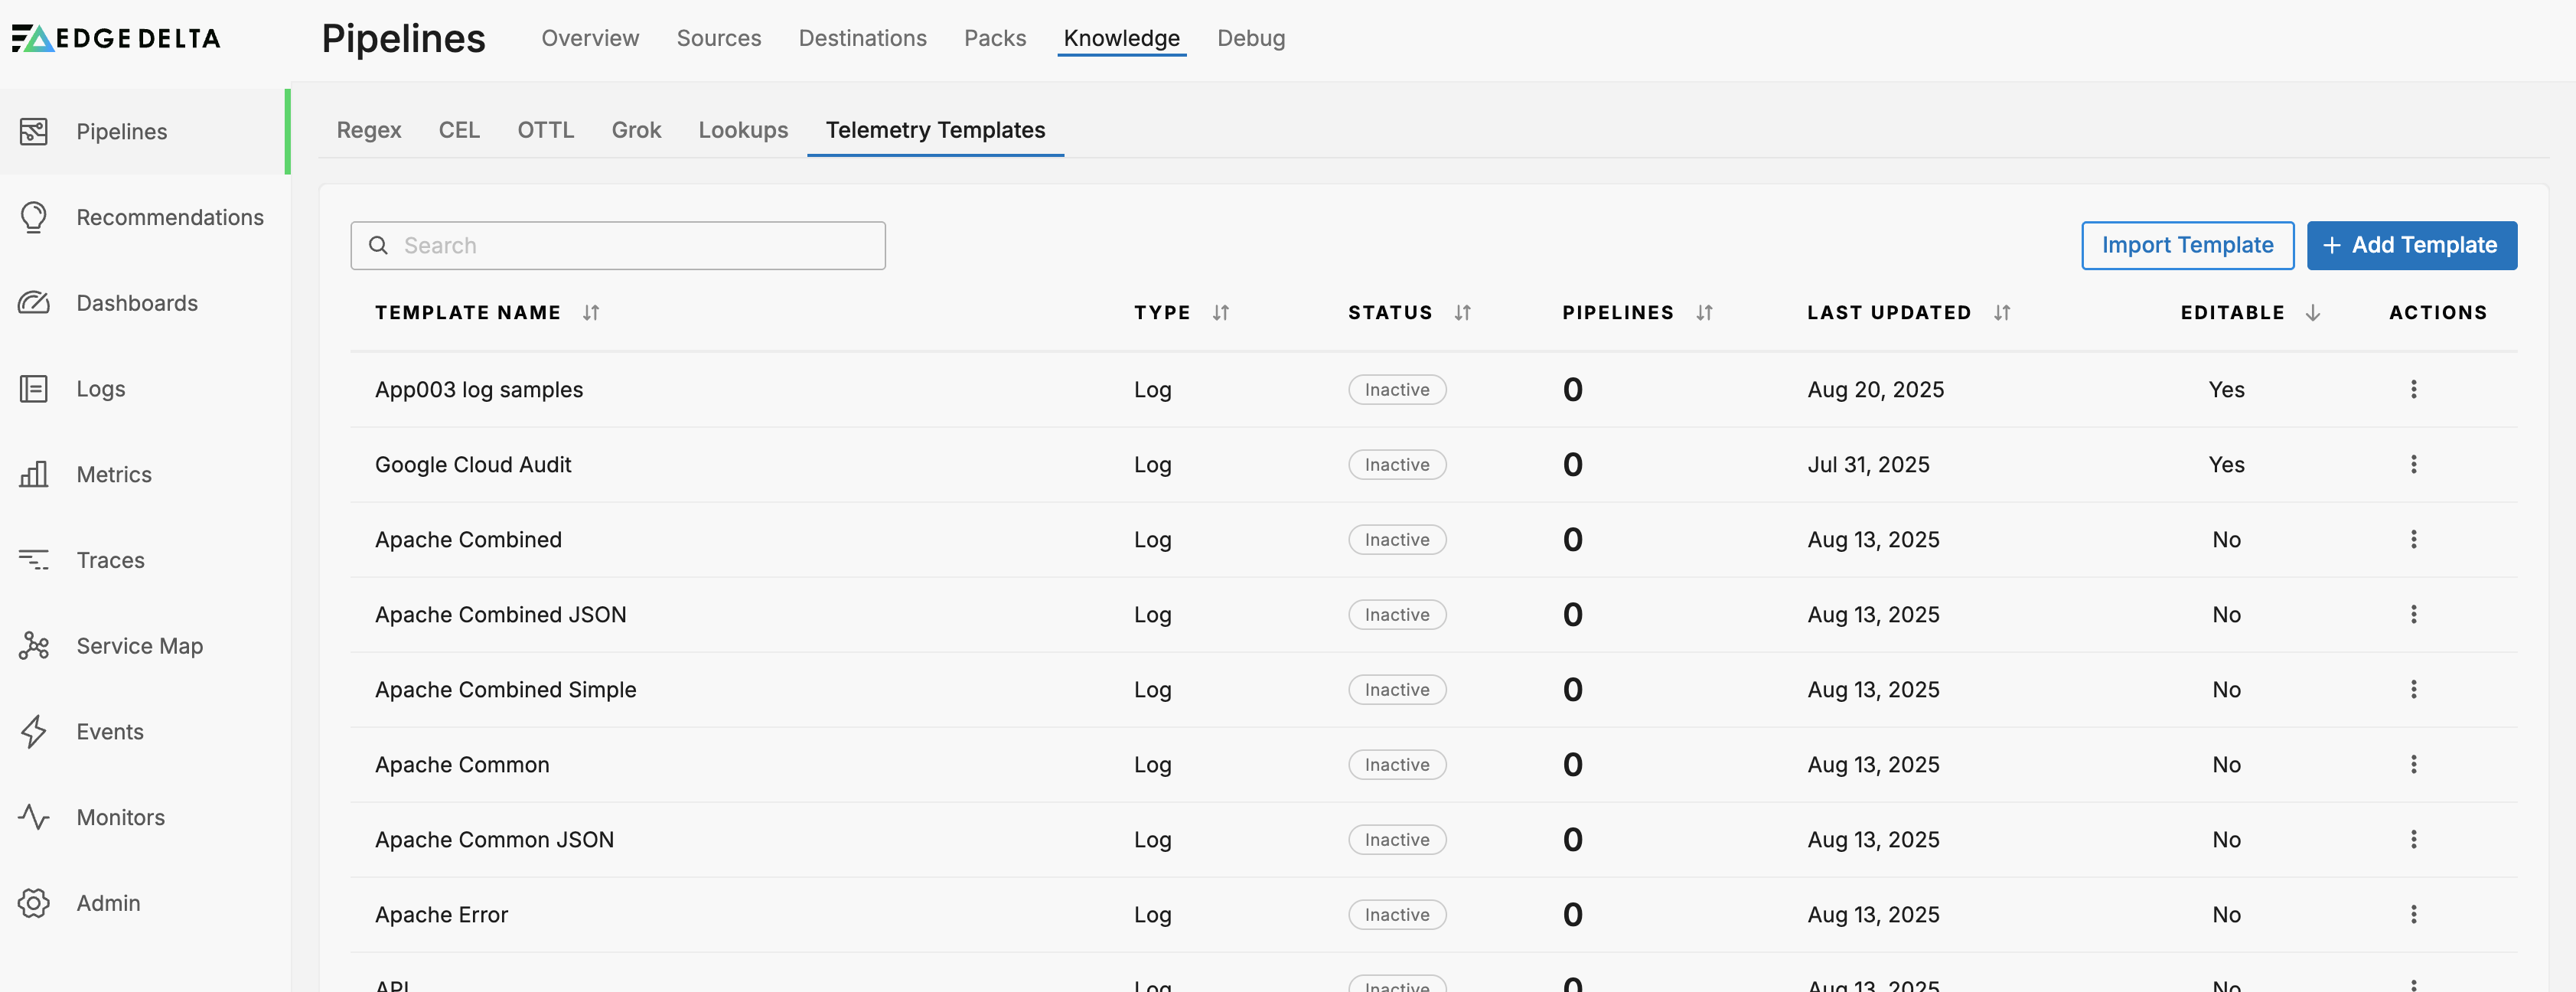
To create a template click Add Template.
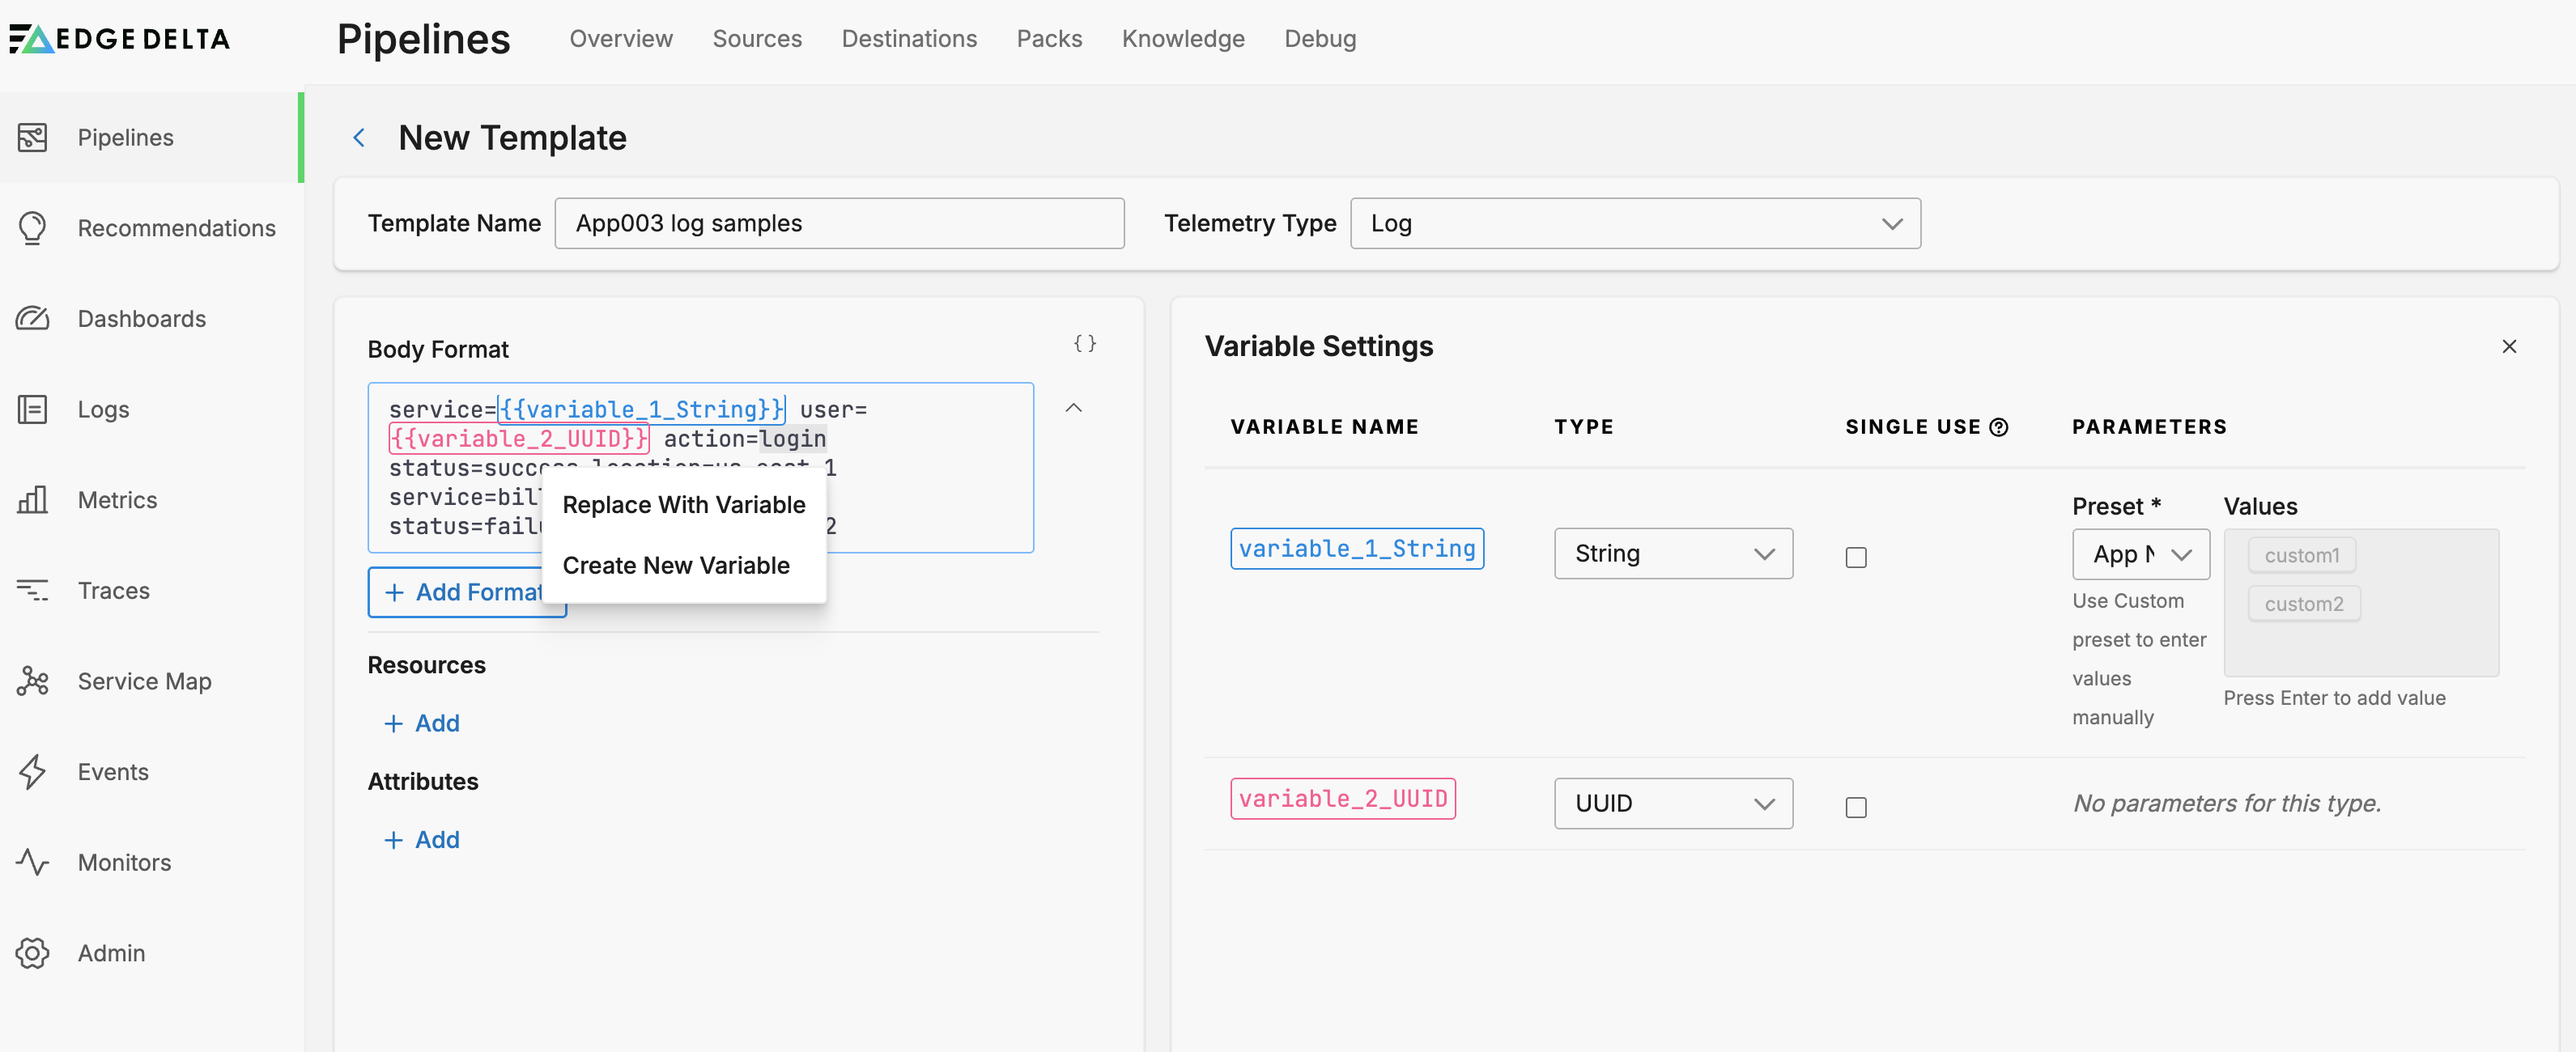
In this example, you create a log template. Paste a sample, preferably of your actual traffic into the Body Format field. Double click a value in the Body Format field and select Create New Variable.
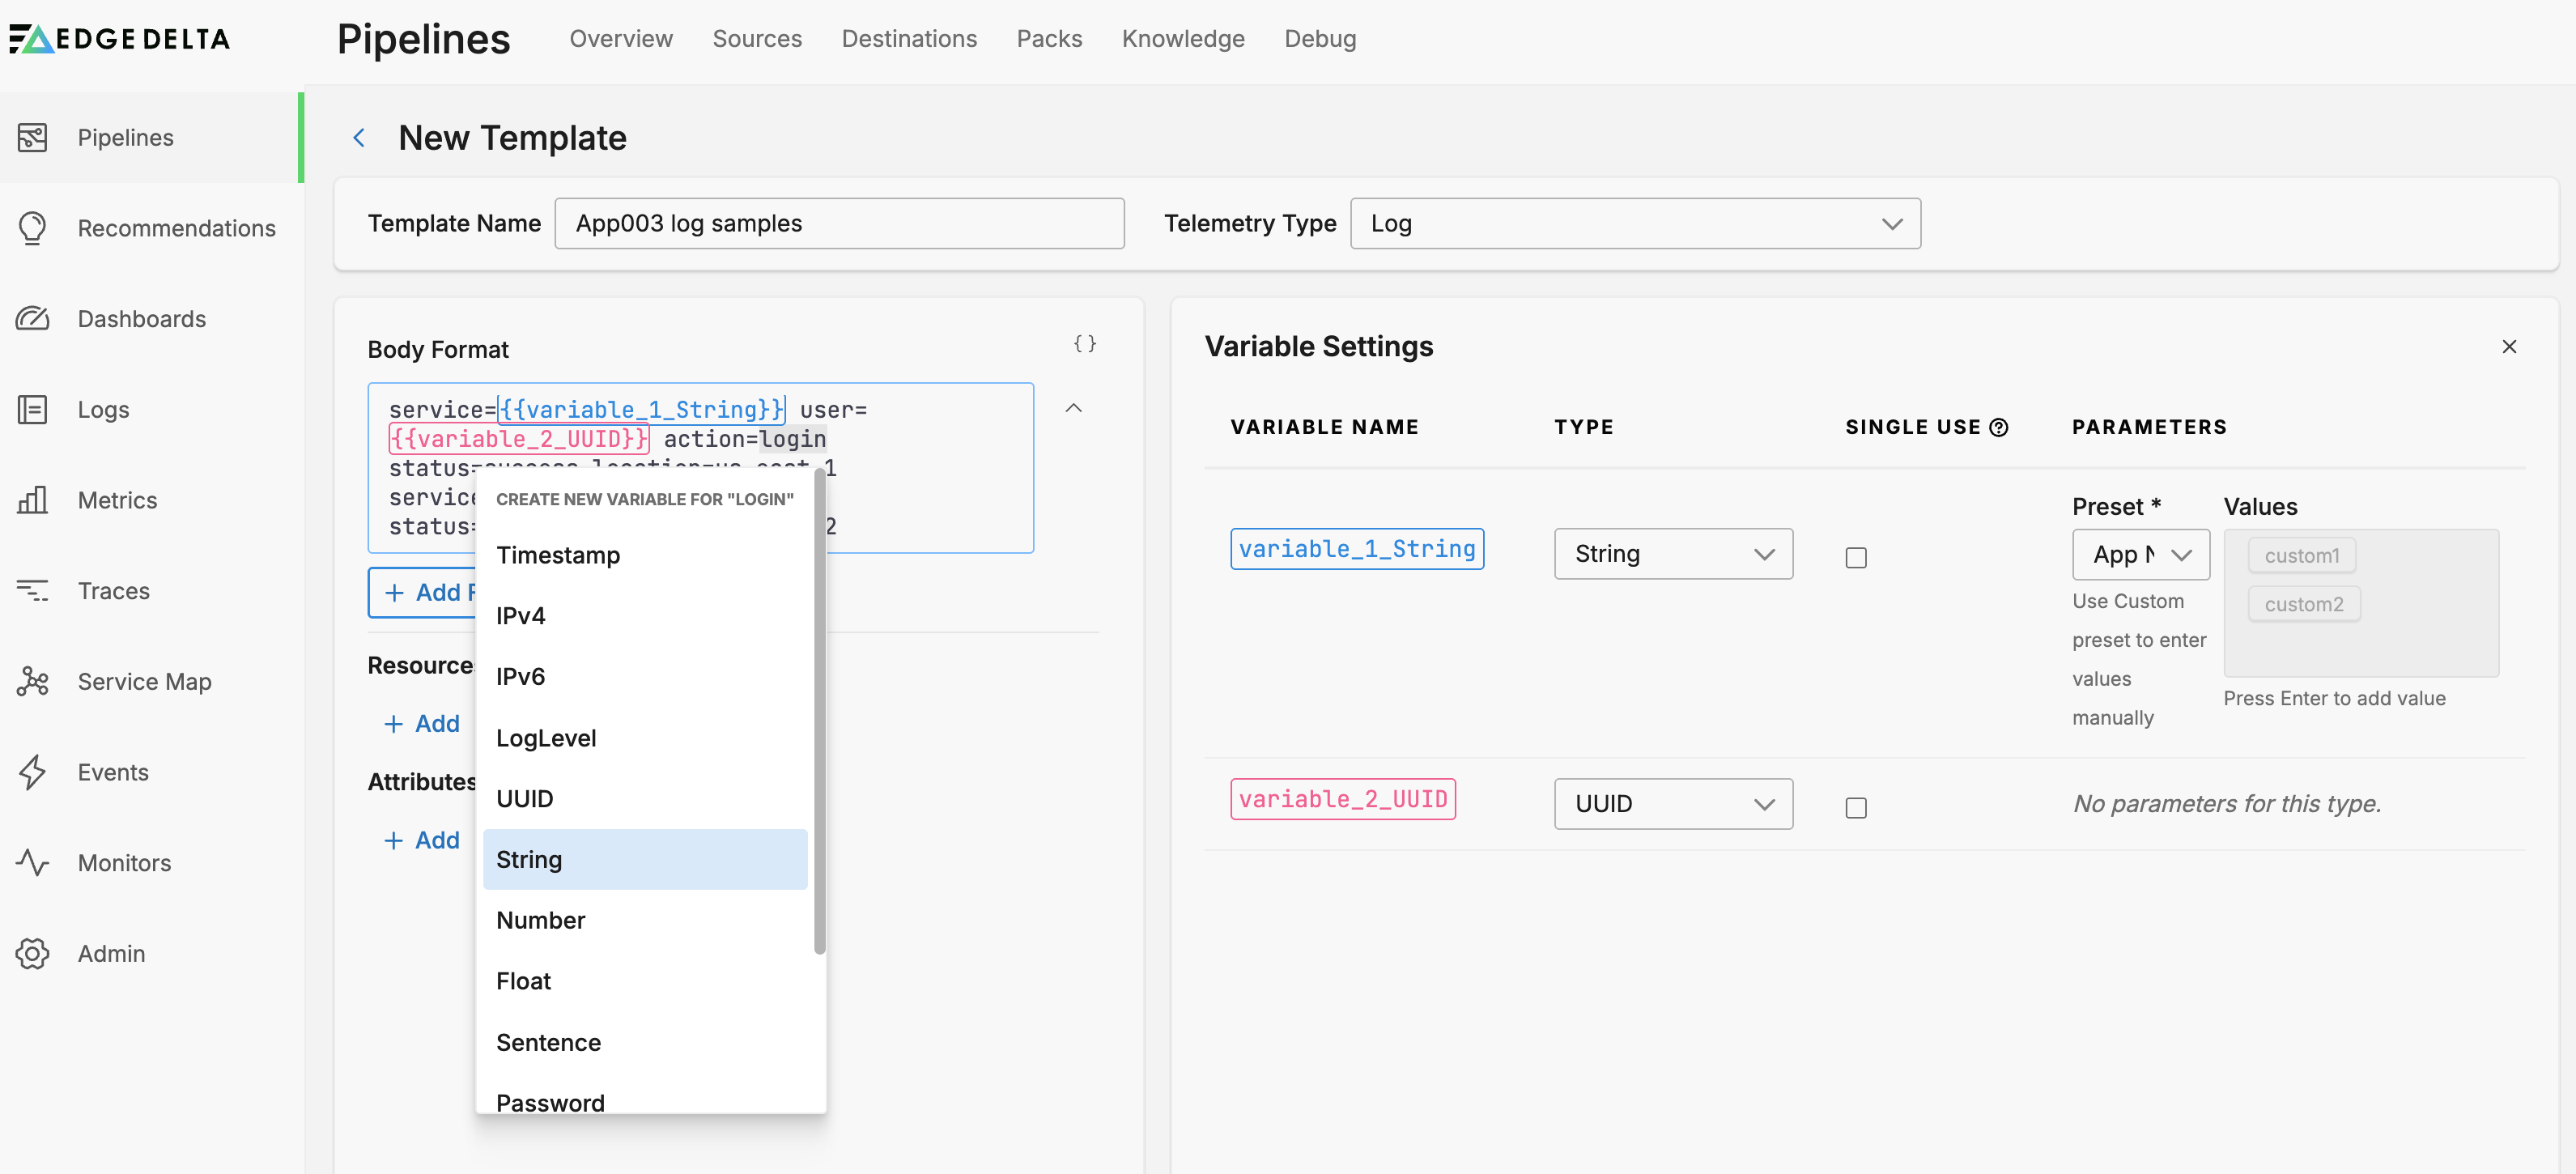
Select a data type, in this example a String.
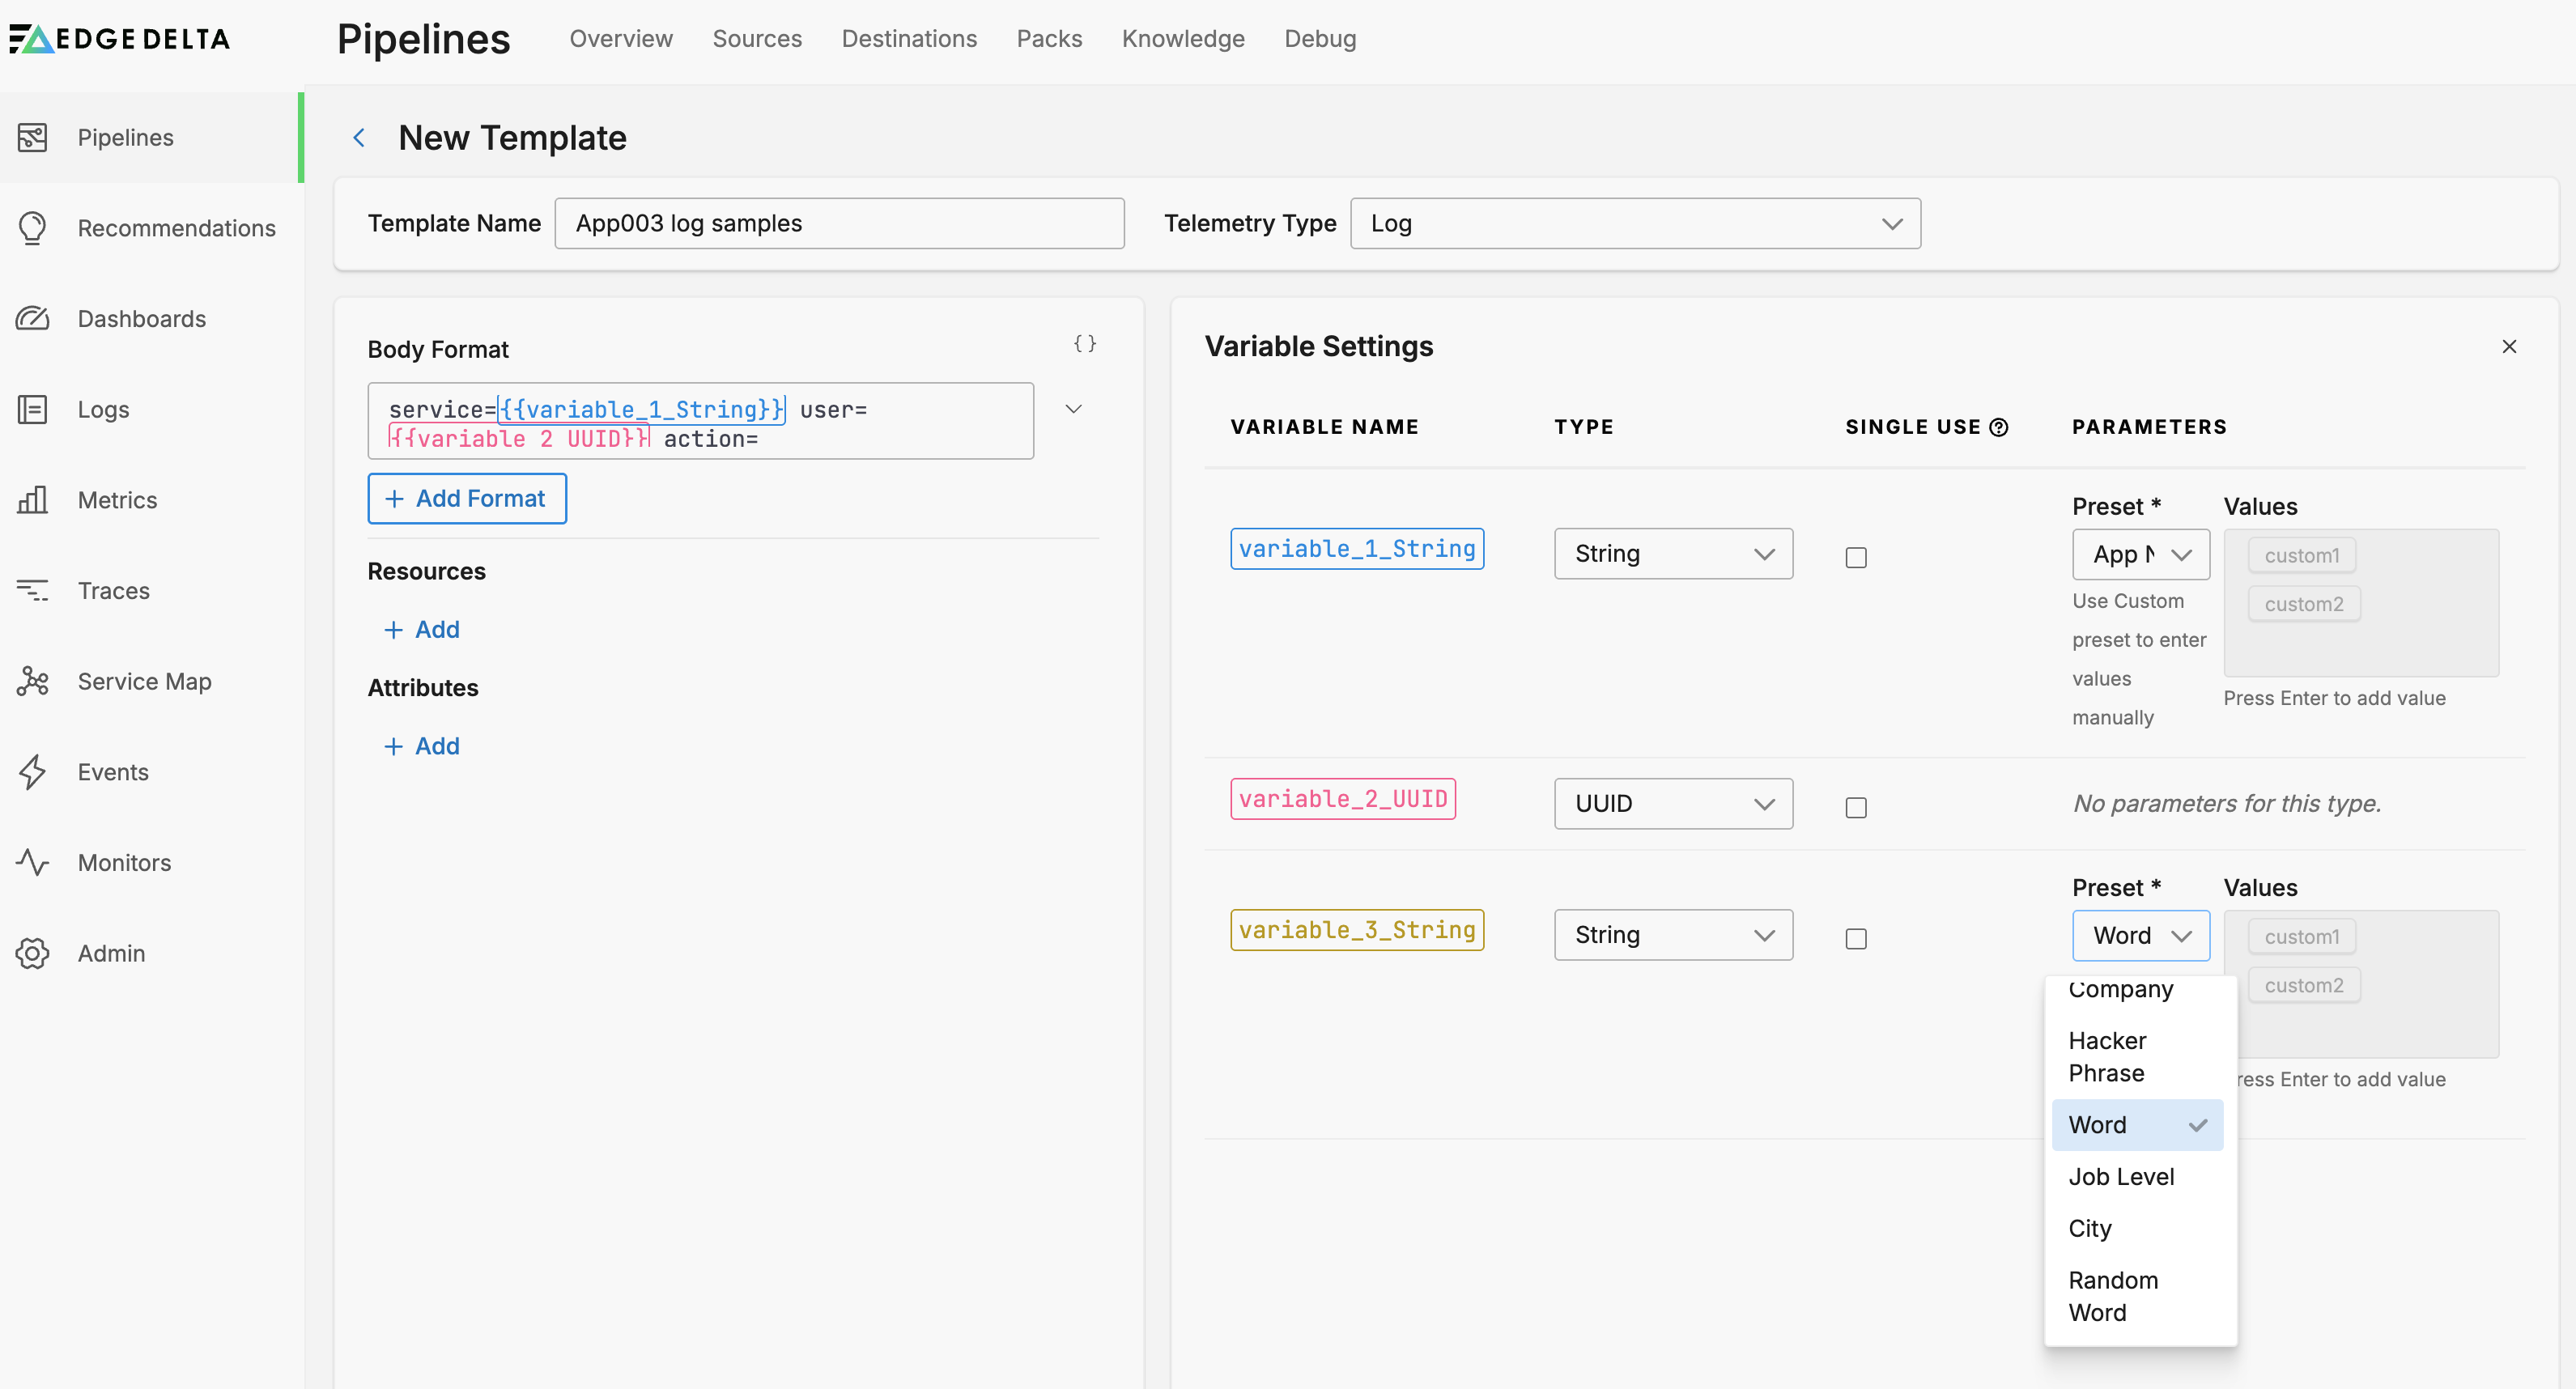
You can further specify the variable with preset random field types such as a city name or fictitious company name.
Alternatively, you select the Custom preset and set your own list of potential values. This is useful if you need to test lookup tables that search for specific values.
Working with Multi-line Logs
When creating log templates with multi-line content, you can paste entire log blocks. The system will automatically detect log boundaries based on:
- Newline characters for simple text logs
- JSON object boundaries for structured logs
- Custom regex patterns you define
Exporting and Importing Templates
Templates can be exported for sharing:
- Select the template you want to export
- Click the export option to download the template configuration
- Import the template in another organization or save it to the shared library
Click Save Template.
Know your Requirements
To design effective log and metric pipelines, you must have a comprehensive understanding of the data handling requirements. These include business-driven factors such as cost-efficiency and adherence to legal mandates, data-specific needs such as volume capacity and optimization of data throughput, information security, and maintainability.
Pipeline Conceptual Design
Create a rough or conceptual pipeline containing the processors whose functions fulfil the requirements. Consider the sequence of nodes and opportunities for branching the pipeline in paths. Develop a high level understanding of what your data should look like as it progresses through the pipeline to meet your requirements. For example, the first processor might mask a specific field, while the next might extract a field from the body and convert it into an attribute. A parallel path might be required to also generate metrics or trigger alerts against a threshold. Consider the data destination data format requirements.
Visualize a Telemetry Pipeline
Use diagrams to communicate how telemetry flows through Edge Delta. They help teams discuss architecture changes before touching production configs.
graph TD
  A[[Log + Metric Sources]] --> B[Edge Delta Agent]
  B --> C[Processors]
  C --> D{Routing Rules}
  D -->|Forward| E[Destinations]
  D -->|Reduce| F[(Metrics + Patterns)]
  F --> G[Alerts]
  B --> H[Anomaly Detection]
Test with your Templates and Live Capture
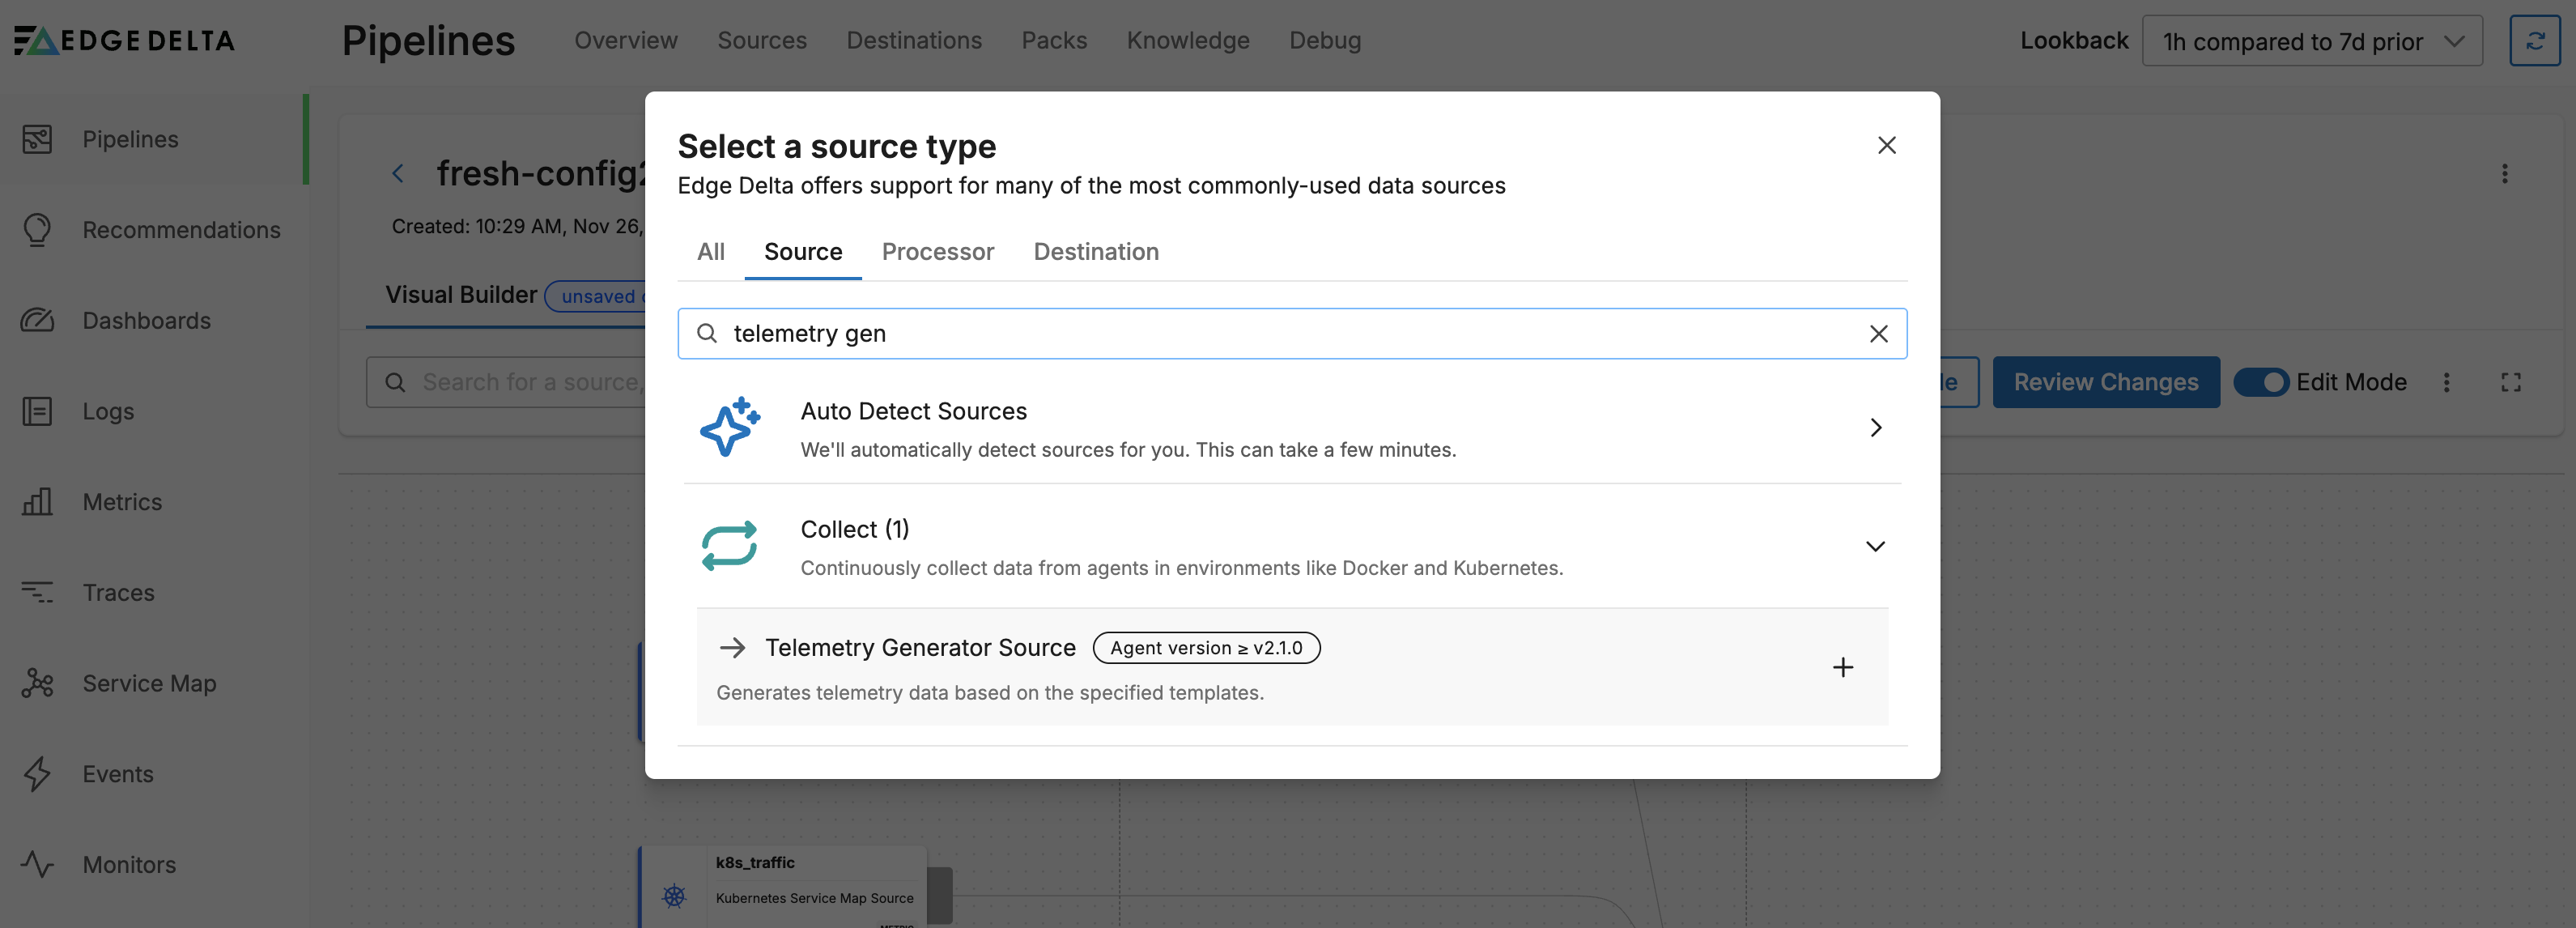
With a good understanding of your desired outcomes, you can use the Telemetry Generator Source node to generate traffic using the template you created earlier. To start, add a Telemetry Generator Source node to a pipeline.
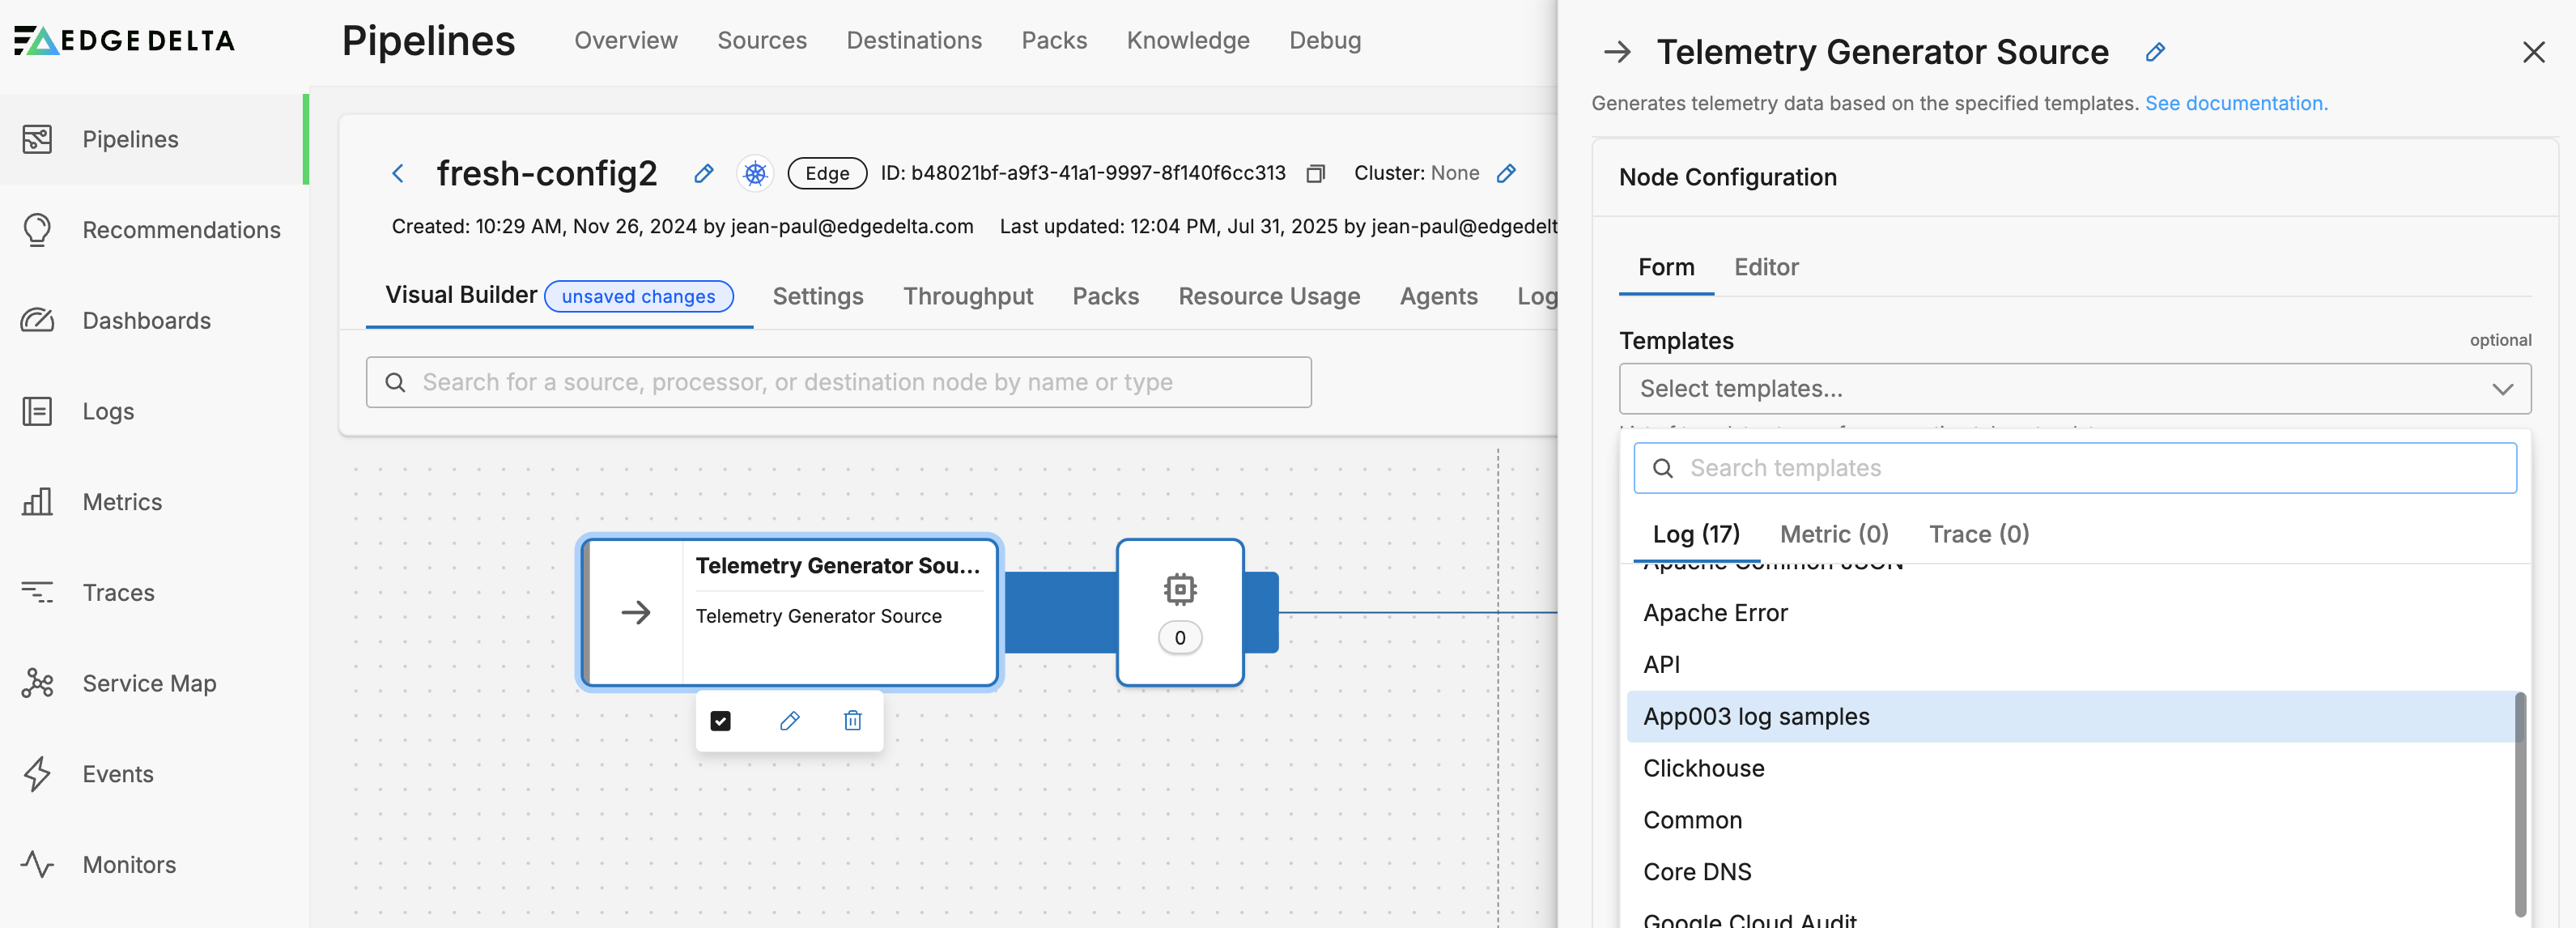
Next, select your template and click Save:
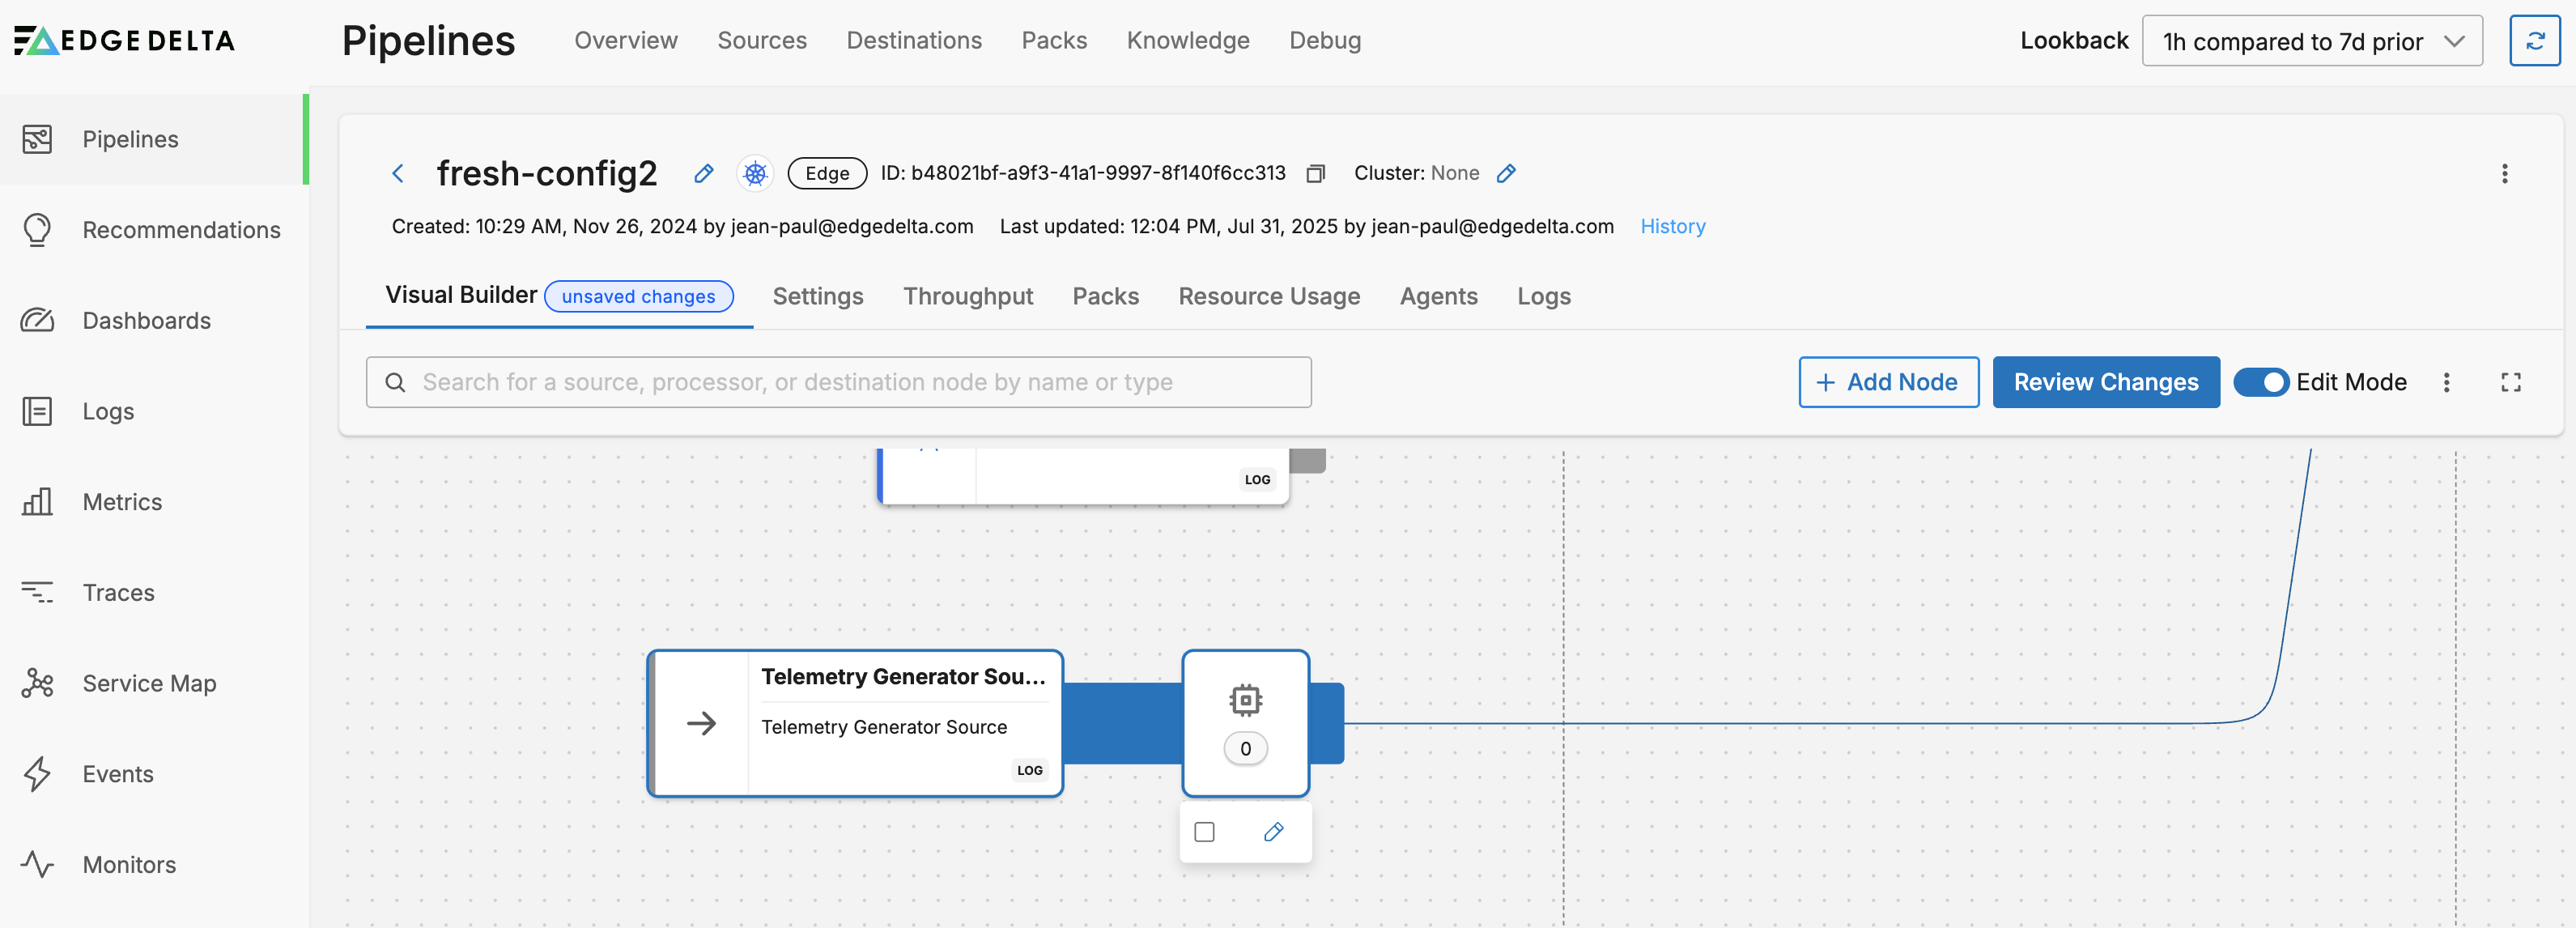
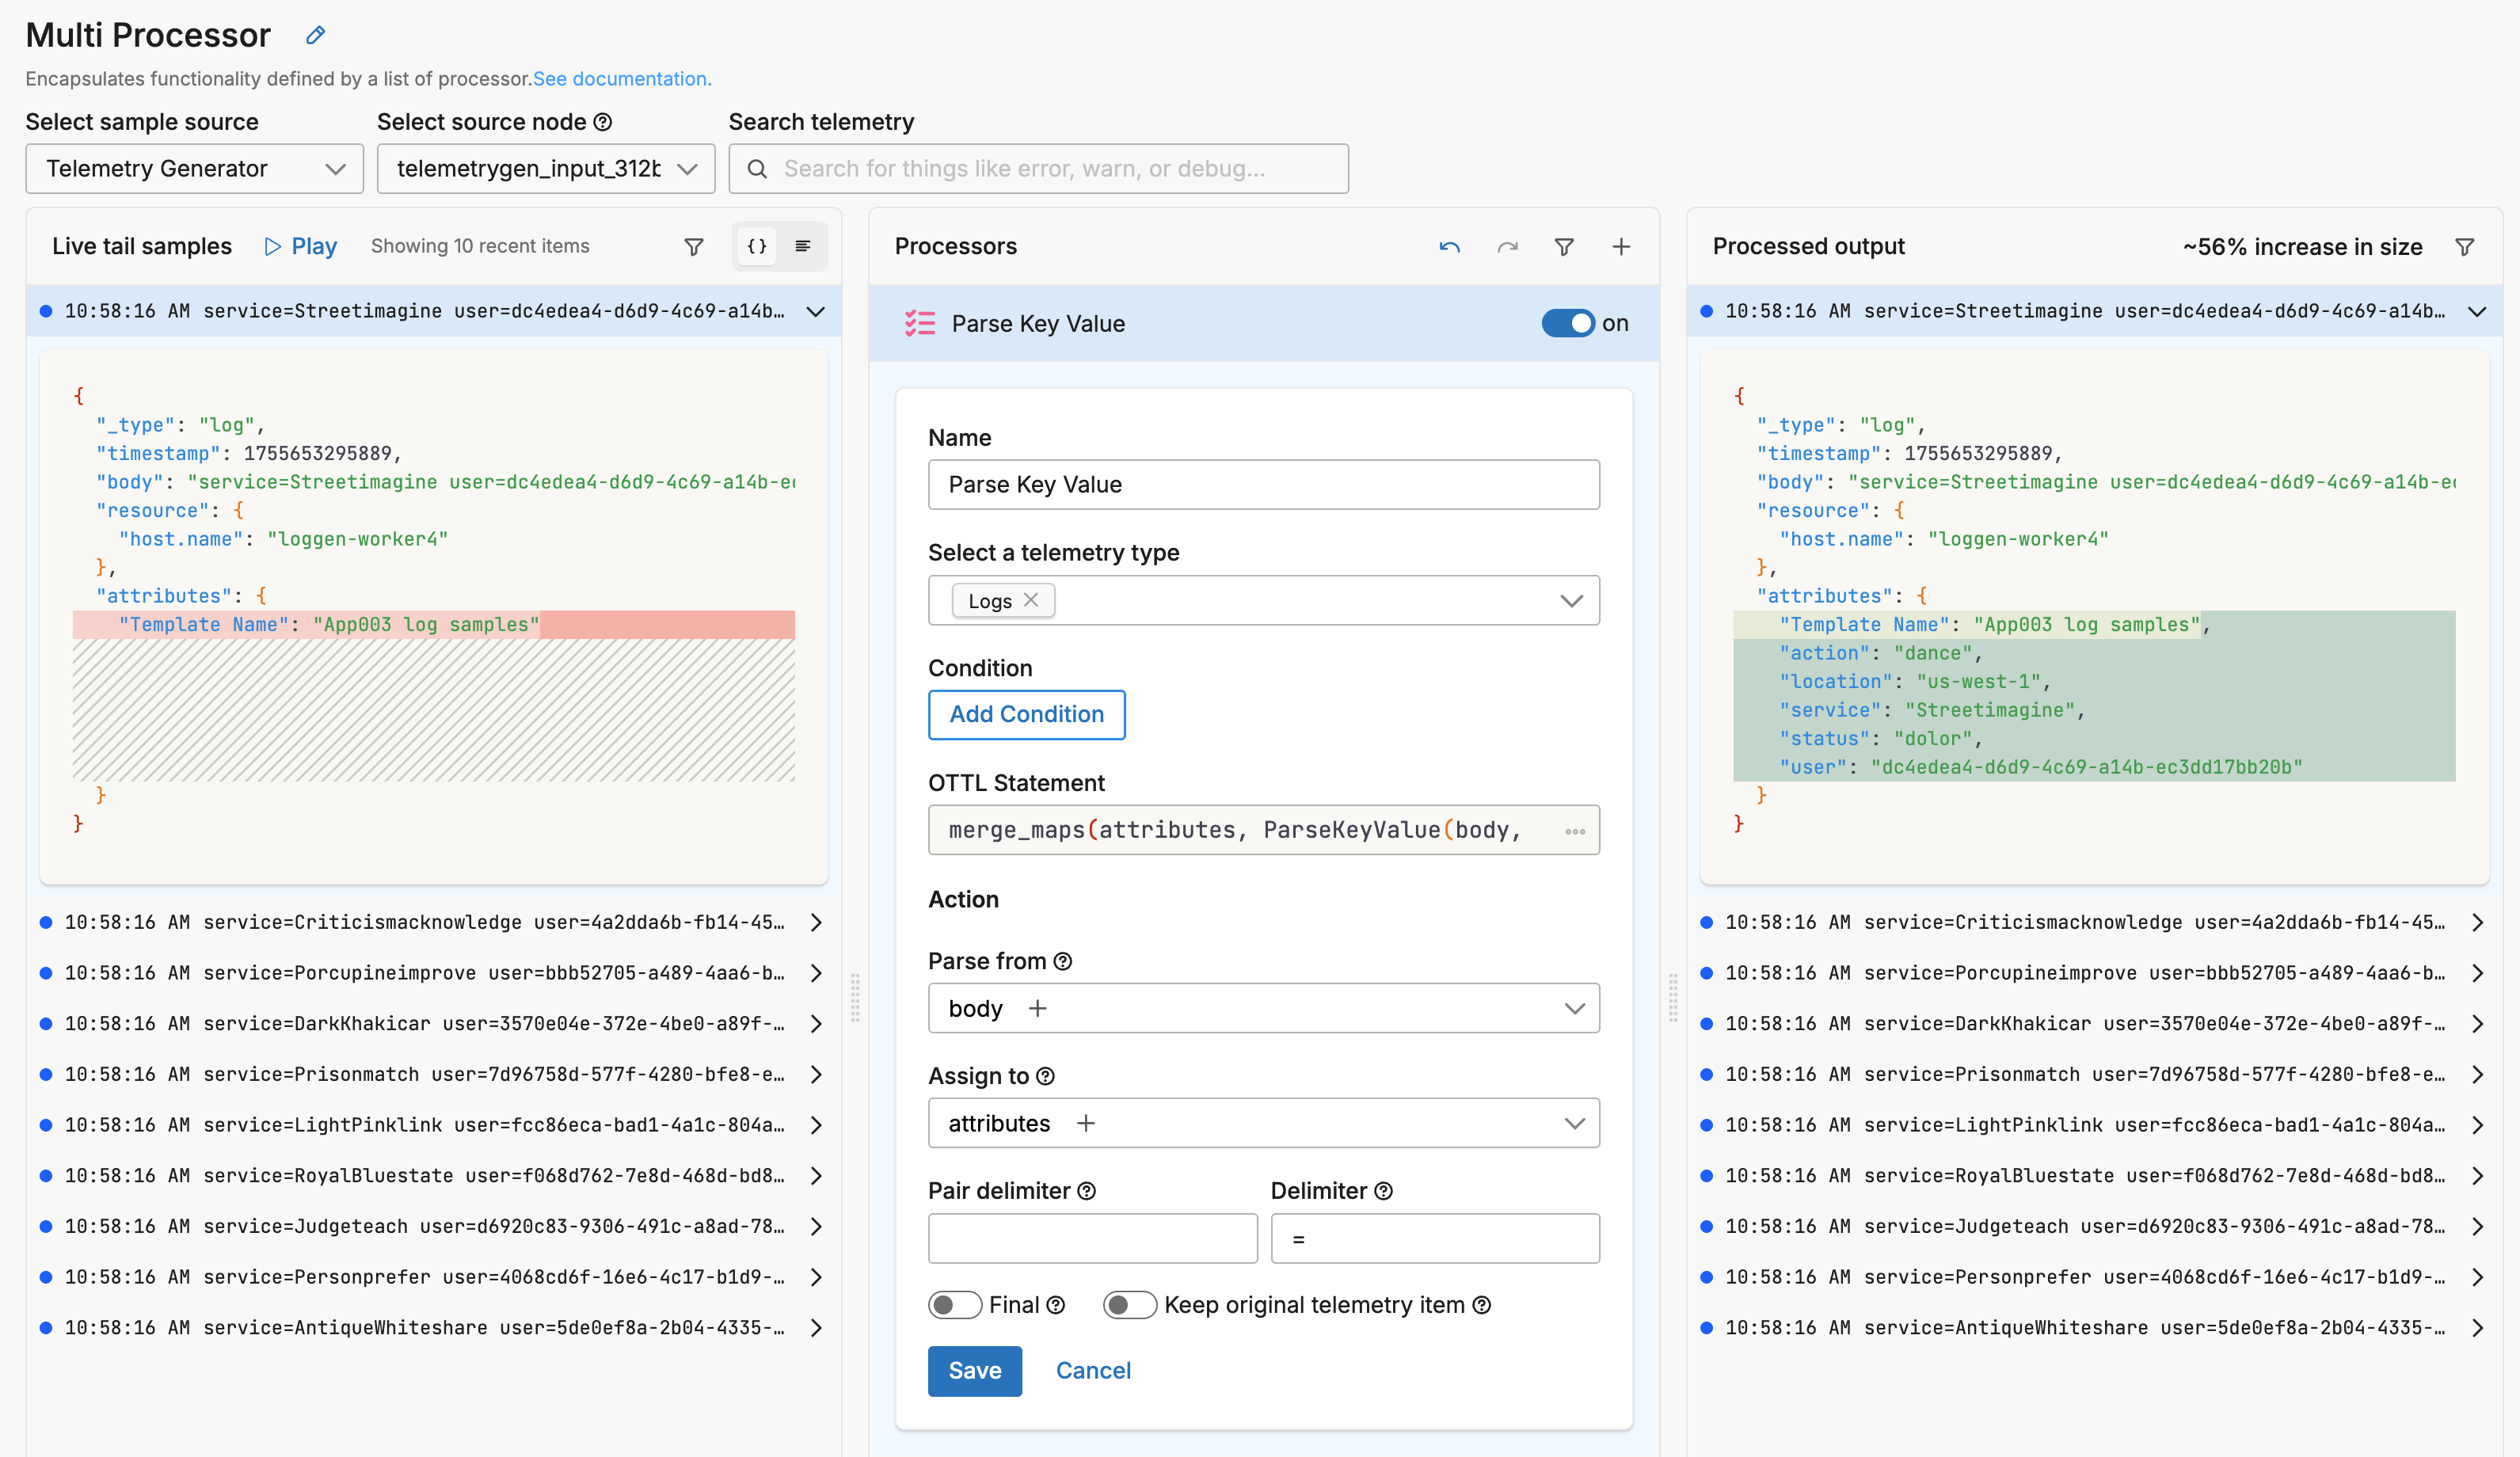
Now you can start crafting processors. To start, open a multi-processor attached to the Telemetry Generator Source node.
Data that follows your template schema flows through the pipeline and is visible in Live Capture.
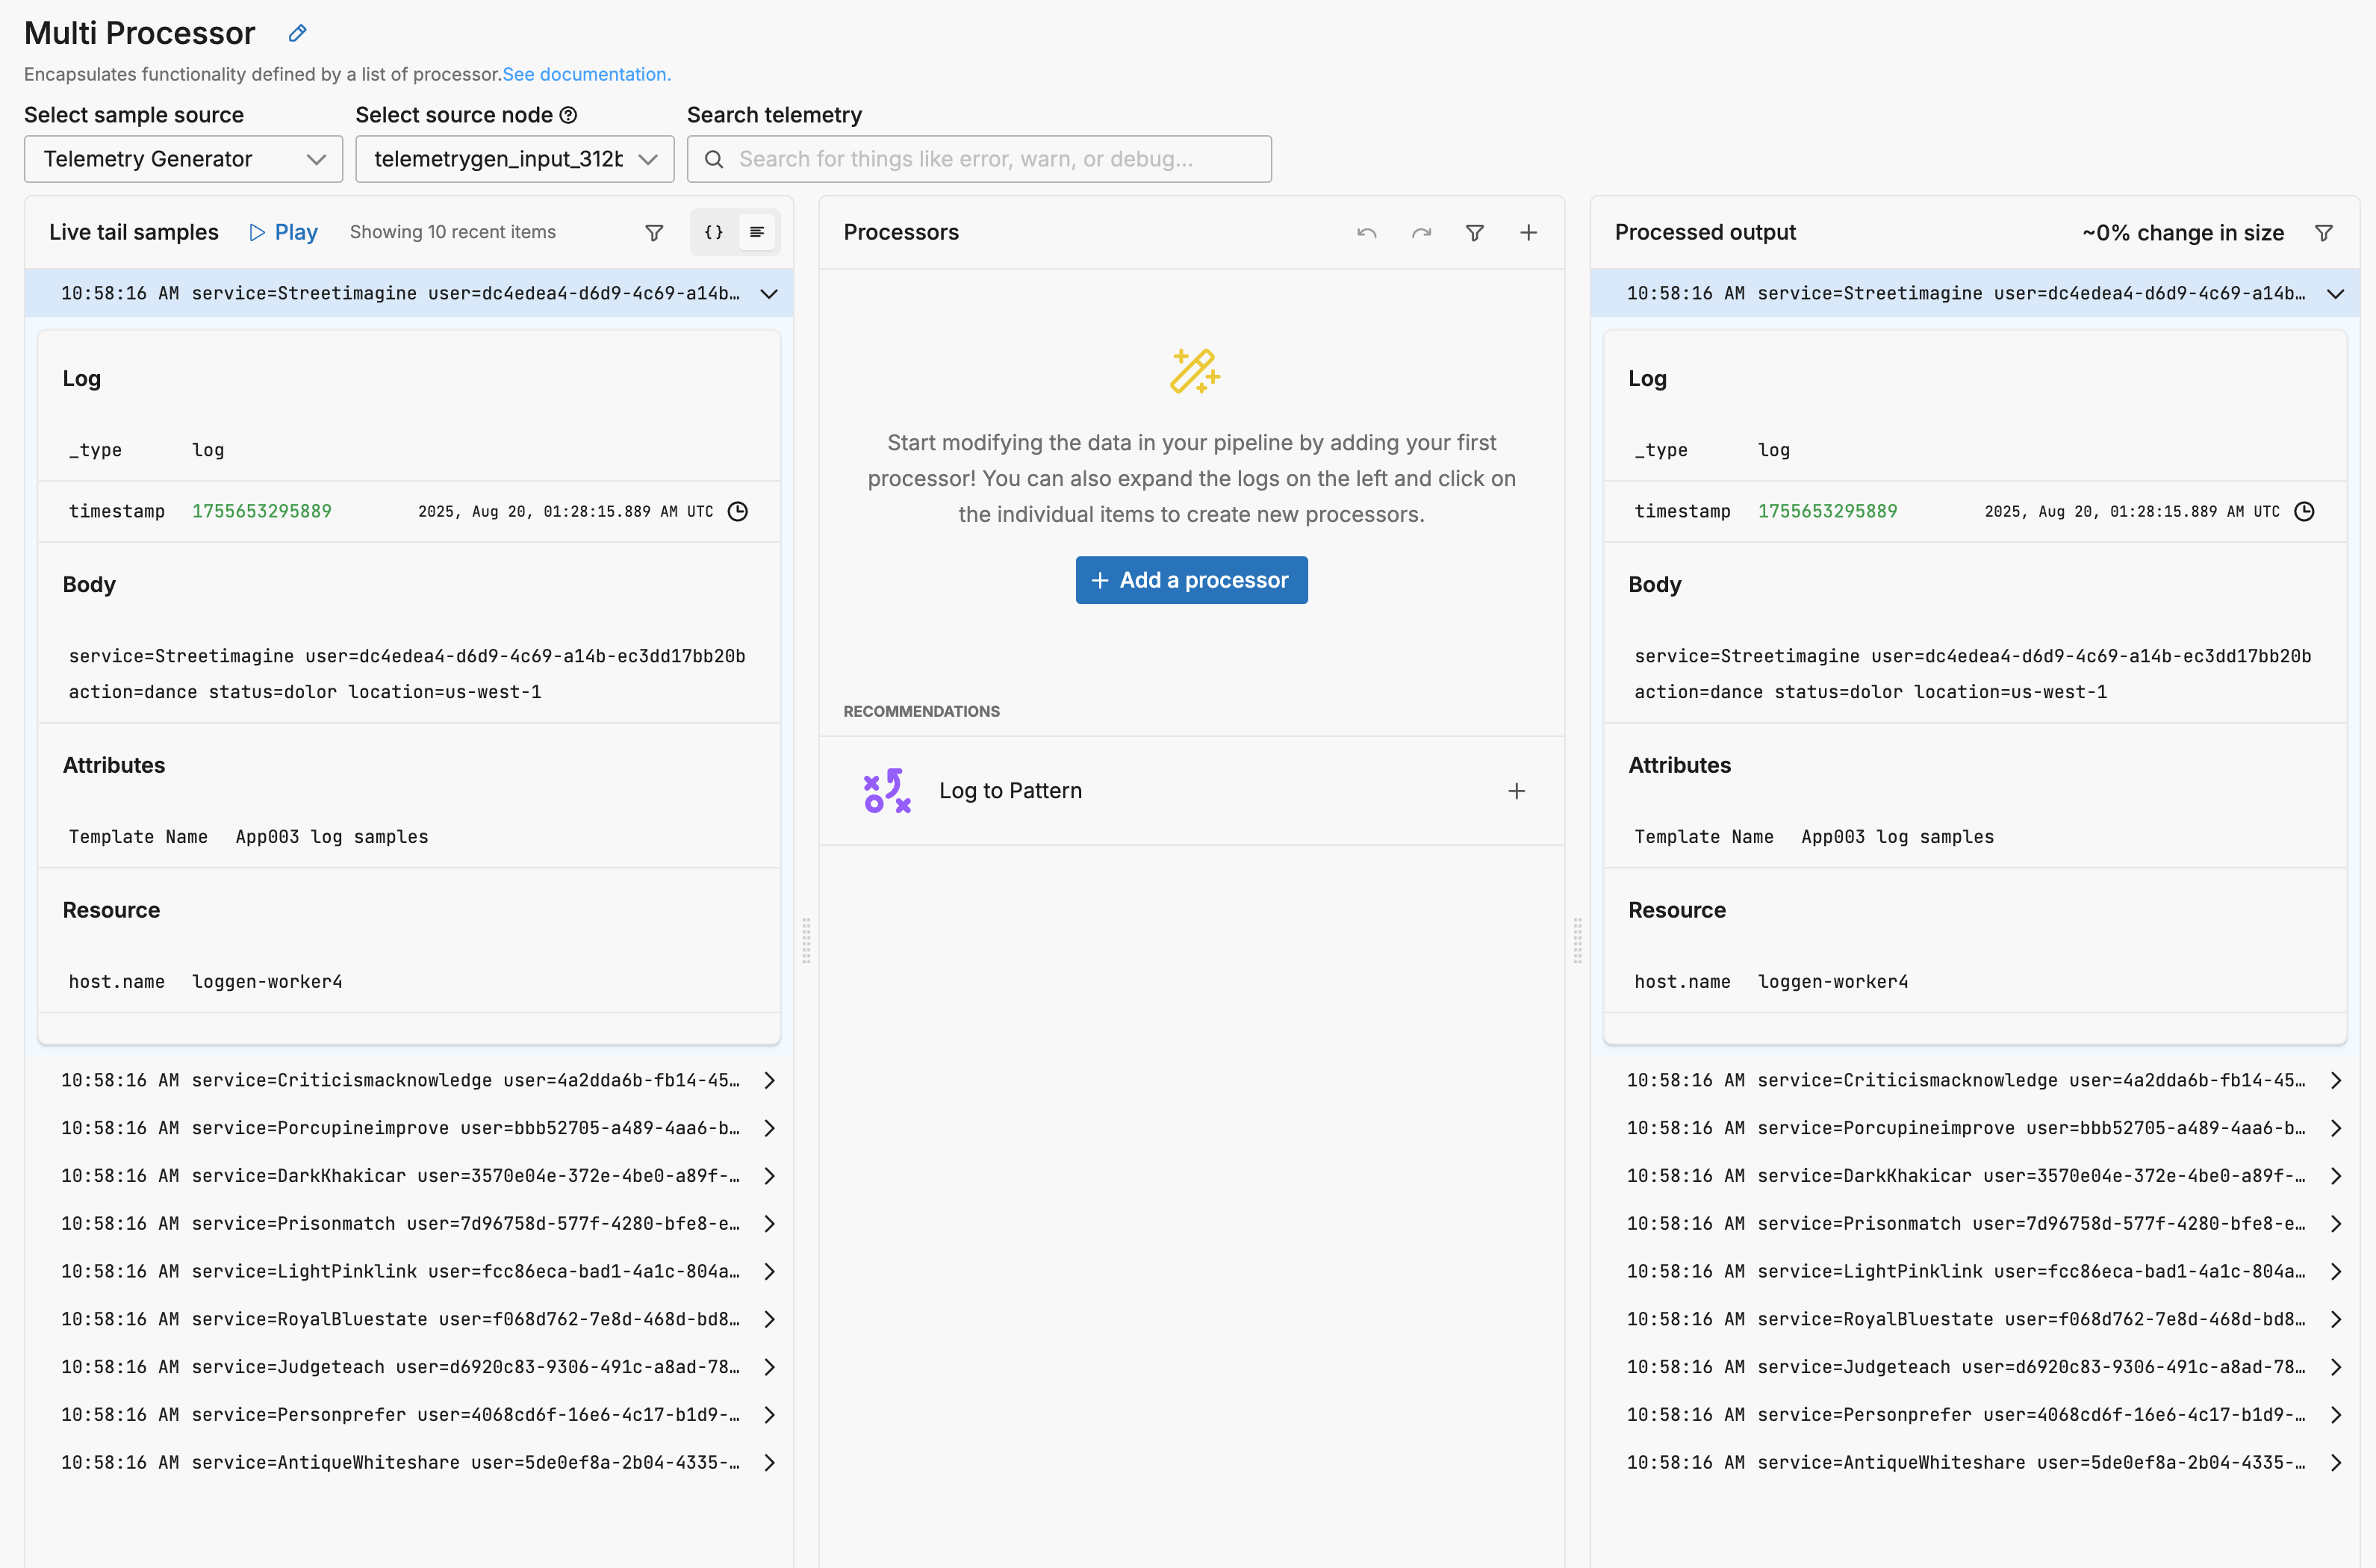
You configure a processor to handle your data according to your requirements. In this instance, a Parse Key Value processor is configured to extract key value pairs in the body and parse them into attributes.
With a solid understanding of your configuration you can deploy the pipeline to work on your actual data either by
- rebuilding the configuration in your actual pipeline,
- saving the test configuration as a pack and deploying it,
- saving the test pipeline processor YAML and copying it to your actual pipeline, or
- adding your actual data source and destination nodes to the test pipeline and deploying the agents in your compute environment.
Leverage AI-Powered Recommendations
Edge Delta’s Recommendations feature provides AI-powered insights to optimize your pipelines. The system analyzes your log patterns and suggests relevant processors like filtering, sampling, or masking to help reduce costs and improve data quality. Access recommendations while designing pipelines in the multiprocessor view or from the dedicated Recommendations page to get contextual suggestions based on your actual data patterns.