Telemetry Pipelines
This page details the management and optimization of telemetry pipelines, including cost savings and data volume metrics.
4 minute read
A pipeline is the configuration and representation of a set of agents. You use the Pipelines page to manage your pipeline fleet.
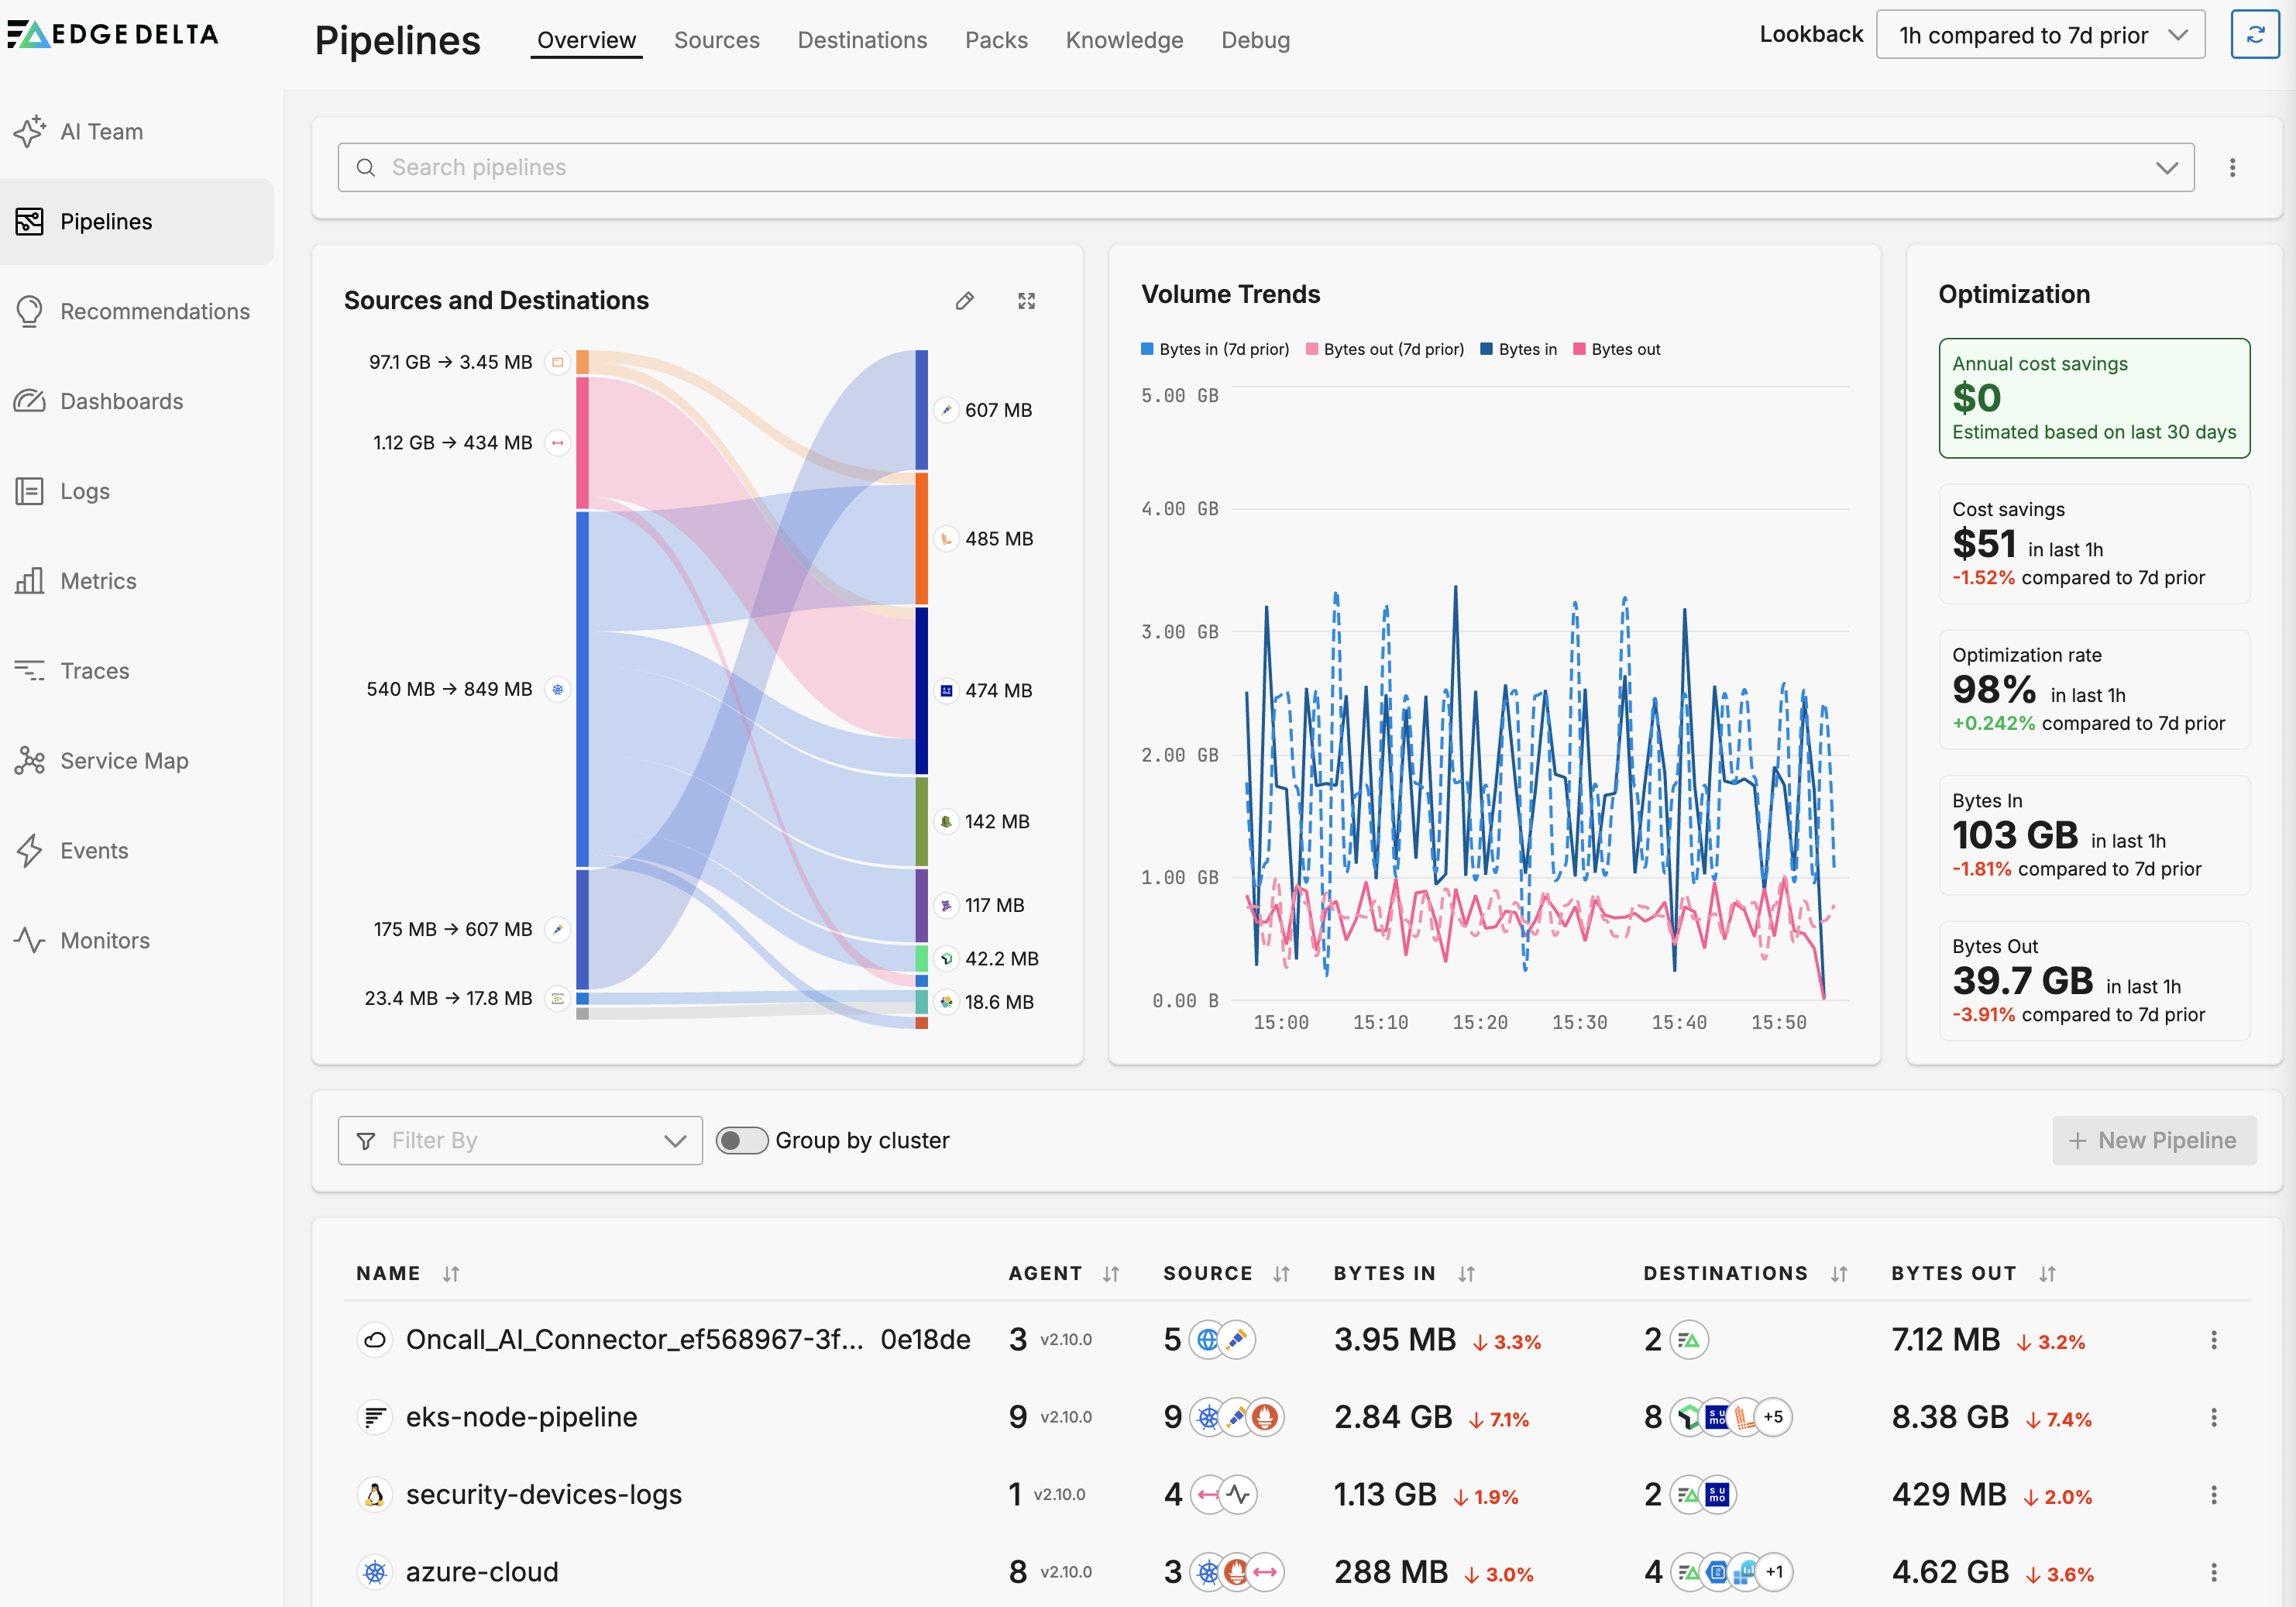
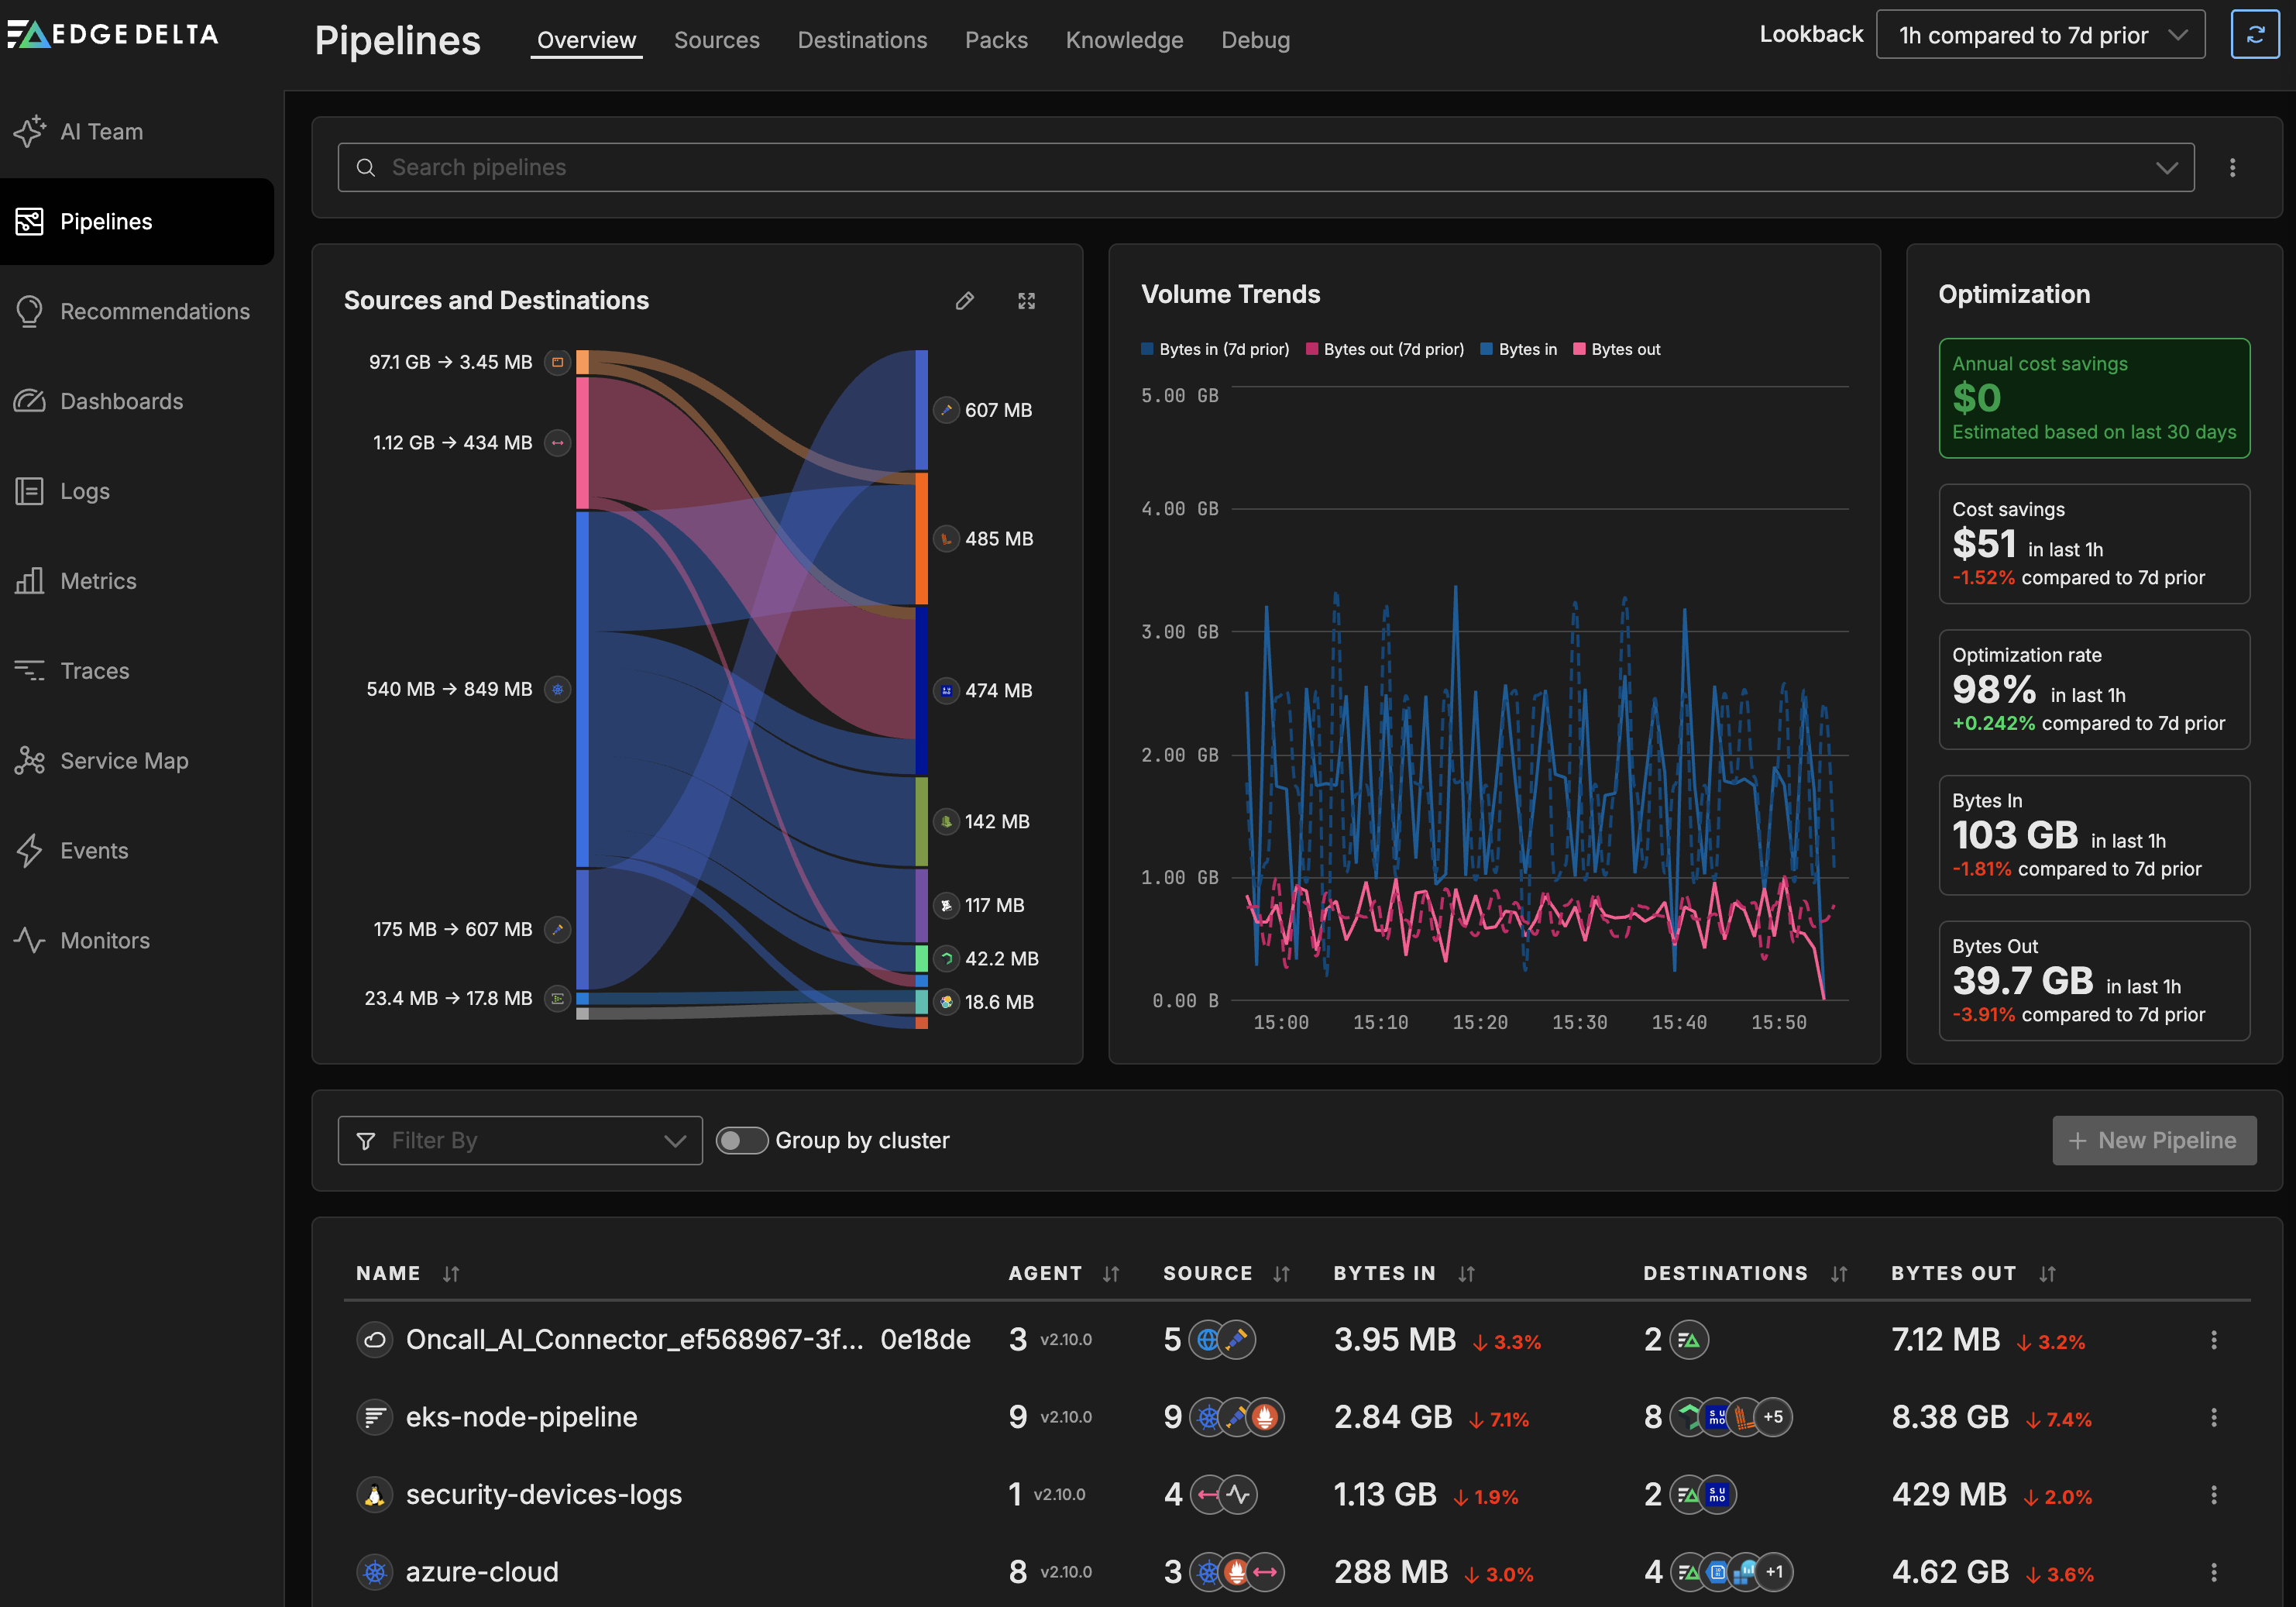
Click Pipelines and the Overview tab opens. This tab provides a quick overview of the health of all your pipelines and the aggregated performance of the organization.
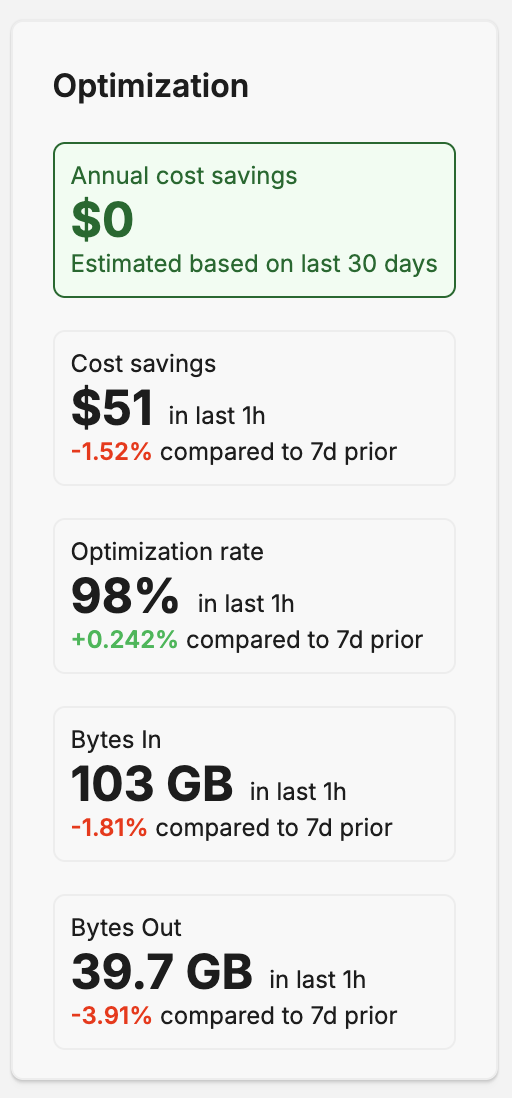
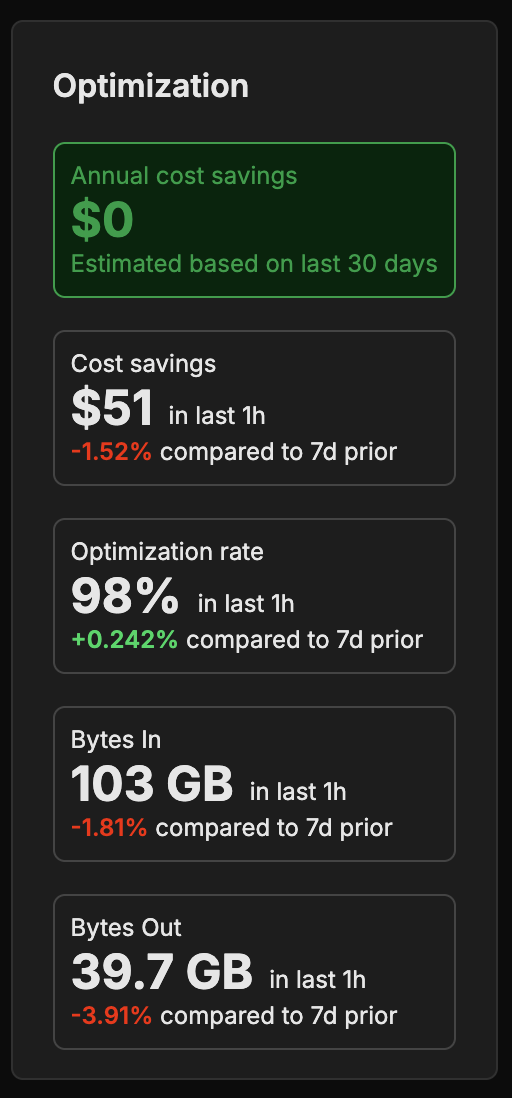
Telemetry optimization
The Telemetry optimization pane shows shows data volumes per source type and volume of data streamed to streaming destinations.
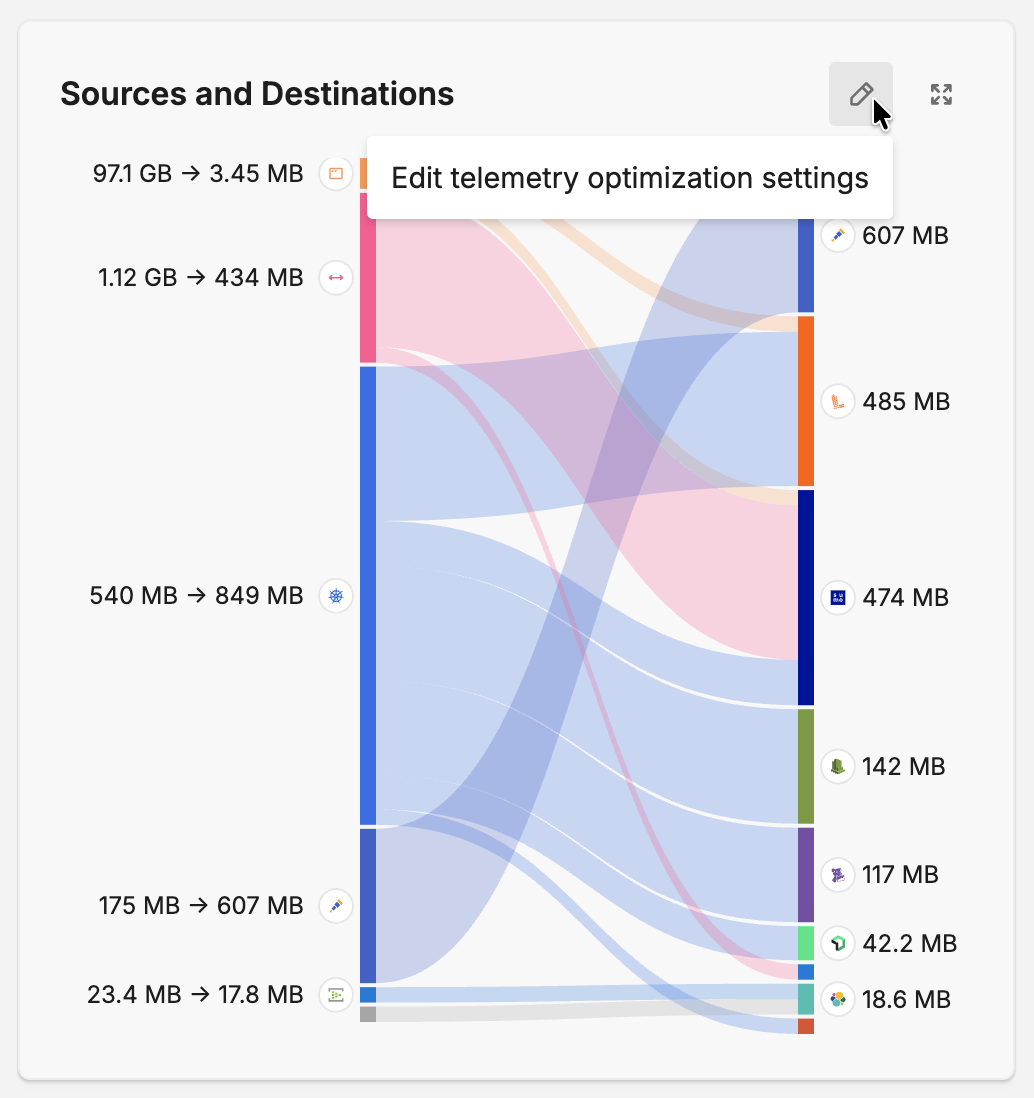
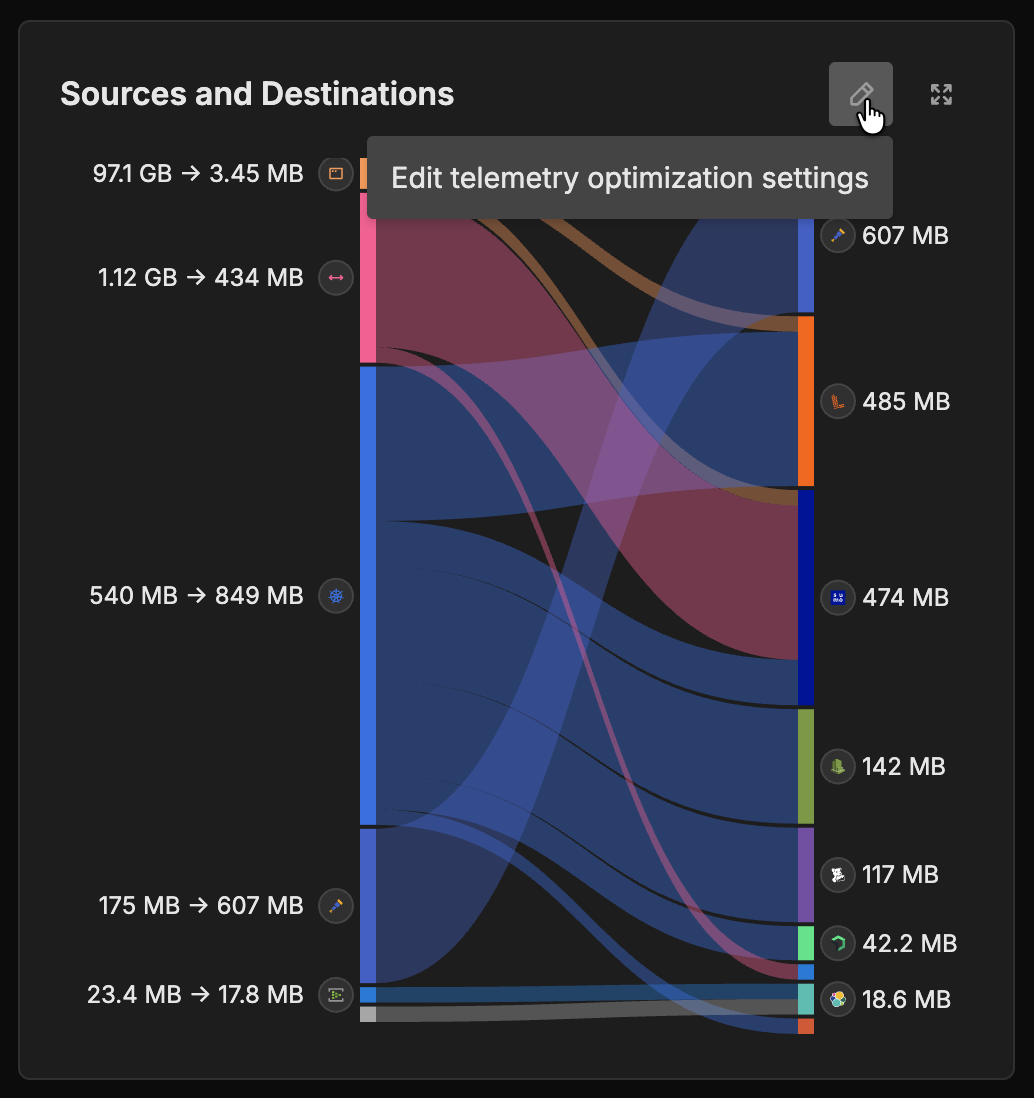
To enable accurate monetary values on this dashboard, click the edit icon in the Sources and Destinations pane, and click Edit telemetry optimization settings. Enter your actual destination pricing per GB/TB or number of events. Refer to your contracts with these service providers to get accurate data.
Optimization Calculations
Optimization Rate
The Total Optimization Rate shows the overall efficiency by calculating the percentage of total source input that was not sent to any destination across all pipelines.
It is calculated as follows:
Source Optimization and Destination Optimization
Each source has a source optimization rate. It measures the percentage of the source input not forwarded to outputs. Similarly, each destination has a rate that measures the percentage of the total possible input that was not delivered.
These two values determine the pipeline optimization rate as follows:
Single Source to a Single Destination
In the simplest case, where there is a single source and a single destination, the pipeline, source and destination optimization rates all reflect the same data reduction.
Multiple Sources to a Single Destination
When multiple sources send data to a single destination, each source will have its own optimization rate. The pipeline optimization in this case equals the destination optimization.
Single Source to Multiple Destinations
If there is one source sending data to multiple destinations, each destination will now have its own optimization rate. The pipeline optimization is equal to the source’s optimization rate
Multiple Sources to Multiple Destinations
Where multiple sources send data to multiple destinations, source optimization and destination optimization is first calculated separately for each source and destination. The pipeline optimization then reflects the cumulative data reduction across all sources and all destination outputs.
Changes in Volume
Changes in data volume from a source directly affect source optimization rates. If a source’s data volume increases, its optimization rate typically decreases, since a greater share of that data is sent to destinations rather than filtered out. In some cases, this may result in a negative rate, and is calculated as such though this is shown as zero in the interface.
Conversely, when a source’s volume decreases, the source optimization rate improves.
These changes also influence pipeline optimization. Since the pipeline rate is calculated across all sources and destinations, a spike in data from one under-optimized source can reduce the overall pipeline efficiency, even if other sources are well-optimized. Reducing volume from a high-impact source can boost the pipeline rate significantly.
Cost Savings
The Total Cost Savings metric quantifies how much money is saved by reducing the amount of telemetry data sent to costly destinations.
It’s calculated either by summing the avoided costs per source, based on the volume of data not sent and each destination’s unit cost, or by computing the avoided cost per destination. Both approaches yield the same total, reflecting overall cost efficiency.
This layered view, by source, by destination, and across the pipeline, enables a detailed understanding of where cost efficiencies are occurring and helps inform decisions about further optimization.
Annual Cost Savings
The Annual Cost Savings metric estimates yearly savings by taking the cost optimization from the past 30 days, chosen to reduce short-term fluctuations, and multiplying it by 12 to project consistent, annualized savings.
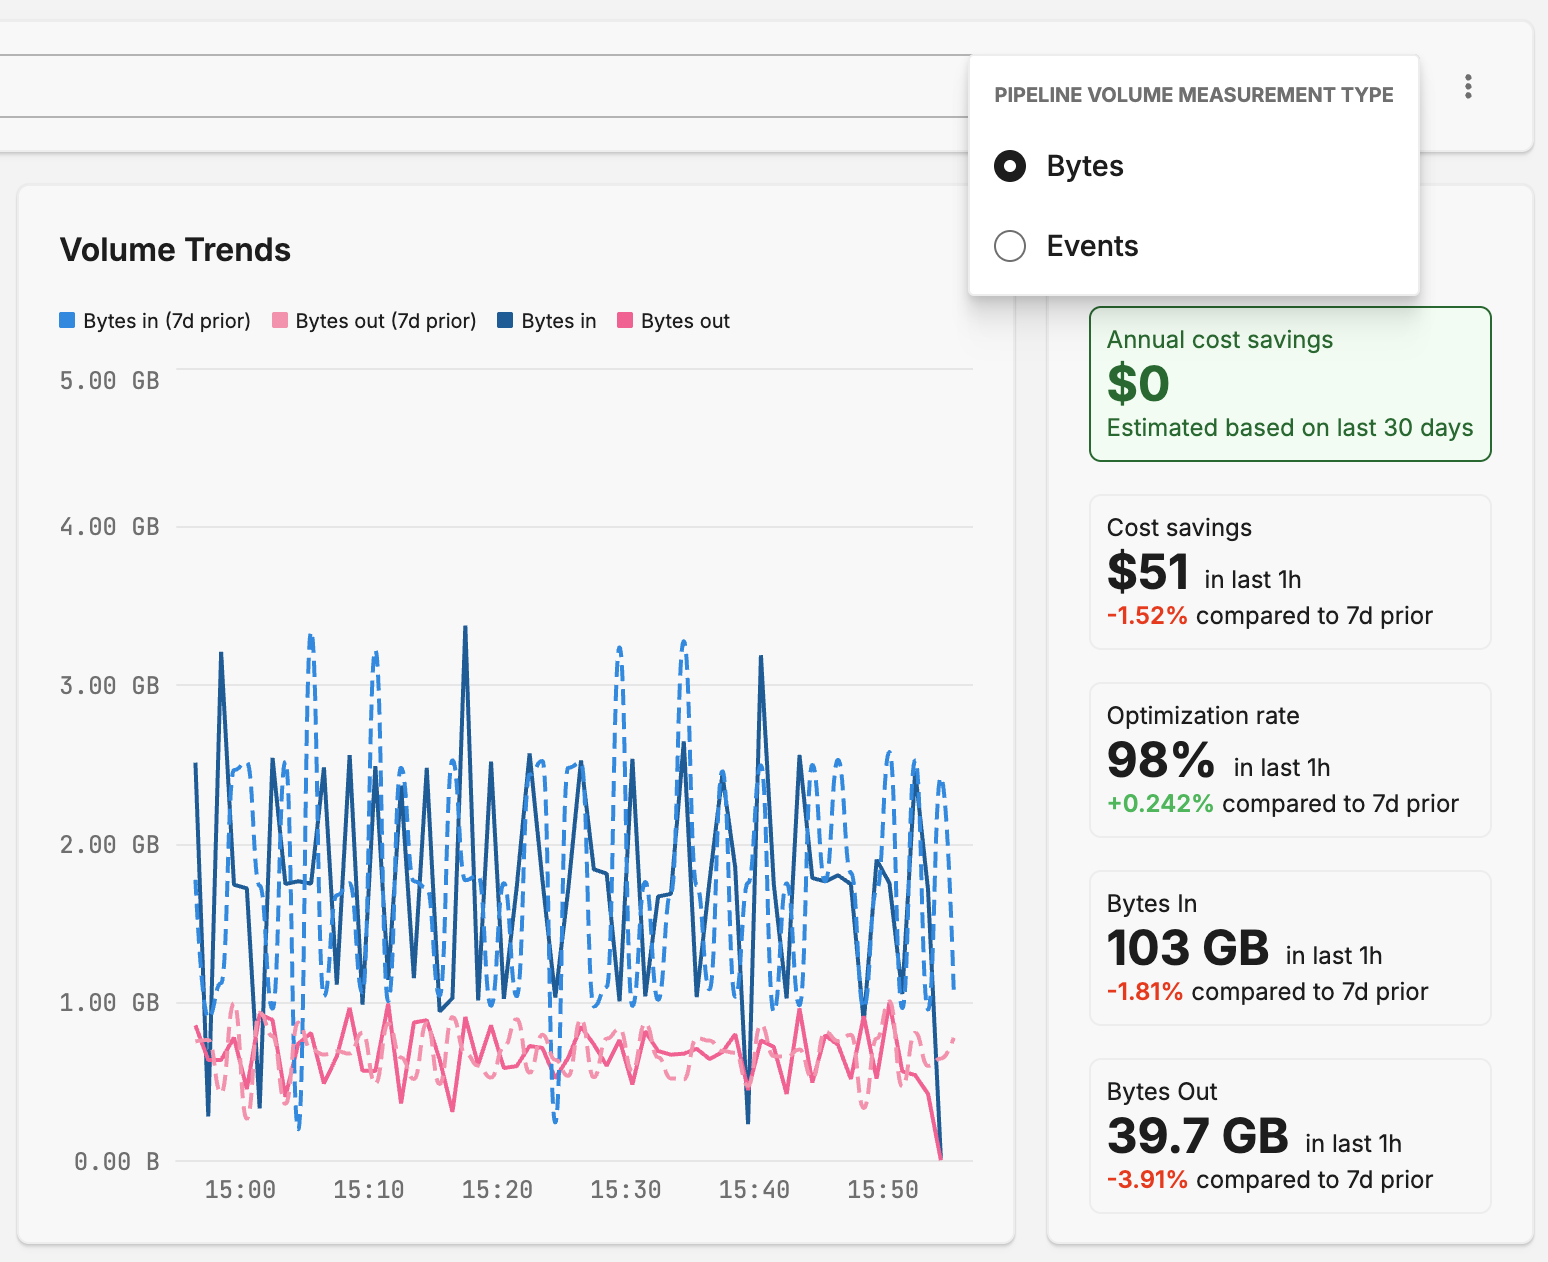
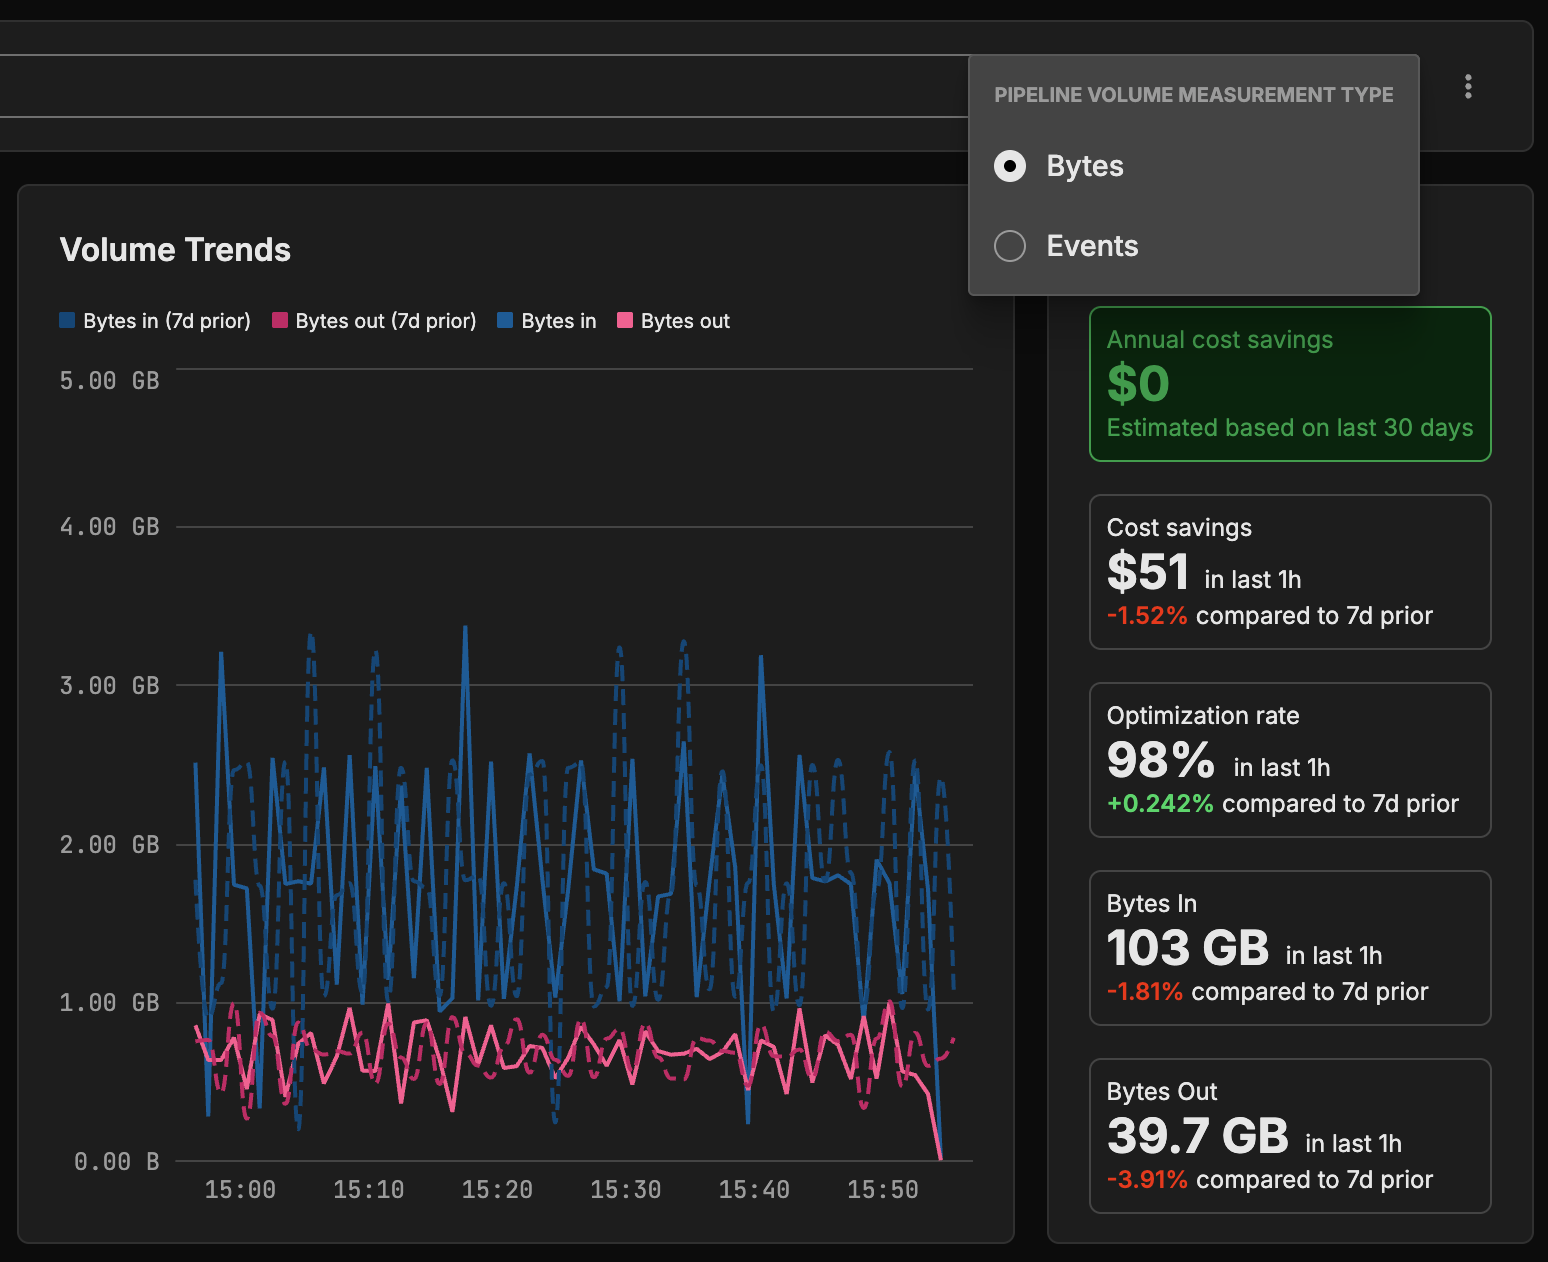
Pipeline Volume
In the Pipeline volume pane, the Bytes In and Bytes Out show the volume of data processed and streamed from your sources to your destinations. You can switch between viewing metrics for data volume or events in the Pipeline volume page.
Pipelines Table
The Overview tab on the Pipelines page also contains the pipelines table. Its lists pipelines and provides statistics including incoming events and bytes, and outgoing events and bytes. Any pipelines with old versions are indicated.
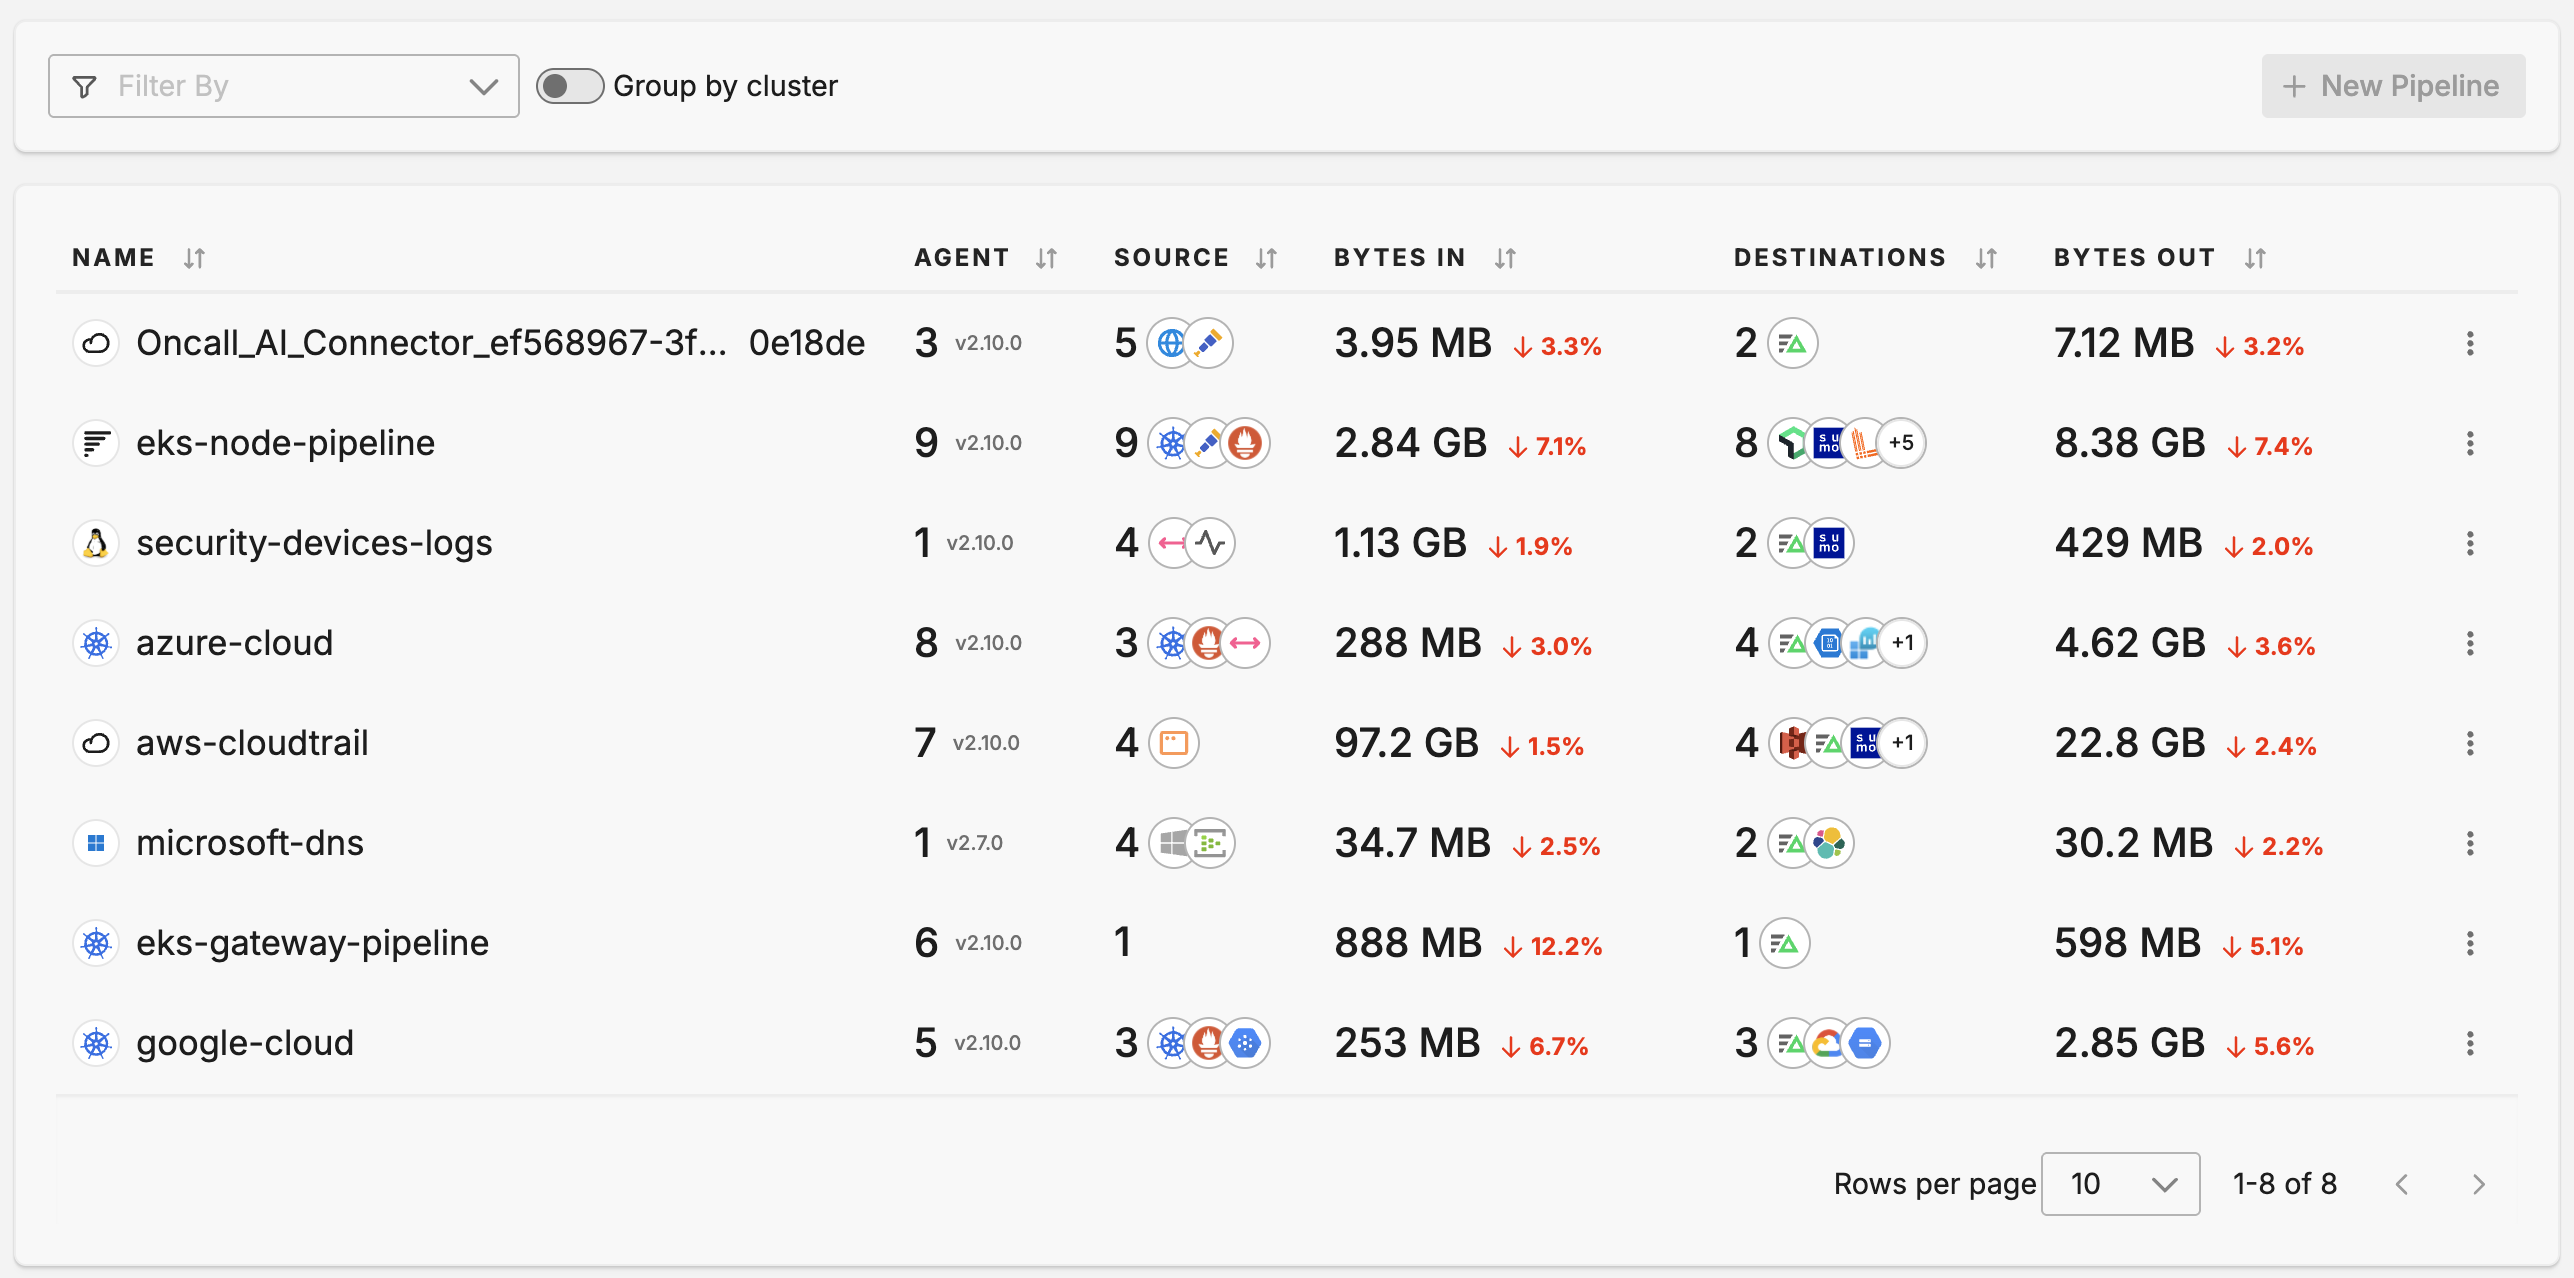
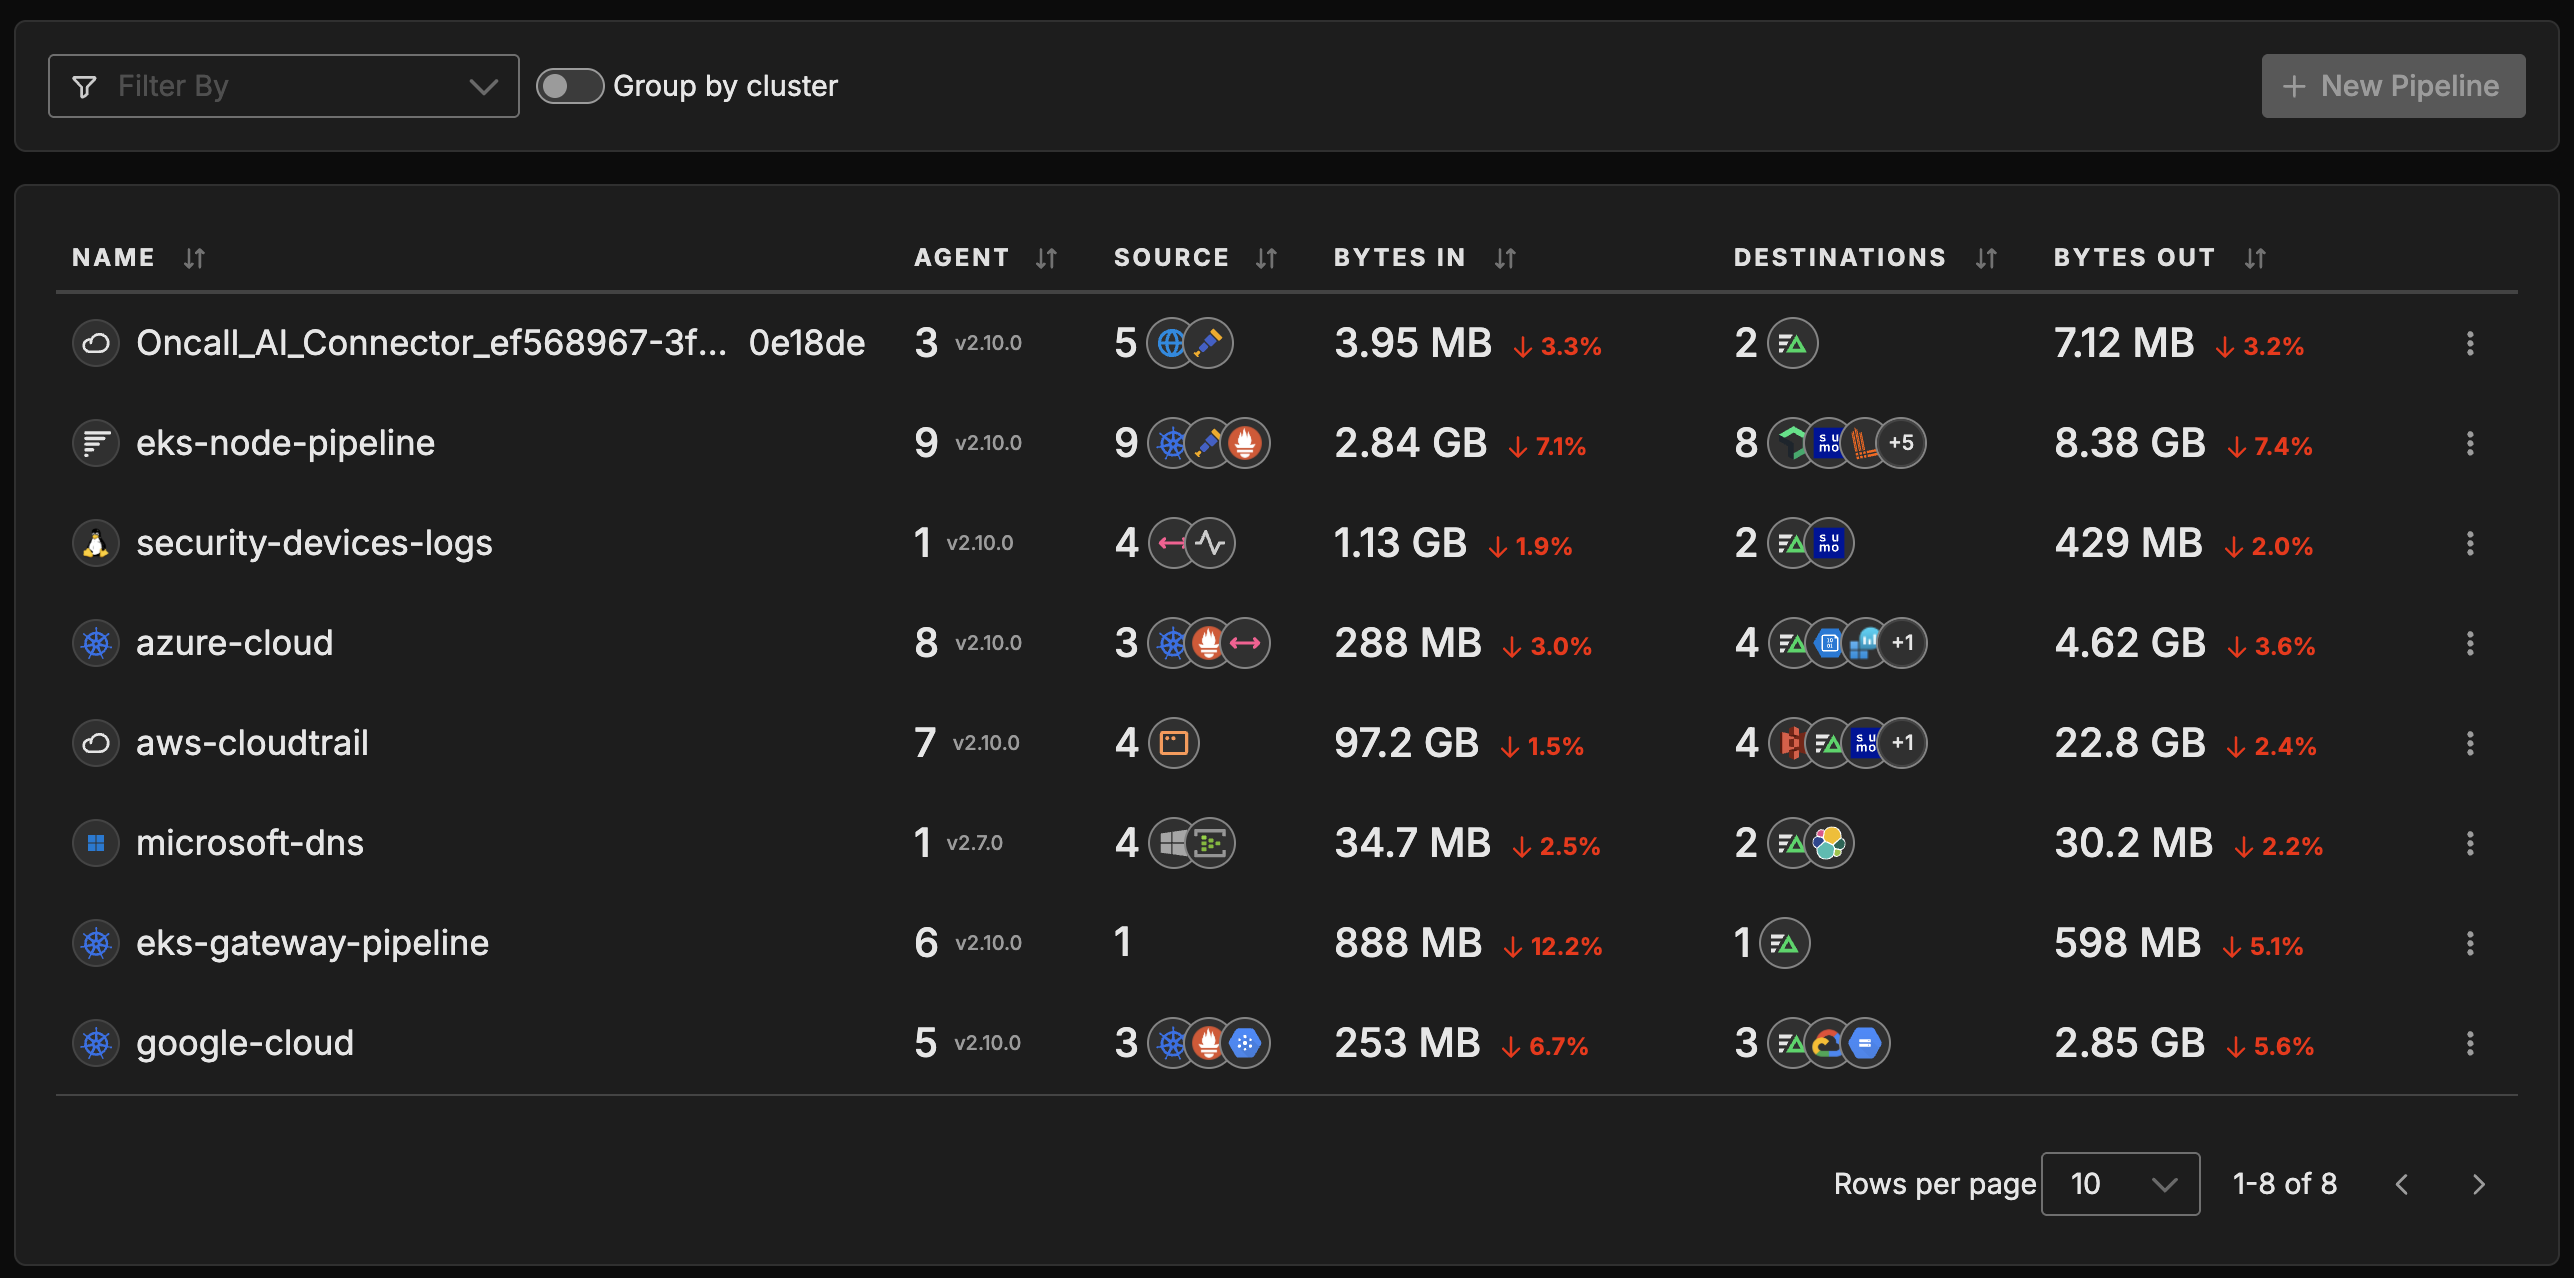
Select a pipeline to open it. It opens the pipeline view.