Edge Delta Prometheus Exporter Destination
8 minute read
Overview
The Edge Delta Prometheus Exporter destination node collects metrics and exposes them on a particular port for Prometheus to scrape. You can pipe any metrics in Edge Delta to the Prometheus Exporter destination node to expose them to Prometheus. If you pipe metrics to both the ed_metrics node and Prometheus, the metrics will appear in both locations: Prometheus and the Metrics Explorer.
- incoming_data_types: metric
The prometheus_exporter_output is suitable for scenarios where you want to expose your metrics to a Prometheus server for scraping. This is often used if you are deploying services that Prometheus will monitor directly, and you aim to use the metric data for alerting or visualization.
In contrast, the prometheus_remote_write_output is useful in situations where network security policies prevent services from being scraped directly or in architectures where you wish to have a centralized Prometheus setup receiving metrics from various remote nodes or regions. This is especially beneficial when dealing with large distributed systems where direct scraping might not be efficient or feasible.
This node requires Edge Delta agent version v0.1.89 or higher.
Metrics
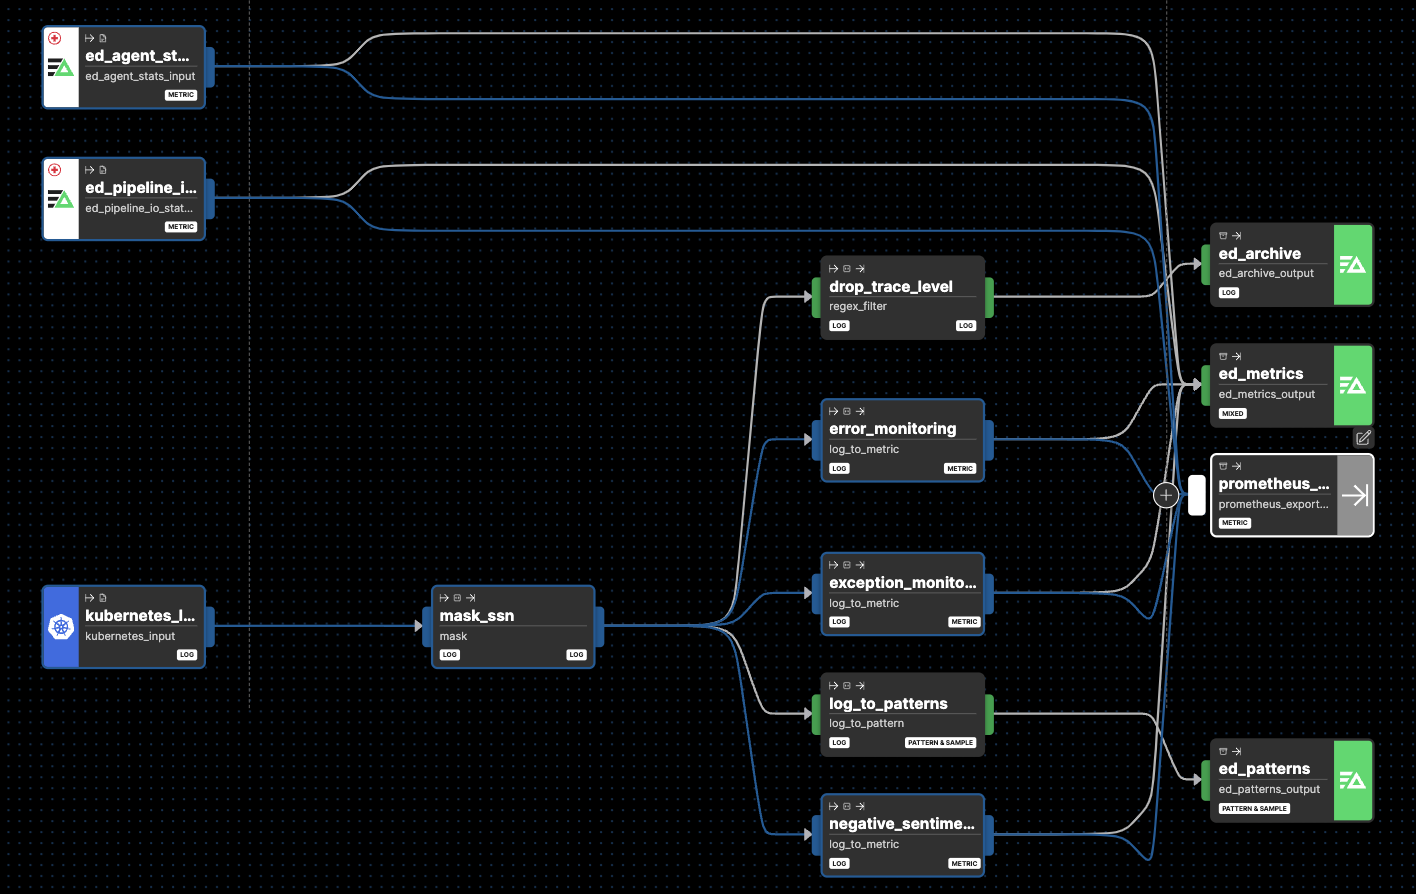
In this example pipeline, all the default and hidden metrics emitting nodes are connected to the Prometheus Exporter destination node.
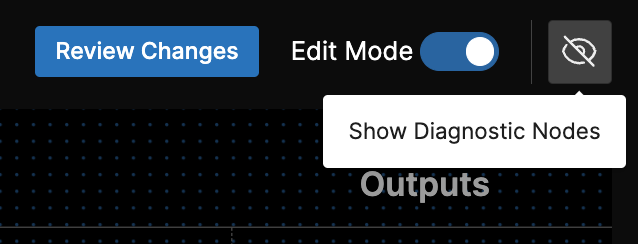
Note: Click Show Diagnostic Nodes to view all hidden nodes in the pipeline.
Example Configuration
nodes:
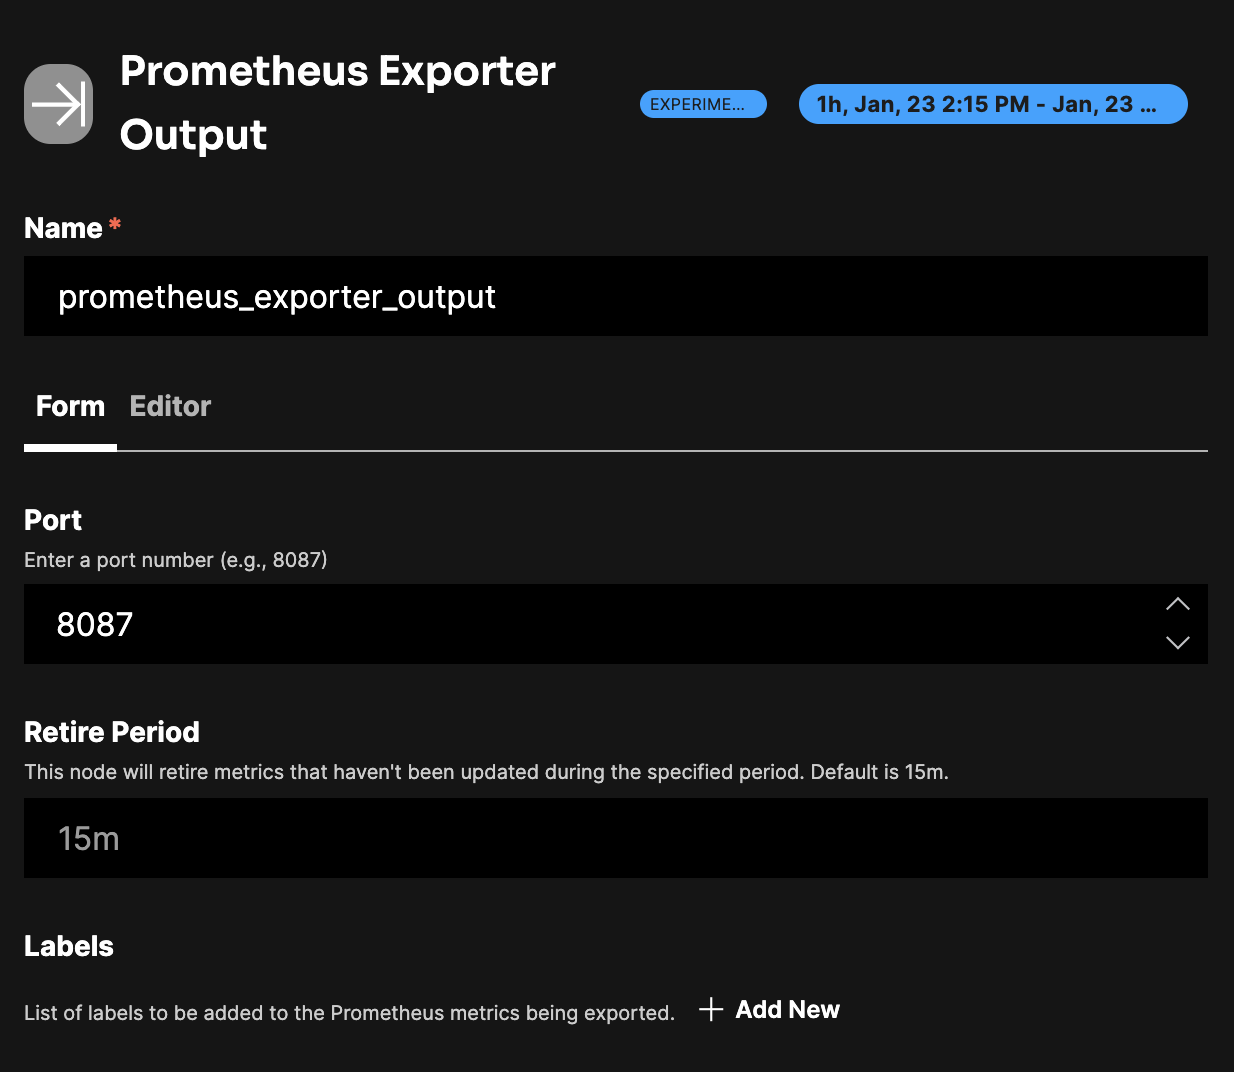
- name: prometheus_exporter_output
type: prometheus_exporter_output
port: 8087
Configuring Prometheus
A ServiceMonitor custom resource extends service discovery capability specifically for Kubernetes services. When you configure a ServiceMonitor, you define how Prometheus should discover the services from which it should collect metrics. This includes specifying criteria such as the namespace where the service exists and the labels that the service must have for it to be included in the discovery process.
When the Prometheus Operator sees a ServiceMonitor resource with these configurations, it alters the Prometheus instance’s configuration so that Prometheus starts scraping metrics from the services that match these criteria. This allows for automatic updating of the scraping targets as new services are deployed or existing services are updated within the Kubernetes cluster.
You need to pass in a values file when installing the Edge Delta agent to create a ServiceMonitor:
promPort: 8087
serviceMonitor:
  enabled: true
  namespace: monitoring
  scrapeTimeout: 10s
  jobLabel: edgedelta
  selector:
    release: prom-kube-stack
- promPort: 8087 - This sets a specific port (8087) for Prometheus to collect metrics from Edge Delta. Prometheus will scrape the metrics exposed on this port. It must match the port specified in the Prometheus Exporter pipeline configuration.
- serviceMonitor: This section contains configurations for a ServiceMonitor, which is a custom resource defined by the Prometheus operator used in Kubernetes environments. This operator makes the Prometheus configuration easier and more adaptable to dynamic cluster environments.
- enabled: true - This enables the creation of a ServiceMonitor resource, which means Prometheus is configured to automatically discover services and scrape metrics from them.
- namespace: monitoring - This defines the namespace where the ServiceMonitor resource will be created. The monitoring namespace is typically used for monitoring related resources in a Kubernetes cluster.
- scrapeTimeout: 10s - This sets the timeout for a scrape attempt by Prometheus. If the scrape takes longer than 10 seconds, it will be considered as a failure.
- jobLabel: edgedelta - This label is used to identify the collection of metrics “job” within Prometheus. Jobs in Prometheus configuration define a set of targets (endpoints) to scrape metrics from. By setting this label, Prometheus can differentiate the metrics scraped from Edge Delta vs. other jobs.
- selector: - This subsection specifies the label selectors required to identify the Service object associated with Edge Delta that Prometheus needs to scrape.
- release: prom-kube-stack - This indicates that the service to be scraped must have the specified labels. The ServiceMonitor will select the service that has a label release set to prom-kube-stack. If you are using a different Prometheus setup other than the prom-kube-stack, you need to change the
releasevalue in this file to match the name of the Prometheus release you are using.
- release: prom-kube-stack - This indicates that the service to be scraped must have the specified labels. The ServiceMonitor will select the service that has a label release set to prom-kube-stack. If you are using a different Prometheus setup other than the prom-kube-stack, you need to change the
If this file is called values.yaml, add the following flag to the helm installation command:
--values values.yaml
Note: Instead of passing in a separate values file, you can alternatively append the following parameters to the Helm command:
  --set promPort=8087 \
  --set serviceMonitor.enabled=true \
  --set serviceMonitor.namespace=monitoring \
  --set serviceMonitor.scrapeTimeout=10s \
  --set serviceMonitor.jobLabel=edgedelta \
  --set serviceMonitor.selector.release=prom-kube-stack
Docker deployment
When you run the Edge Delta agent in Docker, you must publish the Prometheus exporter port so that Prometheus can reach it from outside the container. Add the -p flag to the docker run command to map the container port to the host:
docker run --rm -d --name edgedelta \
  -p 8087:8087 \
  -v /var/run/docker.sock:/var/run/docker.sock:ro \
  -e "ED_API_KEY=your-pipeline-id" \
  gcr.io/edgedelta/agent:latest
The -p 8087:8087 flag maps port 8087 inside the container to port 8087 on the host. The port number must match the port value in your Prometheus Exporter pipeline configuration.
Note: All Docker flags such as
-p,-v, and-emust appear before the image name (gcr.io/edgedelta/agent:latest). Docker ignores flags placed after the image name.
After the agent starts, verify that metrics are accessible:
curl http://localhost:8087/metrics
Add a scrape target to your Prometheus configuration to begin collecting metrics:
scrape_configs:
  - job_name: edgedelta
    scrape_interval: 60s
    static_configs:
      - targets: ["host.docker.internal:8087"]
Note: Use
host.docker.internalif Prometheus also runs in Docker. If Prometheus runs directly on the host, uselocalhost:8087. If both the agent and Prometheus run in the same Docker network, use the agent’s container name, for exampleedgedelta:8087.
Connecting metric sources
The Prometheus Exporter destination only exposes metric data. To see metrics on the /metrics endpoint, connect metric-producing sources to the Prometheus Exporter node in your pipeline. For Docker deployments, the relevant metric sources are:
- Container Statistics (
ed_container_stats_input): Collects CPU, memory, disk, and network metrics from containers on the host. This source is available by default in Docker pipelines. - Self Telemetry (
ed_self_telemetry_input): Reports agent health metrics such as CPU usage, memory allocation, and buffer sizes.
If these sources are not linked to the Prometheus Exporter node, the /metrics endpoint returns an empty response.
Required Parameters
name
A descriptive name for the node. This is the name that will appear in pipeline builder and you can reference this node in the YAML using the name. It must be unique across all nodes. It is a YAML list element so it begins with a - and a space followed by the string. It is a required parameter for all nodes.
nodes:
  - name: <node name>
    type: <node type>
type: prometheus_exporter_output
The type parameter specifies the type of node being configured. It is specified as a string from a closed list of node types. It is a required parameter.
nodes:
  - name: <node name>
    type: <node type>
port
The port parameter defines the port that Edge Delta will expose a metrics endpoint to for Prometheus. It specifies which port the Edge Delta agent will listen on to expose metrics for Prometheus to scrape. This should match the promPort parameter specified in the Helm chart values file. It is specified as a string and is required for a Prometheus Exporter destination.
nodes:
- name: prometheus_exporter_output
  type: prometheus_exporter_output
  port: 8087
Optional Parameters
disabled
The disabled parameter disables the node in the pipeline. When set to true, the agent ignores the node at startup. You can toggle nodes on or off in the pipeline builder. It is specified as a boolean, defaults to false, and is optional.
nodes:
  - name: <node name>
    type: <node type>
    disabled: true
interval
The interval parameter is used to define how long the exporter should collect metrics per interval. The Prometheus server should be configured to collect metrics at the same interval. It is specified as a duration, the default is 1m and it is optional.
nodes:
- name: prometheus_exporter_output
  type: prometheus_exporter_output
  port: 8087
  interval: 1m
labels
The labels parameter is used to define labels to append to the metrics. This is useful for differentiating between metrics generated by different Edge Delta agents and for differentiating between metrics with capture groups that are saved as metric attributes. Labels are defined with a name for the field, and a path to the source field containing the label value. Prometheus restricts label names to ASCII letters, digits, and underscores. See here for information on how to reference fields. Labels are optional.
nodes:
- name: prometheus_exporter_output
  type: prometheus_exporter_output
  port: 8087
  labels:
    - name: k8s_namespace
      path: item["resource"]["k8s.namespace.name"]
    - name: k8s_container_name
      path: item["resource"]["k8s.container.name"]
    - name: k8s_pod_name
      path: item["resource"]["k8s.pod.name"]
    - name: k8s_deployment_name
      path: item["resource"]["k8s.deployment.name"]
    - name: k8s_daemonset_name
      path: item["resource"]["k8s.daemonset.name"]
    - name: k8s_statefulset_name
      path: item["resource"]["k8s.statefulset.name"]
    - name: k8s_replicaset_name
      path: item["resource"]["k8s.replicaset.name"]
    - name: k8s_cronjob_name
      path: item["resource"]["k8s.cronjob.name"]
    - name: k8s_job_name
      path: item["resource"]["k8s.job.name"]
    - name: platform_label
      path: item["attributes"]["platform"]
    - name: platform_label
      path: item["attributes"]["status_code"]
Note: The following Edge Delta fields are not passed by the output unless explicitly set as labels:
item["resource"]["__group_name"]item["resource"]["__logical_source"]item["resource"]["__short_src_name"]item["resource"]["__src_name"]
retire_period
The retire_period parameter is used to define how long to wait before retiring unused metric vectors. It is specified as a duration, the default is 15m and it is optional.
nodes:
- name: prometheus_exporter_output
  type: prometheus_exporter_output
  port: 8087
  retire_period: