Create a Test Bench for Edge Delta
6 minute read
Overview
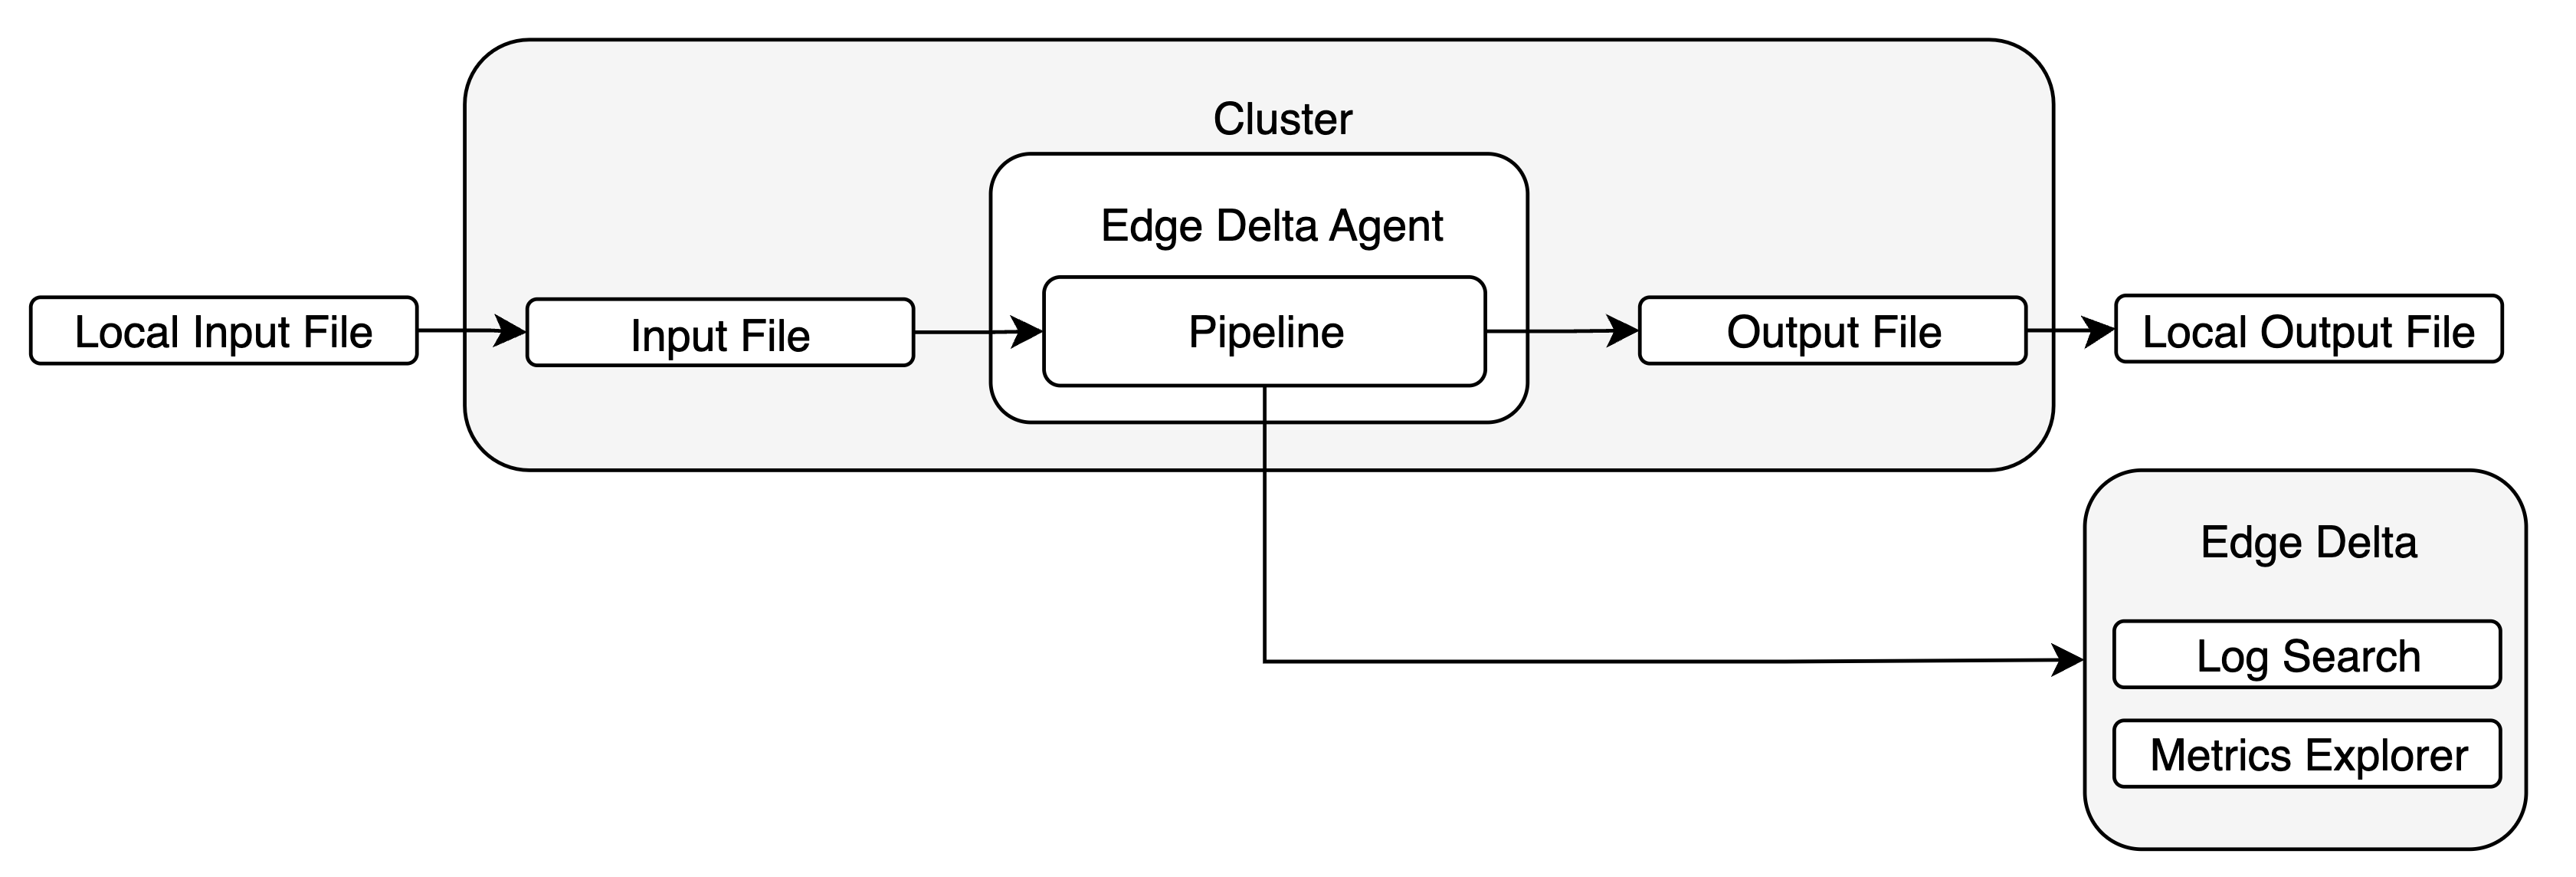
A test bench is useful for trying out pipeline configurations in a controlled environment. In this tutorial, you will configure a local file to use as a log input, and a number of folders to use a log outputs. Then you will test a pipeline by dropping logs into the input file, and observing the success path output logs in the Edge Delta archive using Log Search or metrics explorer, while failure path logs are sent to the local storage output folders.
1. Install Prerequisites
Install Docker and Kind if you don’t have them already. This section will use brew to install applications.
brew install docker
brew install kind
2. Prepare a folder structure
- Create a folder on your local machine where you will save files to run the test cluster. In this example it is called
testbench. - Create a subfolder called
inputlogsintestbench. - Create a subfolder called
failsintestbench. - Create a subfolder called
routeinfails. - Create a file called
testbench_input_file.login theinputlogsfolder.
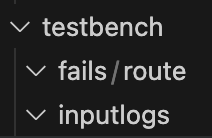
The folder structure should look like this:
3. Create a cluster definition
Create the following yaml file that defines a cluster. It includes extraMounts that will connect files on your machine to files in the container. Save it as testbench_cluster.yaml in the testbench folder.
kind: Cluster
apiVersion: kind.x-k8s.io/v1alpha4
nodes:
- role: control-plane
  extraMounts:
  - hostPath: /Users/path/testbench/inputlogs
    containerPath: /mnt/inputfile/logs
  - hostPath: /Users/path/testbench/fails/route
    containerPath: /mnt/outputfile/route/logs
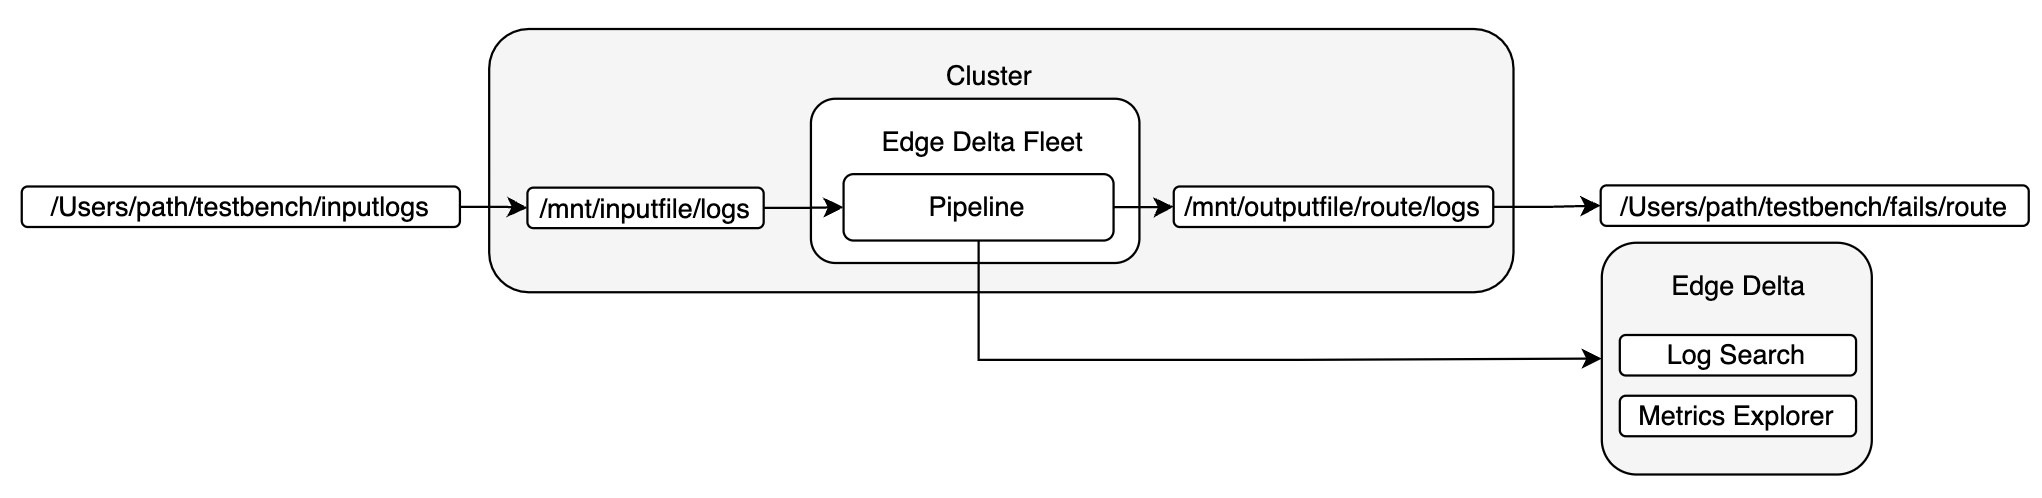
Replace both instances of /Users/path with the actual path to the testbench folder you created in step 2, for example /Users/yourname/Documents/testbench/inputlogs and /Users/yourname/Documents/testbench/fails/route.
Later when you need more local storage outputs you can add them to this file and re-create the cluster.
4. Create the Cluster
Open a terminal on the testbench folder and create a cluster named testbenchcluster using the testbench_cluster.yaml file.
kind create cluster --config testbench_cluster.yaml --name testbenchcluster
You must run this command in the folder that contains the
testbench_cluster.yamlfile you created in Step 3. If you are using Visual Studio Code, right click thetestbench_cluster.yamlfile in the File Explorer and select Open in Integrated Terminal
5. Create a Helm Override
In this step you create a helm override values file to enable Edge Delta to access the in-cluster file locations.
- Create a yaml file and name it appropriately, such as
custom-values.yaml. - Add the following yaml to the file:
volumeProps:
  volumeMounts:
    - name: input-file
      mountPath: /mnt/inputfile/logs
      readOnly: true
    - name: output-route
      mountPath: /mnt/outputfile/route/logs
  volumes:
    - name: input-file
      hostPath:
        path: /mnt/inputfile/logs
        type: DirectoryOrCreate
    - name: output-route
      hostPath:
        path: /mnt/outputfile/route/logs
        type: DirectoryOrCreate
Later when you need more local storage outputs you can add more volumemounts and volumes to this file.
6. Sign Up for an Edge Delta Account
If you dont have an Edge Delta account already:
- Click Sign Up for Free on the edgedelta.com website.
- Enter your details in the Account Details page and click Register. Alternatively, click Sign up with Google.
- Check your email and Activate your account.
- If a user with the same domain name as your email address has created an organization you can click it to request to join it and wait for their approval. Otherwise, click Create an Organization.
- Enter an Organization name and click Next.
7. Install the Edge Delta Agent
Install the Edge Delta Agent using the custom manifest
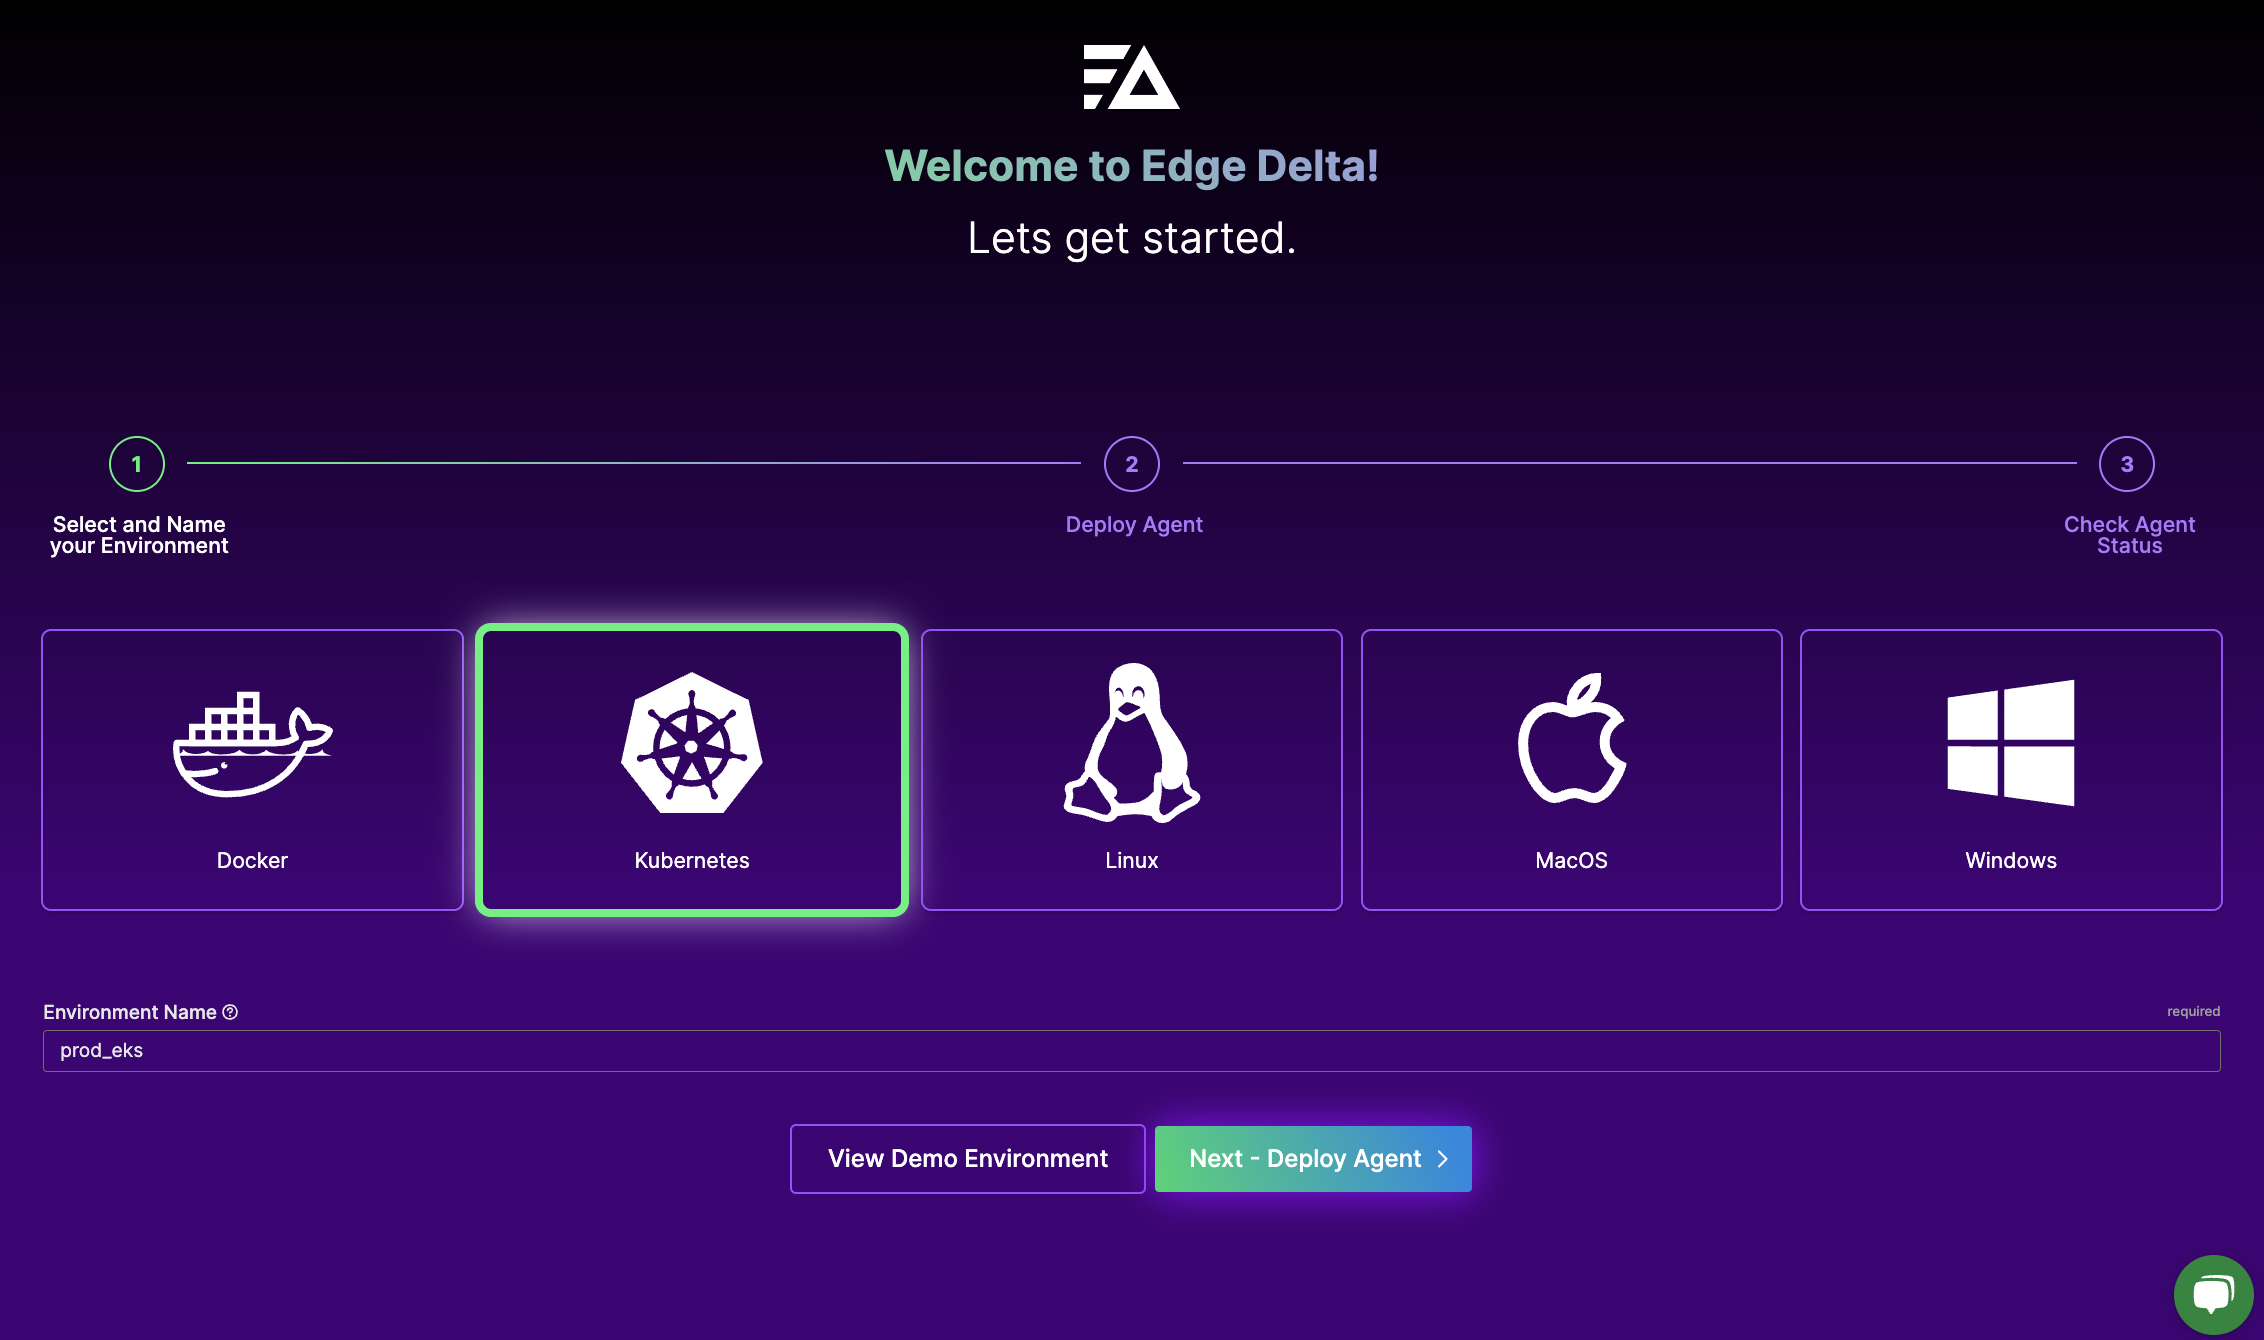
- Select Helm.
- Specify
testbenchas the name for the configuration. - Click Continue.
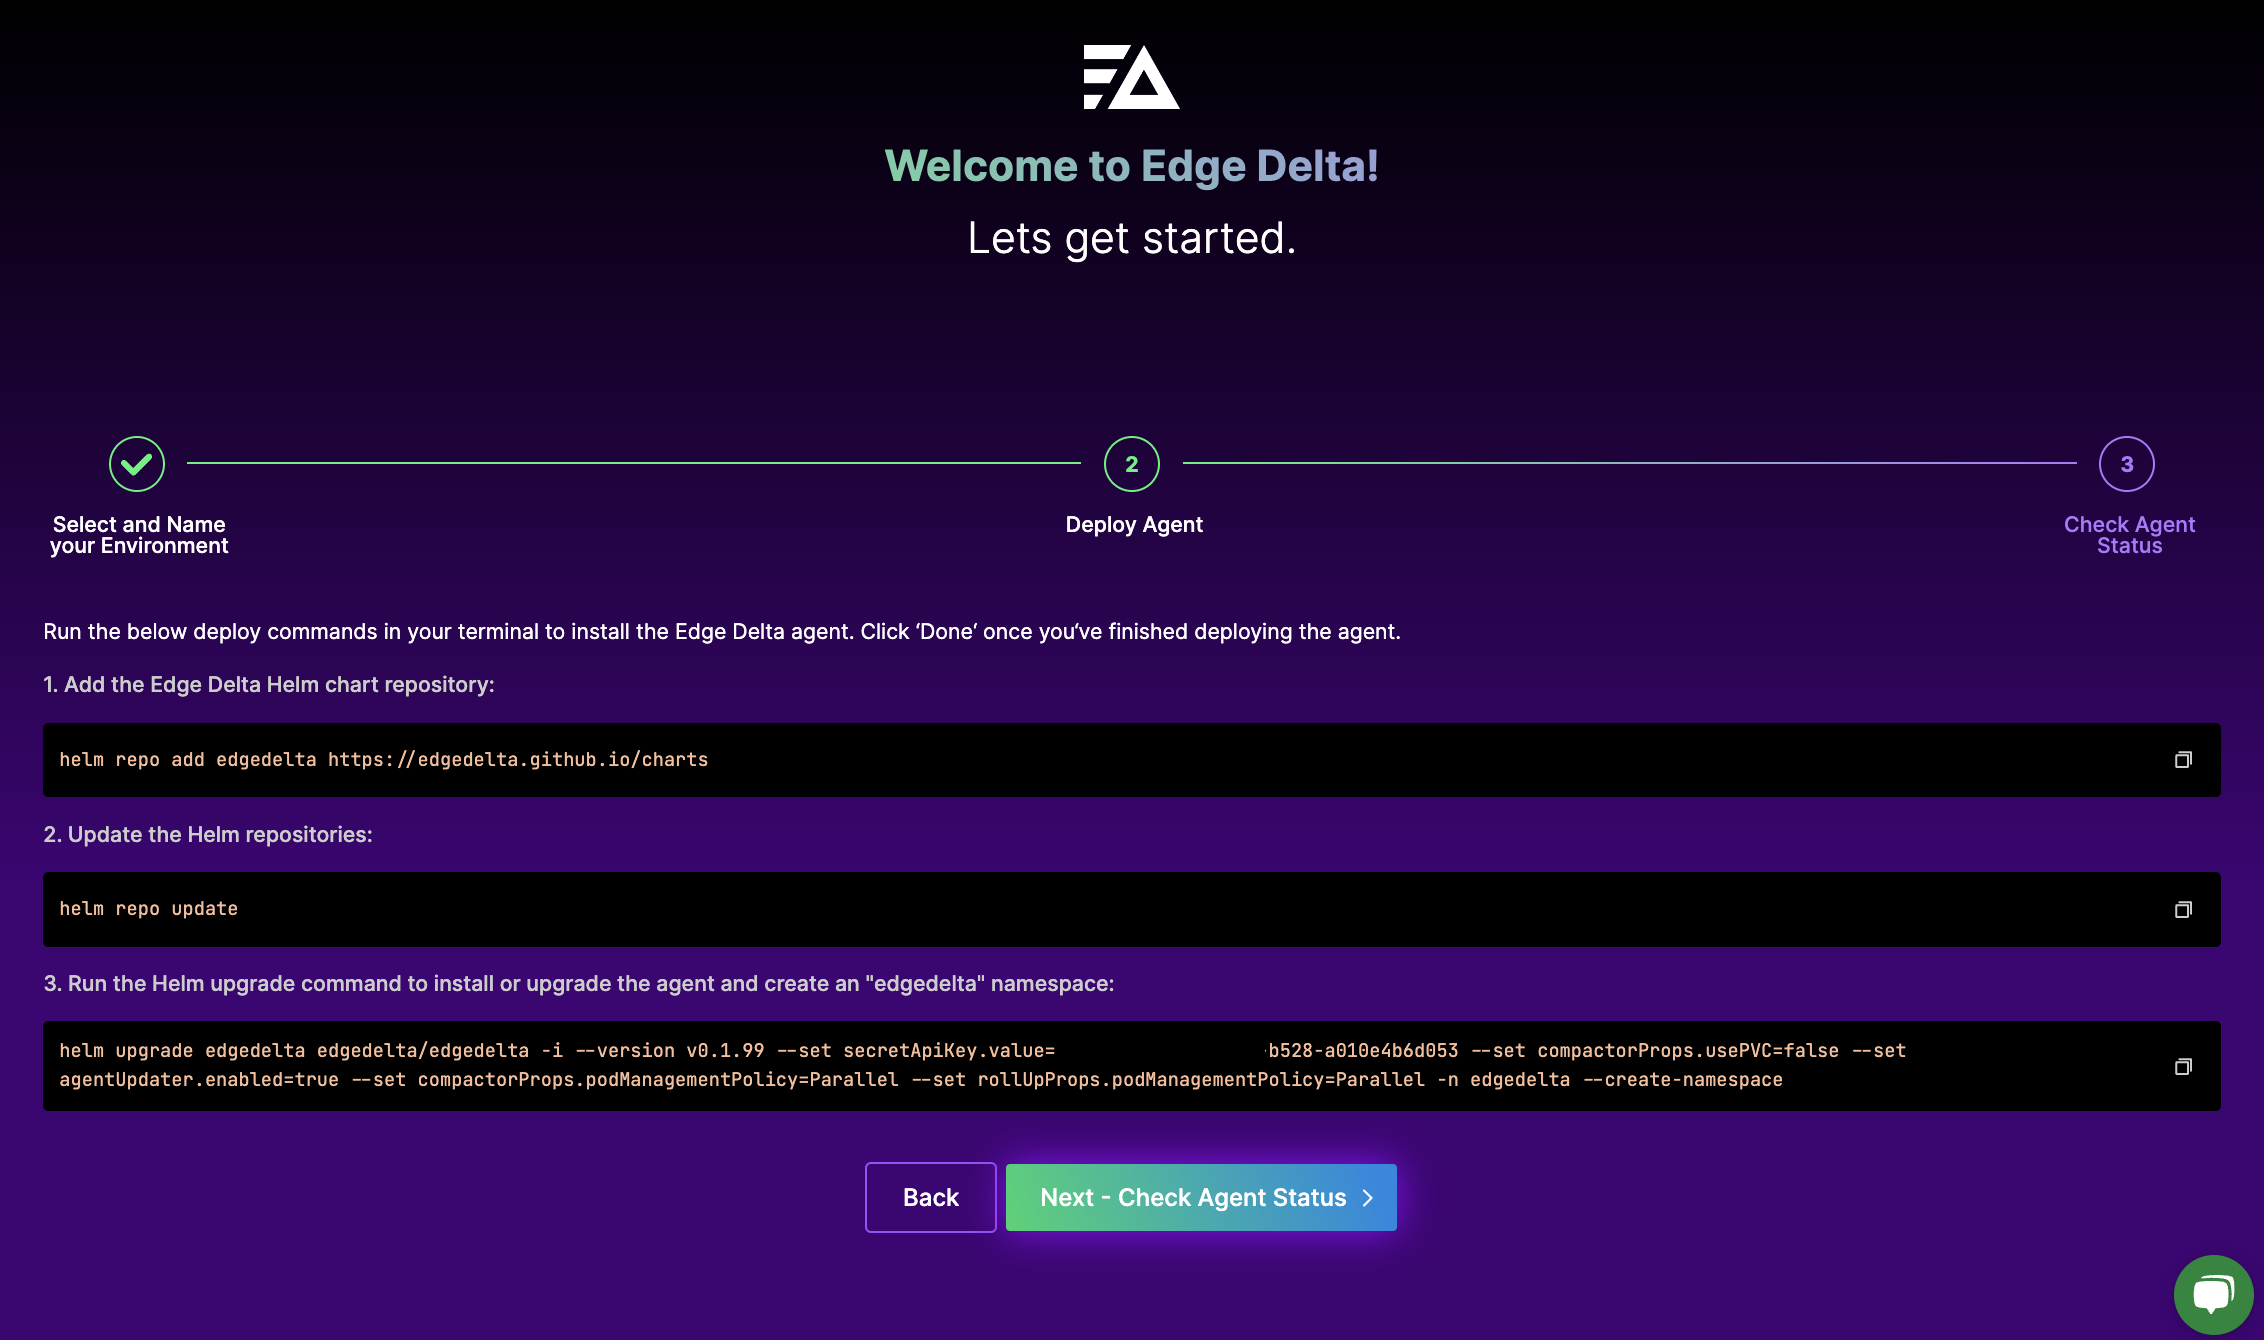
- Copy and run the first command provided to create the edgedelta namespace in the cluster.
helm repo add edgedelta https://edgedelta.github.io/charts
- Copy and run the second command provided.
helm repo update
- Copy the third command provided in the UI, and append the override values file. The command will look similar to this but with a different Pipeline ID, note the
-f custom-values.yaml:
helm upgrade edgedelta edgedelta/edgedelta -i --version v0.1.92 --set secretApiKey.value=123456789987654321 -n edgedelta --create-namespace -f custom-values.yaml
In this example the custom yaml file was called custom-values.yaml, replace it with the name of the file you created in step 5.
- Click I Ran Deploy Commands.
- Click I’ll Take it from here.
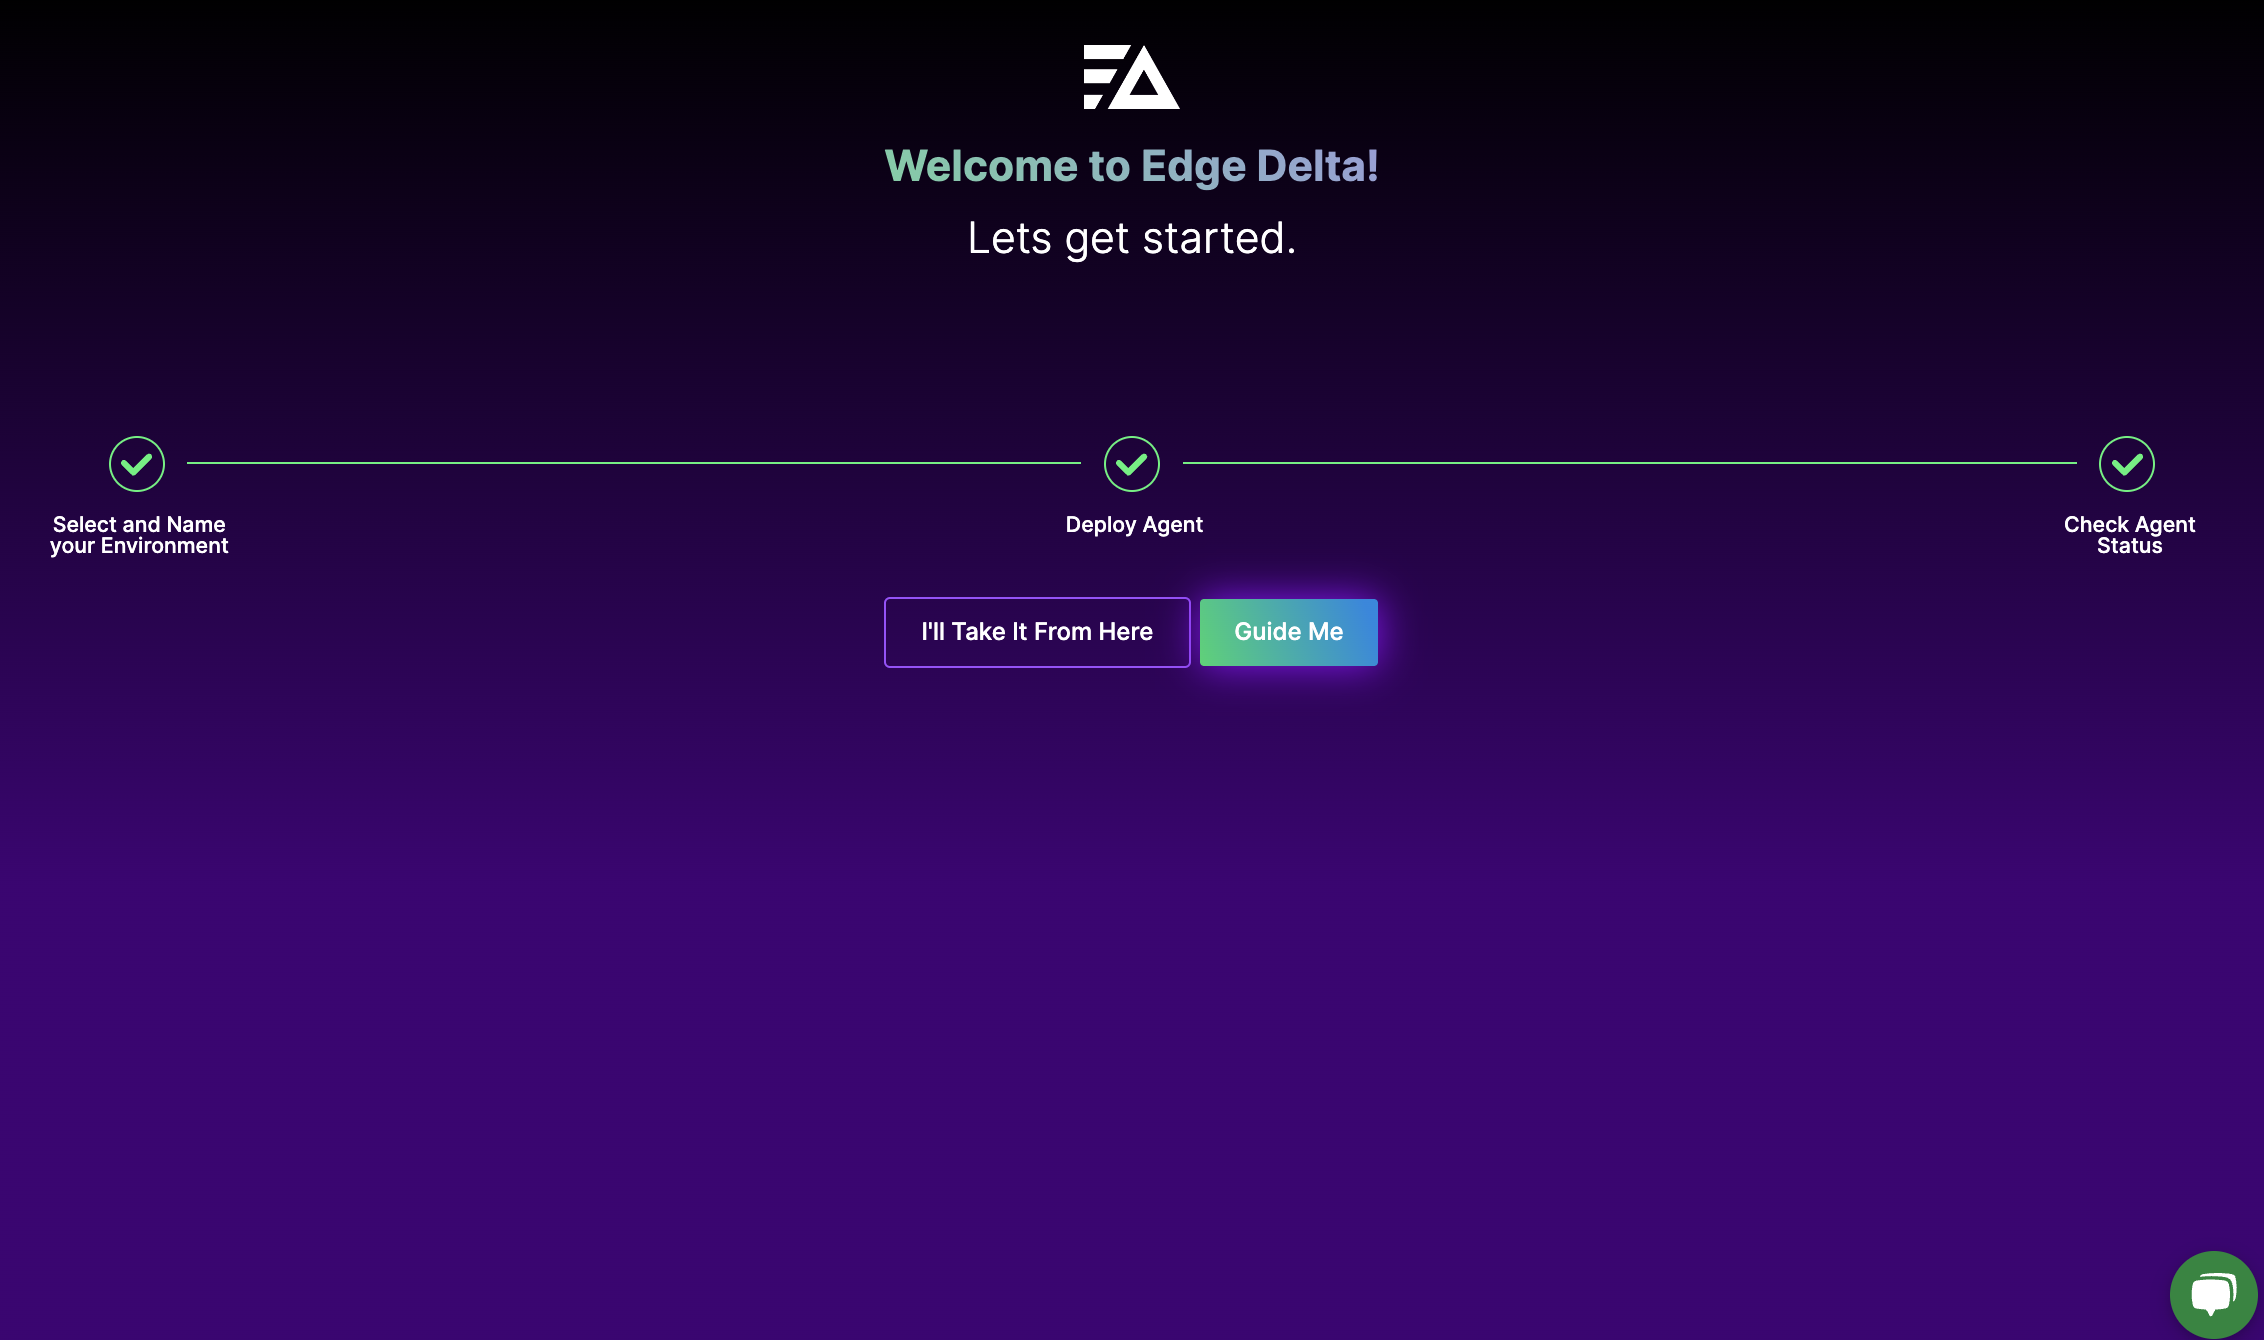
A new agent with the default configuration is now installed in your cluster.
8. Remove nodes from the default configuration.
- Click Pipelines.
- Click the
testbenchFleet and click View/Edit Pipeline. - Click Edit Mode.
- Remove all nodes except
ed_archive,ed_patterns, anded_metrics. To do this double-click the node you want to delete and click Delete Node.
9. Create a File Input Node
In this step you create an input node that tails any file in the mounted folder /mnt/inputfile/logs.
- Click Add Input, expand Standard and select File Input.
- Specify a Name for the file input node
file_input_test. - Enter
/mnt/inputfile/logs/*.*in the Path field. The path should match the one you specified in the Edge Delta custom manitest. The file pattern uses wildcard characters to tail any file in the mounted folder . - Click Okay.
- Connect the
file_input_testnode to theed_archivenode. - Click Review Changes.
- Click Deploy Changes.
10. Review the YAML
- Click Pipelines.
- Click the kebab (⋮) icon and select Edit YAML.
The pipeline’s YAML includes the following links and nodes:
version: v3

settings:
  tag: testbench
  log:
    level: info
  archive_flush_interval: 1m0s
  archive_max_byte_limit: 16MB

links:
- from: ed_component_health
  to: ed_health
- from: ed_node_health
  to: ed_health
- from: ed_agent_stats
  to: ed_metrics
- from: ed_pipeline_io_stats
  to: ed_metrics
- from: file_input_test
  to: ed_archive

nodes:
- name: ed_component_health
  type: ed_component_health_input
- name: ed_node_health
  type: ed_node_health_input
- name: ed_agent_stats
  type: ed_agent_stats_input
- name: ed_pipeline_io_stats
  type: ed_pipeline_io_stats_input
- name: ed_archive
  type: ed_archive_output
- name: ed_metrics
  type: ed_metrics_output
- name: ed_health
  type: ed_health_output
- name: ed_patterns
  type: ed_patterns_output
- name: file_input_test
  type: file_input
  path: /mnt/inputfile/logs/*.*
It includes nodes that are hidden by default in Visual Pipelines. The file_input_test node is configured with the path, and it is connected using a link to the ed_archive node.
11. Test the Pipeline Without a Processor
The pipeline currently pipes logs tailed from the input file directly to the ed_archive node without any processors in the pipeline. Test this functionality by dropping a log into the input file.
- In a terminal, navigate to the local mapped volume of the input file, such as
/Users/path/testbench/inputlogs. You configured this location when you created a cluster definition earlier. - Echo a test message into the file:
echo "this is a test log" >> testbench_input_file.log
This appends the line to a file called testbench_input_file.log. If the file does not exist it will be created. If you execute the command a number of times, a new line is added to the file.
3. View the testbench_input_file.log file.
cat testbench_input_file.log
- After a few minutes, click Logs in the Edge Delta app. Log search will open and it will show the most recent logs saved to the ed_archive. You may need to filter on your pipeline
testbenchin the Filters pane if you have more than one agent running. If the log isn’t visible yet click the refresh button to see if it has been ingested and indexed in the archive yet.