Debug Edge Delta Components
6 minute read
Recap
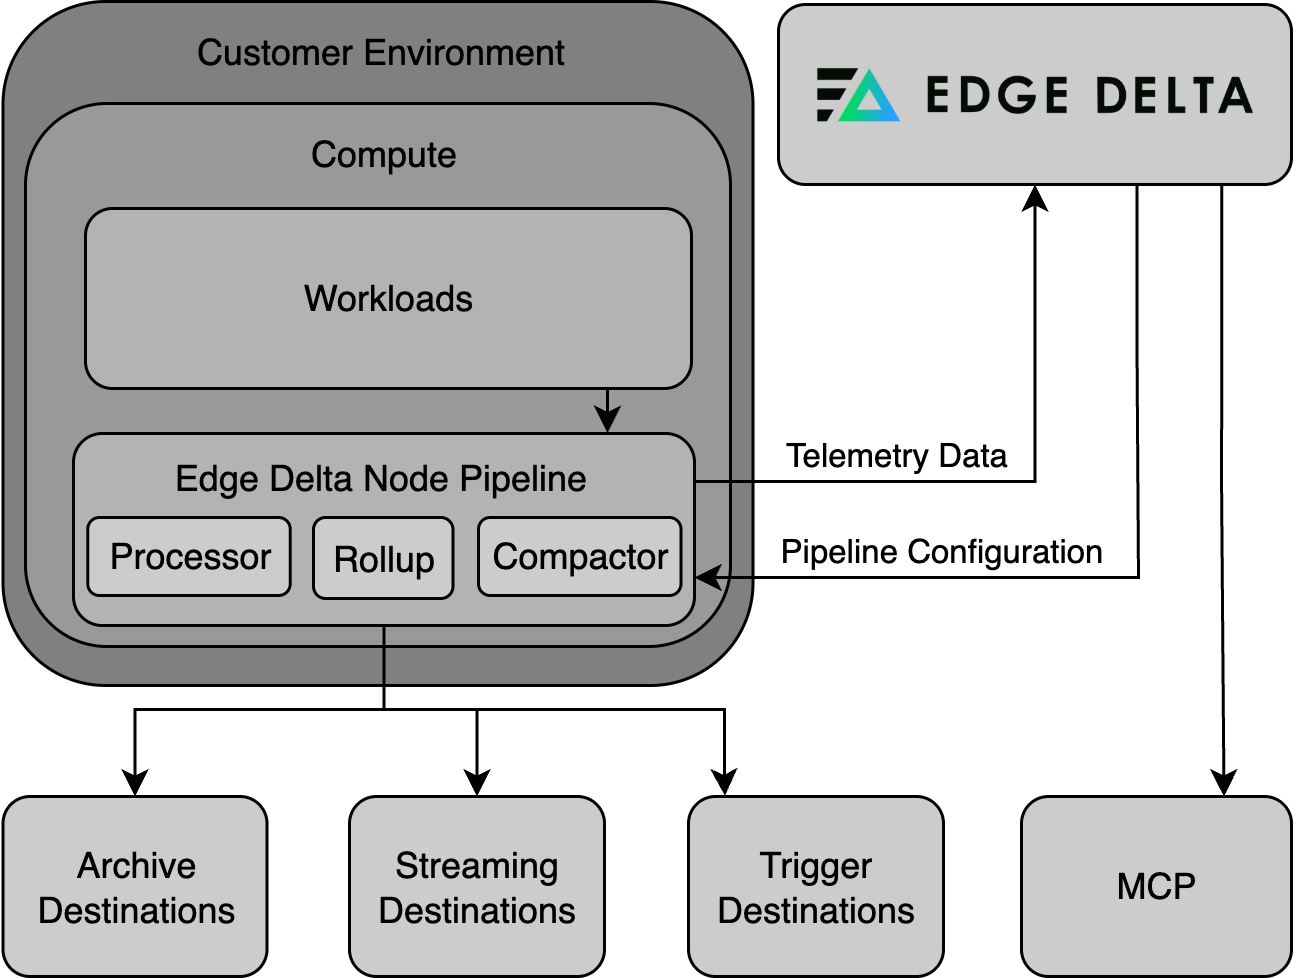
The Edge Delta installation includes the Edge Delta Processor agent, a Compactor Agent, and a Rollup Agent.
- The Processor agent (DaemonSet) pre-processes data: extracting insights, generating alerts, creating summarized datasets, and more. It delivers logs to the Rollup Agent or directly to the Compactor Agent (skipping Rollup) depending on the configuration.
- The Rollup Agent (Deployment) reduces metric data volume by optimizing data point frequency and cardinality, which significantly minimizes storage requirements and can expedite data queries. When the Rollup Agent is not installed logs can be sent directly from the Agent to the Compactor. It delivers logs to the Compactor Agent.
- The Compactor Agent (Deployment) compresses and encodes data before they are sent to the Edge Delta Observability Platform, ensuring effective bandwidth use and data processing.


Debugging the Agent, Rollup and Compactor (Kubernetes)
1. Check for Pod Restarts
Check if there are any restarts in the environment:
kubectl get pods -n edgedelta
Check the STATUS column:
Running The pod is active. Any status other than Running indicates an issue. Note the pods name if it requires investigation.
Pending The pod is waiting to be scheduled and run. The pod may be stuck in Pending due to:
- Insufficient Resources: The cluster might lack the necessary CPU, memory, or other resources required to run the pod.
- Tolerations and Affinity: The pod’s scheduling constraints, such as taints and tolerations or affinity rules, may not be satisfied by any of the nodes.
- Image Pull Issues: There might be problems pulling the container image from the registry, such as when the image is large, the registry is slow or down, or if there are authentication problems.
- Volume or ConfigMap/Secret Dependencies: The pod may be waiting for a volume to be mounted or for a necessary ConfigMap or Secret to be available.
- Security Constraints: Pod Security Policies (PSP) or other security mechanisms could block the pod from being scheduled.
BackoffCrashloop The pod was undergoing multiple restarts and has been stopped. The pod may be in BackoffCrashloop due to:
- Application Errors: There could be a bug or other issue with the application code itself causing it to exit unexpectedly.
- Configuration Errors: The pod might be configured incorrectly in terms of environment variables, command-line arguments, or configurations passed through config maps or secrets, causing the application to fail during initialization.
- Resource Constraints: The pod might not have enough CPU or memory allocated to it, resulting in the application being killed by the Kubernetes scheduler or the underlying node’s operating system.
- Dependency Issues: The pod might be unable to reach a necessary service, database, or other dependencies that it needs to start up properly.
- Persistent Storage Issues: There may be problems with persistent storage, such as permissions issues, incorrect paths, or issues with the storage provider.
- Container Image Issues: There might be a problem with the container image, such as an incorrect entry point or command that prevents the container from starting.
- Health Checks Failing: The application may be starting but failing readiness or liveness probes due to configuration issues or the application not being fully operational at the time the health check is performed.
- Security Constraints: Pod Security Policies or network policies may be preventing the application from executing or accessing needed resources.
2. Gather Information
In this step you gather information about faulty pods and save in txt and log files. You can send these files to Edge Delta support to assist in debugging.
View the pod description with the kubectl describe command.
kubectl describe pods <pod name> -n edgedelta >> describe.txt
Replace <pod name> with the pod’s name as per the NAME column from Step 1. Also change edgedelta if the components were installed in a different namespace.
Then view the pod logs with the kubectl logs command and the --previous flag:
kubectl logs <pod name> -n edgedelta --previous >> pod.log
Replace <pod name> with the pod’s name as per the NAME column from Step 1. Also change edgedelta if the components were installed in a different namespace.
3. Interpret Information.
Examine the describe.txt file:
Search the Containers section for Last State.
- An OOMKilled Reason indicates a resource pressure. See Scale Edge Delta Deployments.
- A Reason of
ERRORindicates an application error. In this instance, proceed to examine the pod.log file.
Examine the pod.log file:
- Identify Error Messages: Look for messages that clearly indicate errors, typically containing keywords such as ERROR, FATAL, CRITICAL, EXCEPTION, or FAILED. The error messages will usually describe the nature of the error and sometimes provide an error code. You can sometimes fix this issue by adapting the Pipeline configuration.
- Understand the Context: Read the log entries before and after the error message to understand what the application was attempting to do when the error occurred.
- Analyze Timestamps: Notice the timestamps associated with the log entries to understand the sequence of events leading up to the error. This can also help identify if the error occurs during a specific part of the application’s lifecycle (e.g., during startup, shutdown, or a specific operation).
- Look for Patterns: If the log is from a pod that’s been in a crash loop, compare errors across multiple log destinations to see if there’s a repeating pattern. Consistency in error messages can help isolate persistent issues versus one-time anomalies.
- Check Initialization and Configuration: Ensure that the application’s initialization and configuration were successful and that no errors occurred during these phases. Configuration issues such as missing environment variables, incorrect file paths, or invalid parameters are common culprits.
- Examine Related Resources: Sometimes, issues aren’t with the application directly but with related resources such as databases, external APIs, or dependent services. Make sure these resources are available and operating normally.
- Check for Resource Limitations: Verify that the pod isn’t running out of assigned resources such as CPU and memory, as this could cause crashes and errors. See Scale Edge Delta Deployments.
- Take Action Based on Findings: Once you’ve identified the error, take appropriate corrective action, which might involve fixing a bug, changing configuration, adding missing resources, increasing resource limits, etc.
For assistance contact Edge Delta support.
4. Test Network Connectivity
Edge Delta agent pods run minimal containers that contain only the agent binary. They do not include a shell, curl, or other general-purpose utilities, so you cannot use kubectl exec to run commands inside them.
To test connectivity from within the cluster, run a temporary debug pod:
kubectl run -it --rm debug --image=curlimages/curl --restart=Never -- \
  curl -I https://api.edgedelta.com
This creates an ephemeral pod with curl available, tests the connection, and deletes itself when done. To test through a proxy, add the proxy environment variable:
kubectl run -it --rm debug --image=curlimages/curl --restart=Never -- \
  sh -c 'https_proxy=http://proxy.example.com:8080 curl -I https://api.edgedelta.com'
A successful response returns an HTTP status code, confirming that the cluster can reach the Edge Delta API. See Proxy Configuration for proxy-specific troubleshooting.