Edge Delta Dashboards
Manage and customize dashboards in the Edge Delta web application, including creating, editing, and sharing dashboards.
2 minute read
Overview
You can create and manage your own dashboards in Edge Delta. There are dashboards already configured for you and you can design your own.
See Quickstart: Create a Dashboard for a quickstart guide to creating a dashboard to view performance.
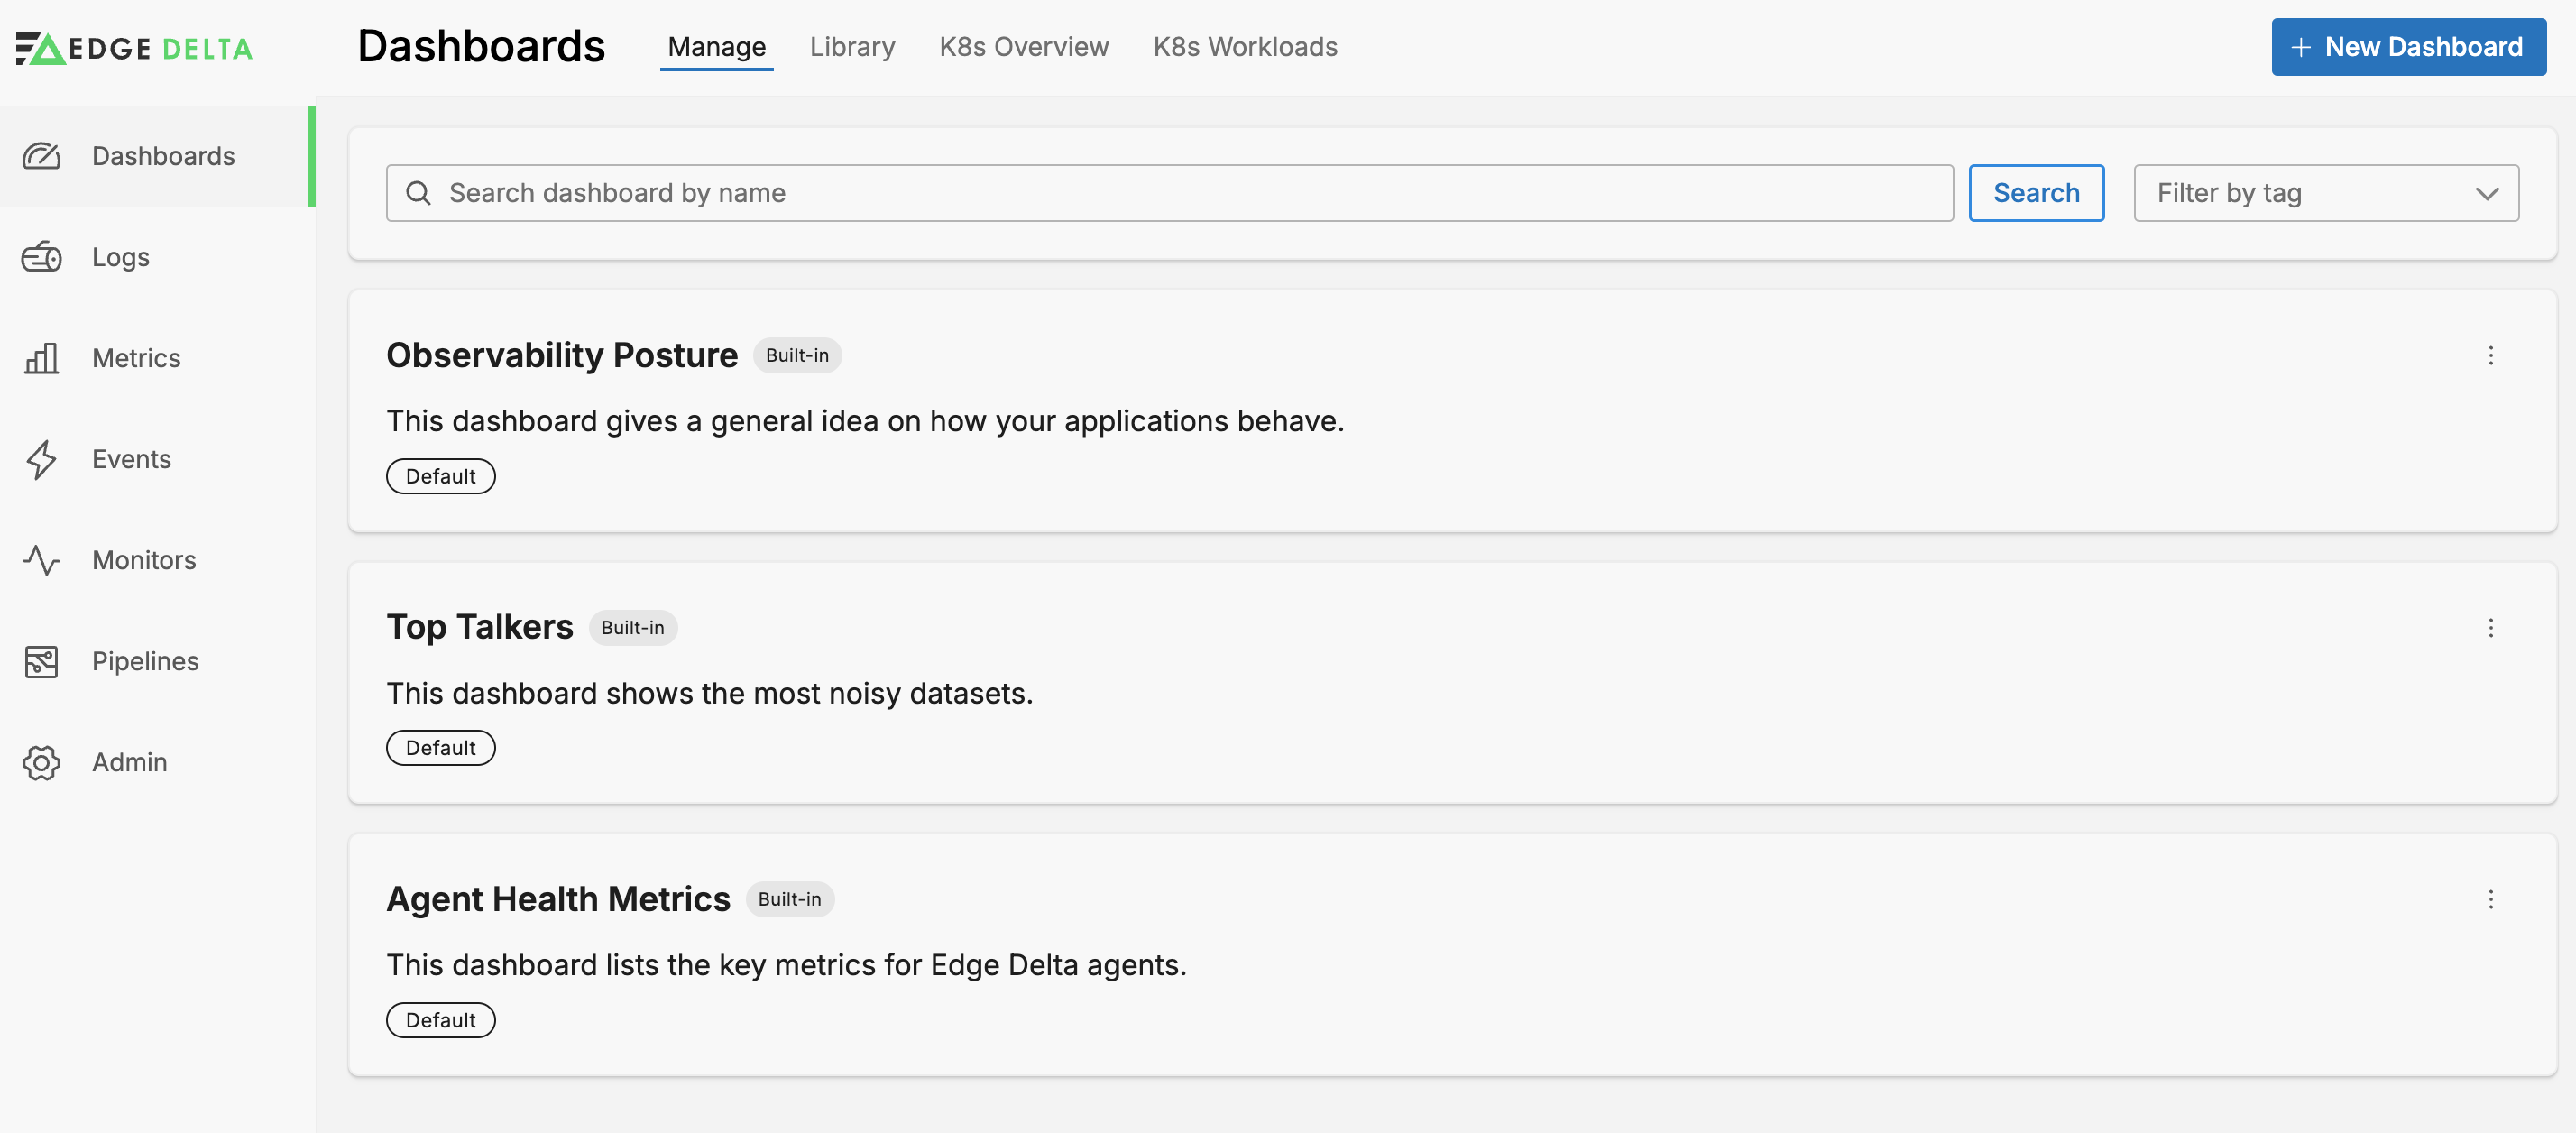
Default Dashboards
Click Dashboards and select the Manage tab to view the default dashboards as well as the dashboards you create. Click a dashboard to view it.
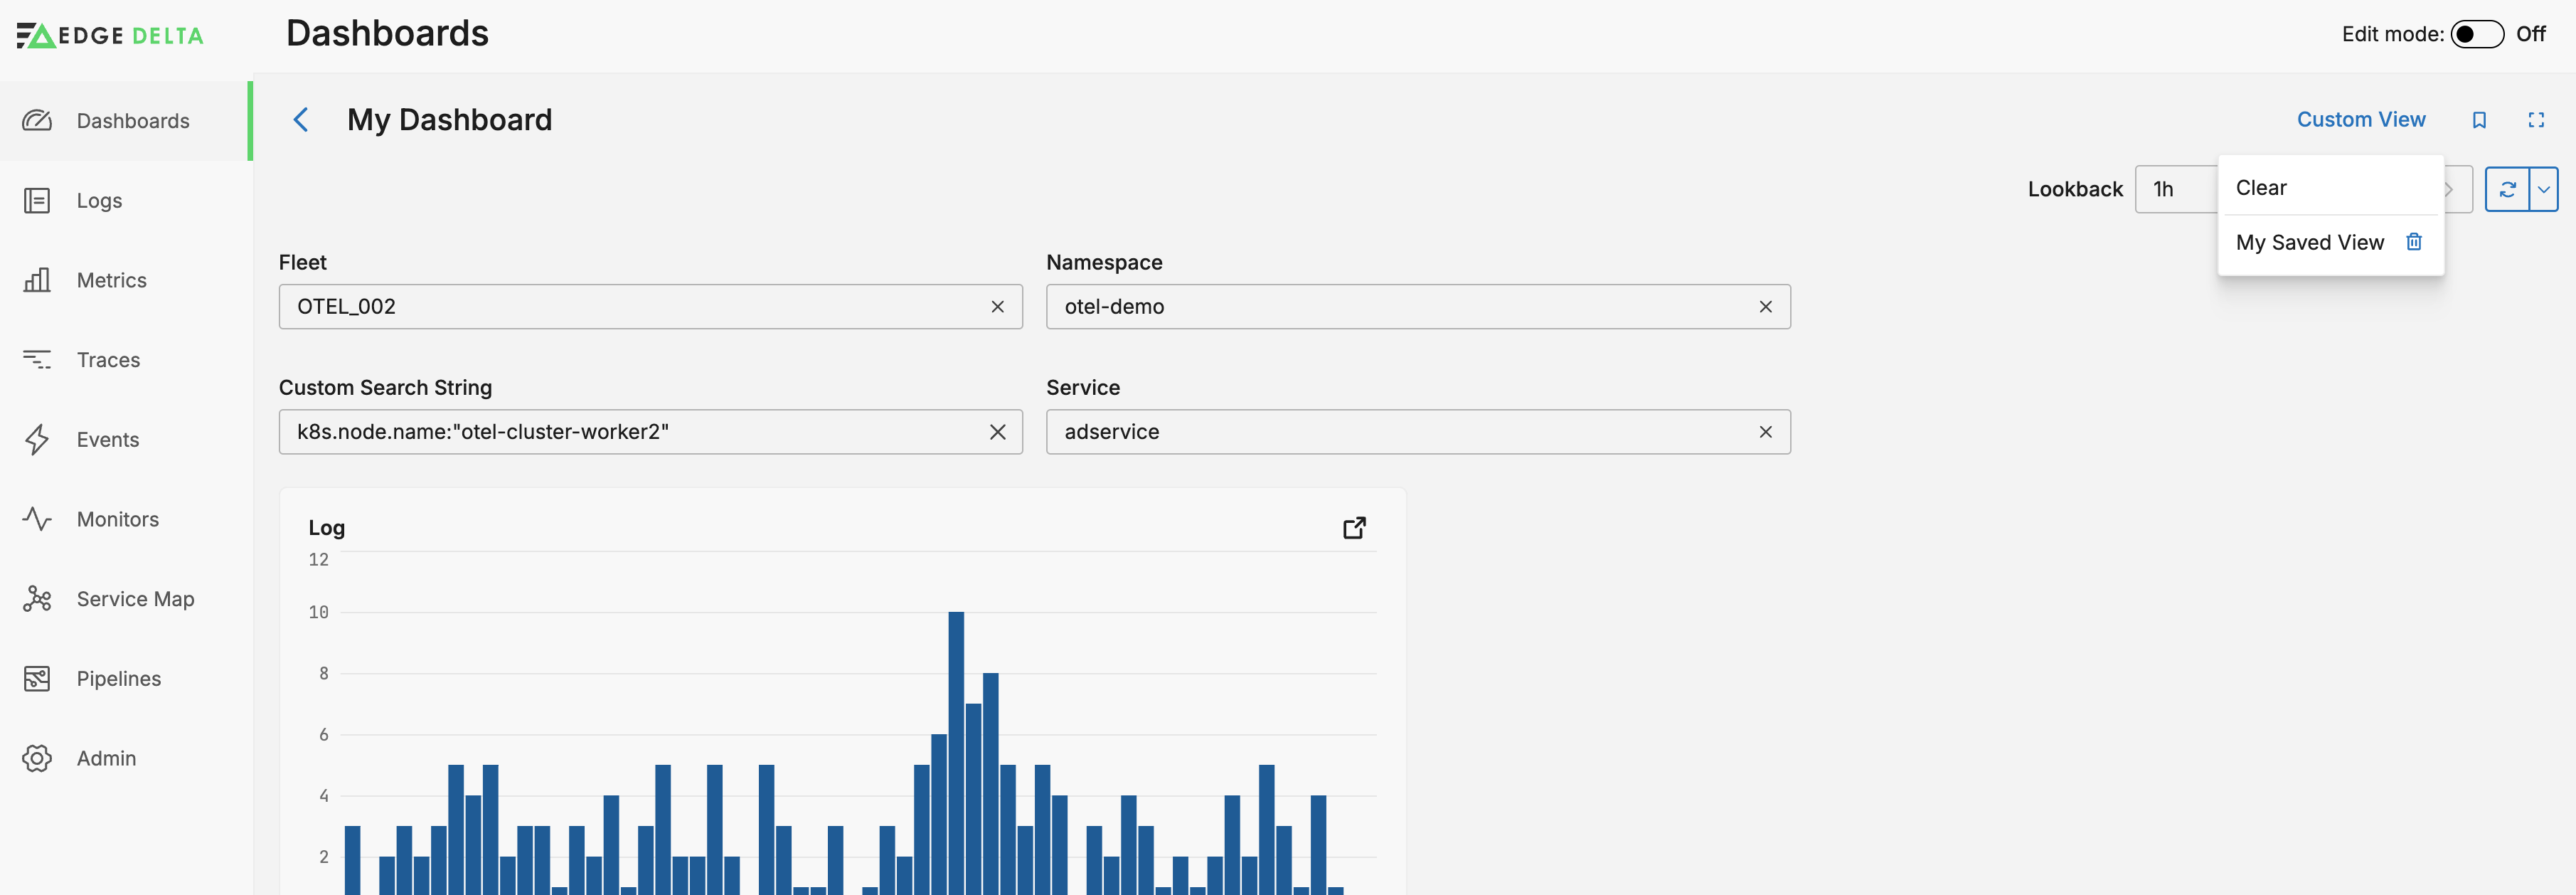
Save View
You can select variables on the dashboard to pivot the data that is shown. For example, you can a specific Cluster and Namespace on the K8s Overview dashboard. You can save a variable selection as a view. This is useful for monitoring an ongoing issue that requires a specific set of variables configured in the dashboard.

Enter a name for the view and click Save.

Rather than selecting each variable each time the dashboard is opened, click Custom view and select your saved view.
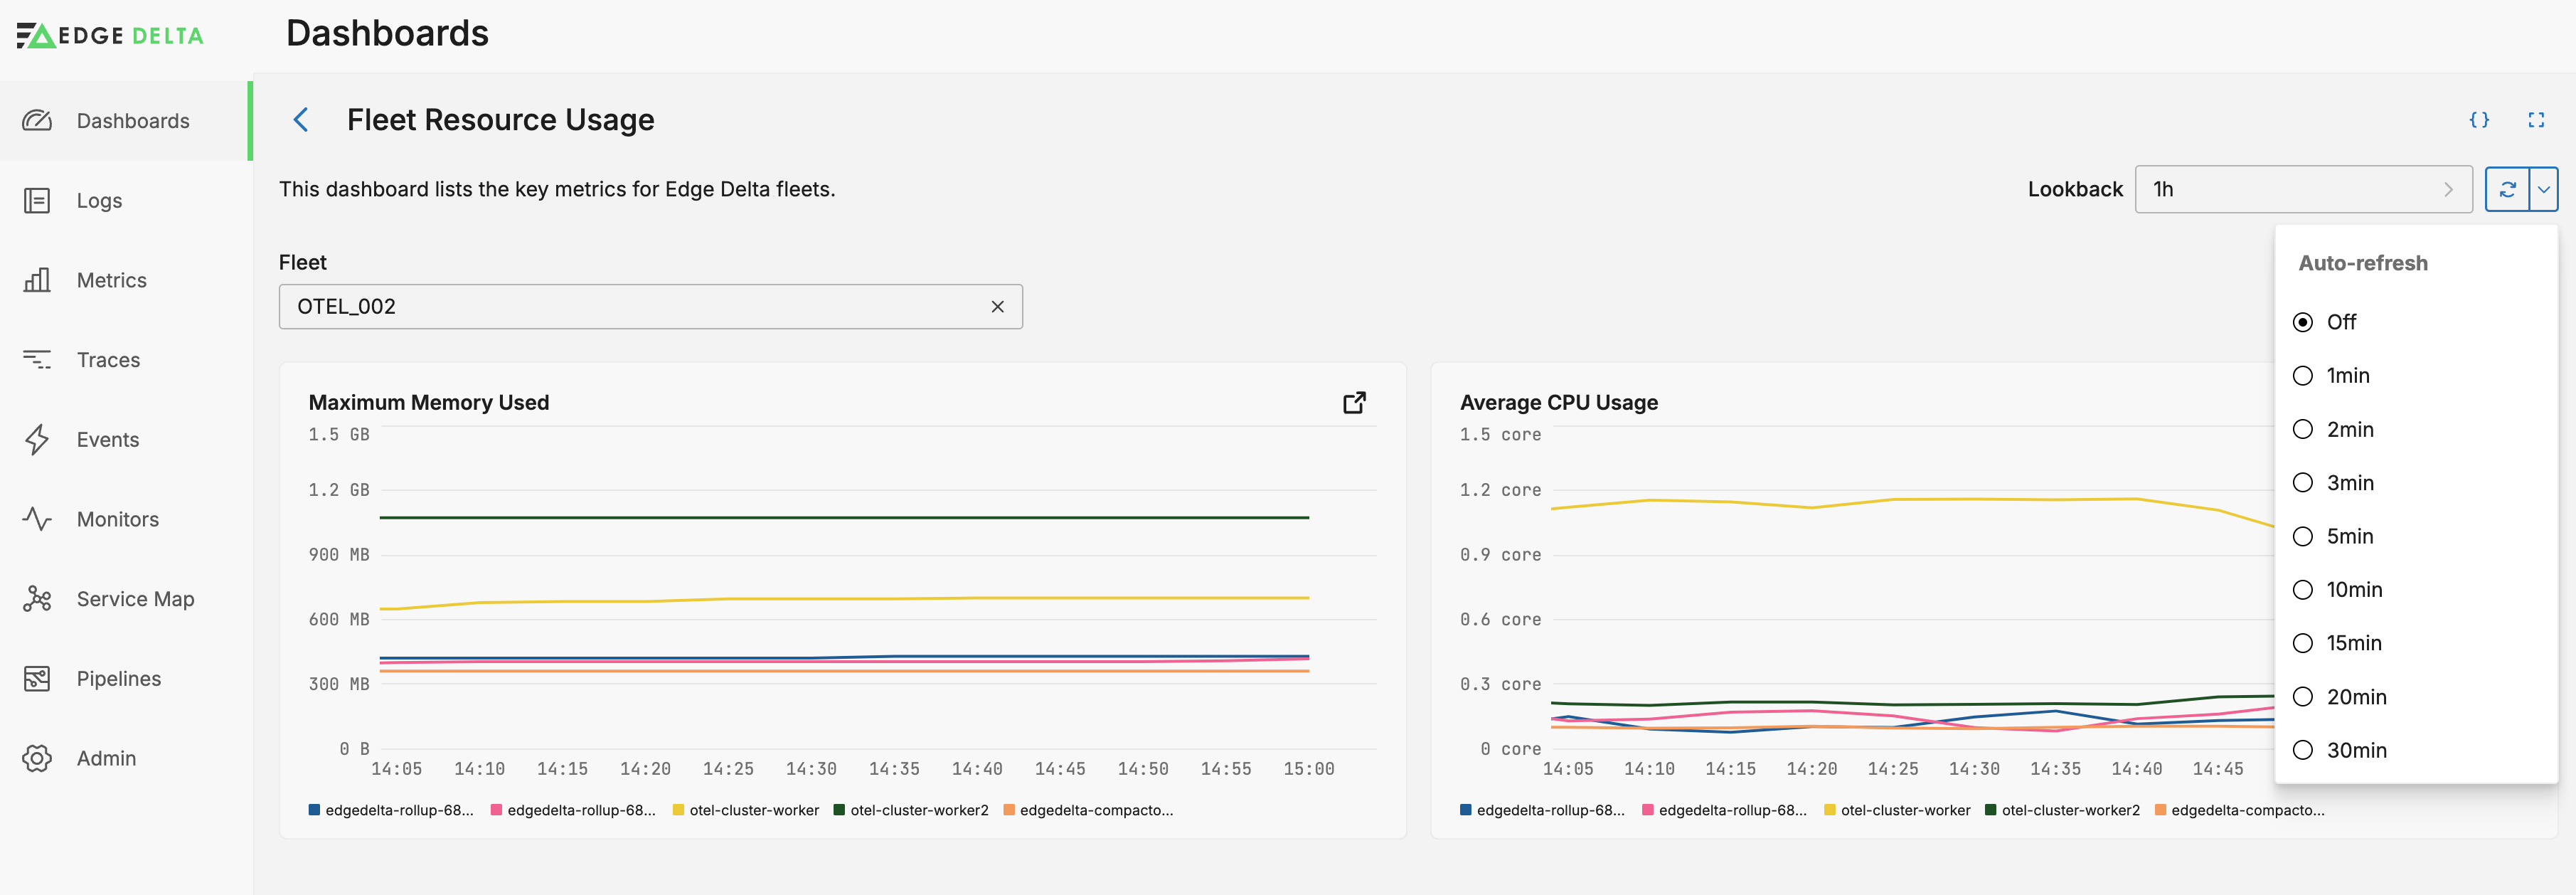
Refresh the Dashboard
You can set the interval at which the dashboard will refresh automatically, and you can click Refresh to manually refresh it.
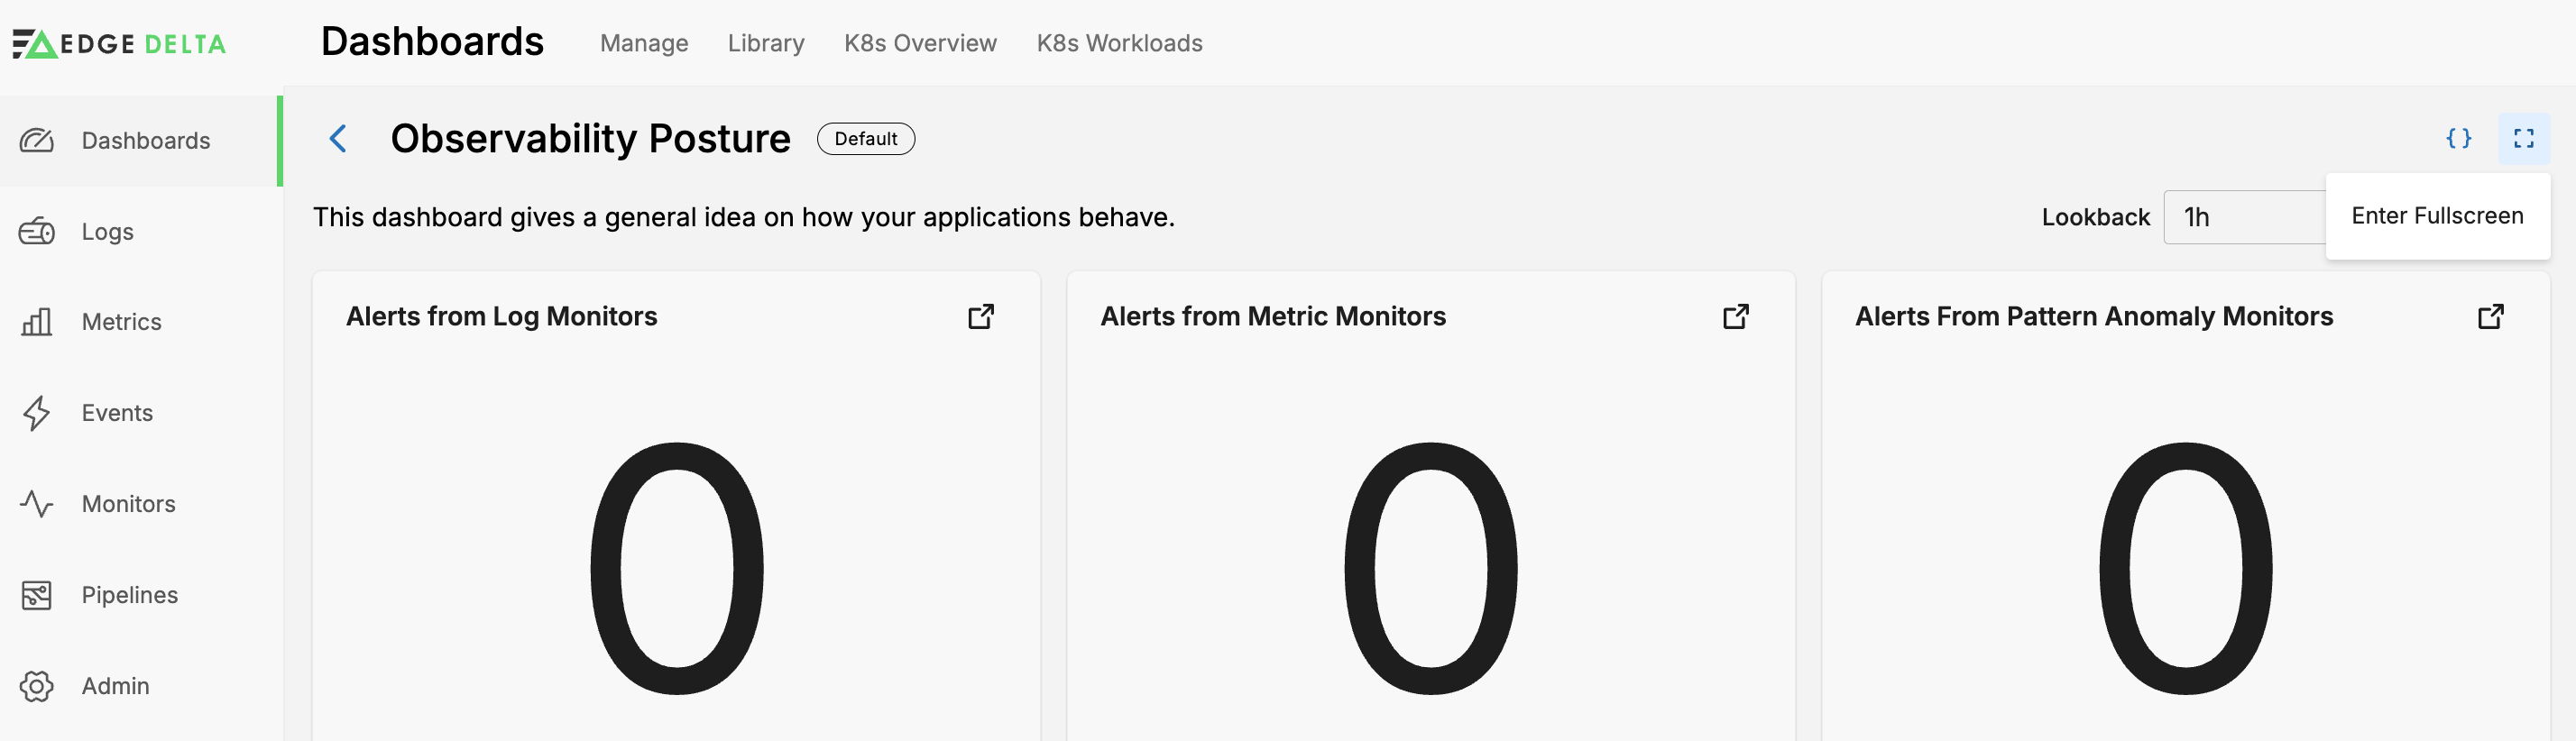
Full Screen Mode
Click Enter Fullscreen to view the live dashboard in full-screen mode.
Create a Dashboard
See Create a Dashboard.
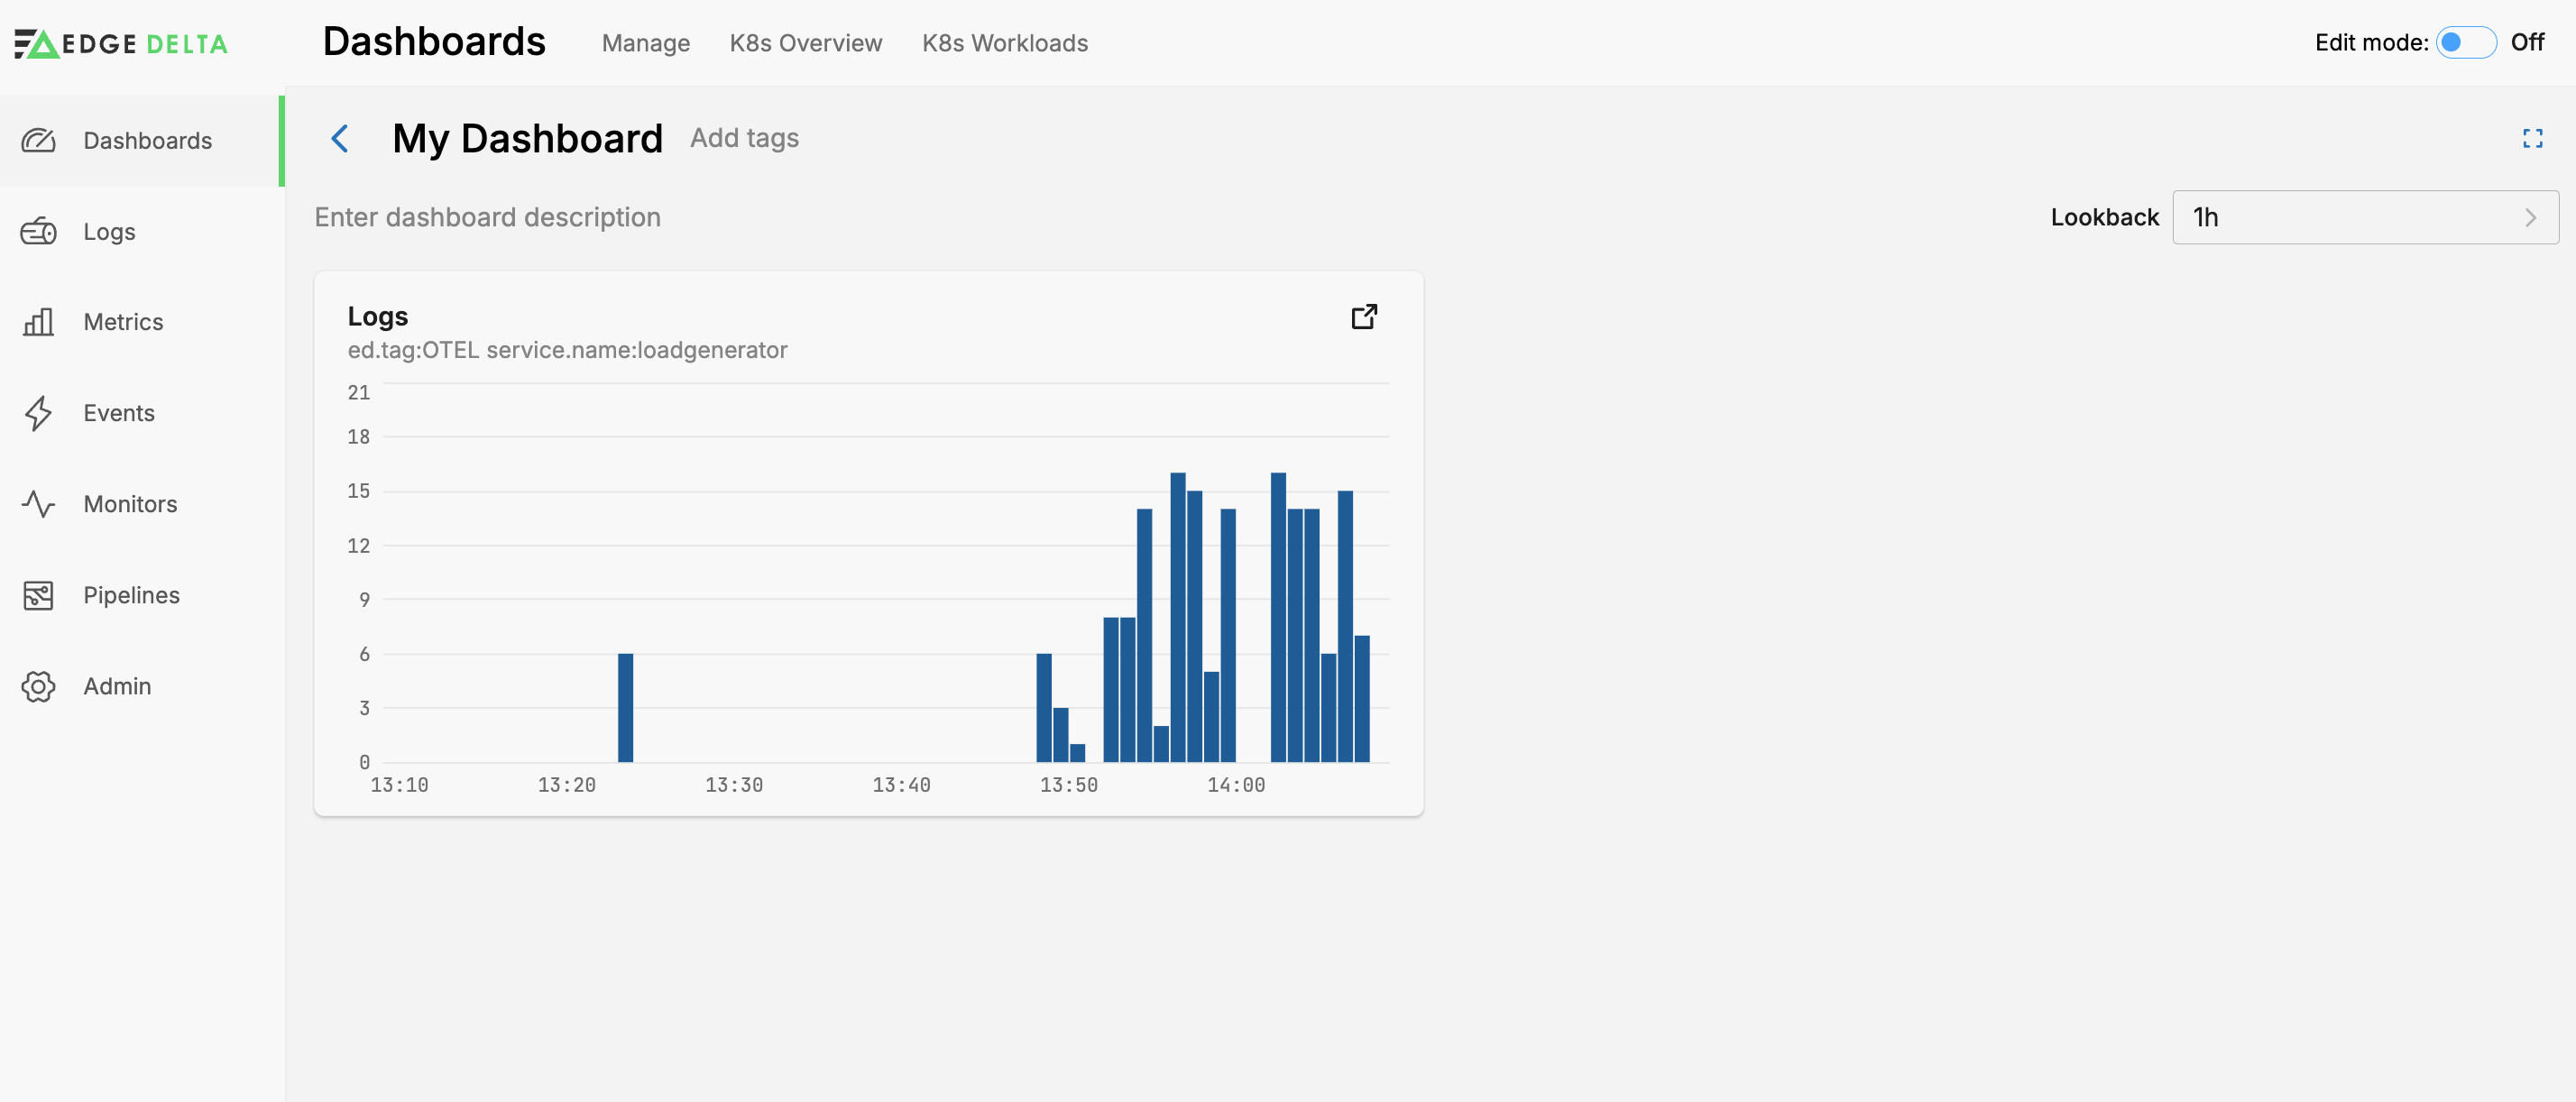
Edit a Dashboard
To edit an existing dashboard, select it and switch the Edit Mode toggle:
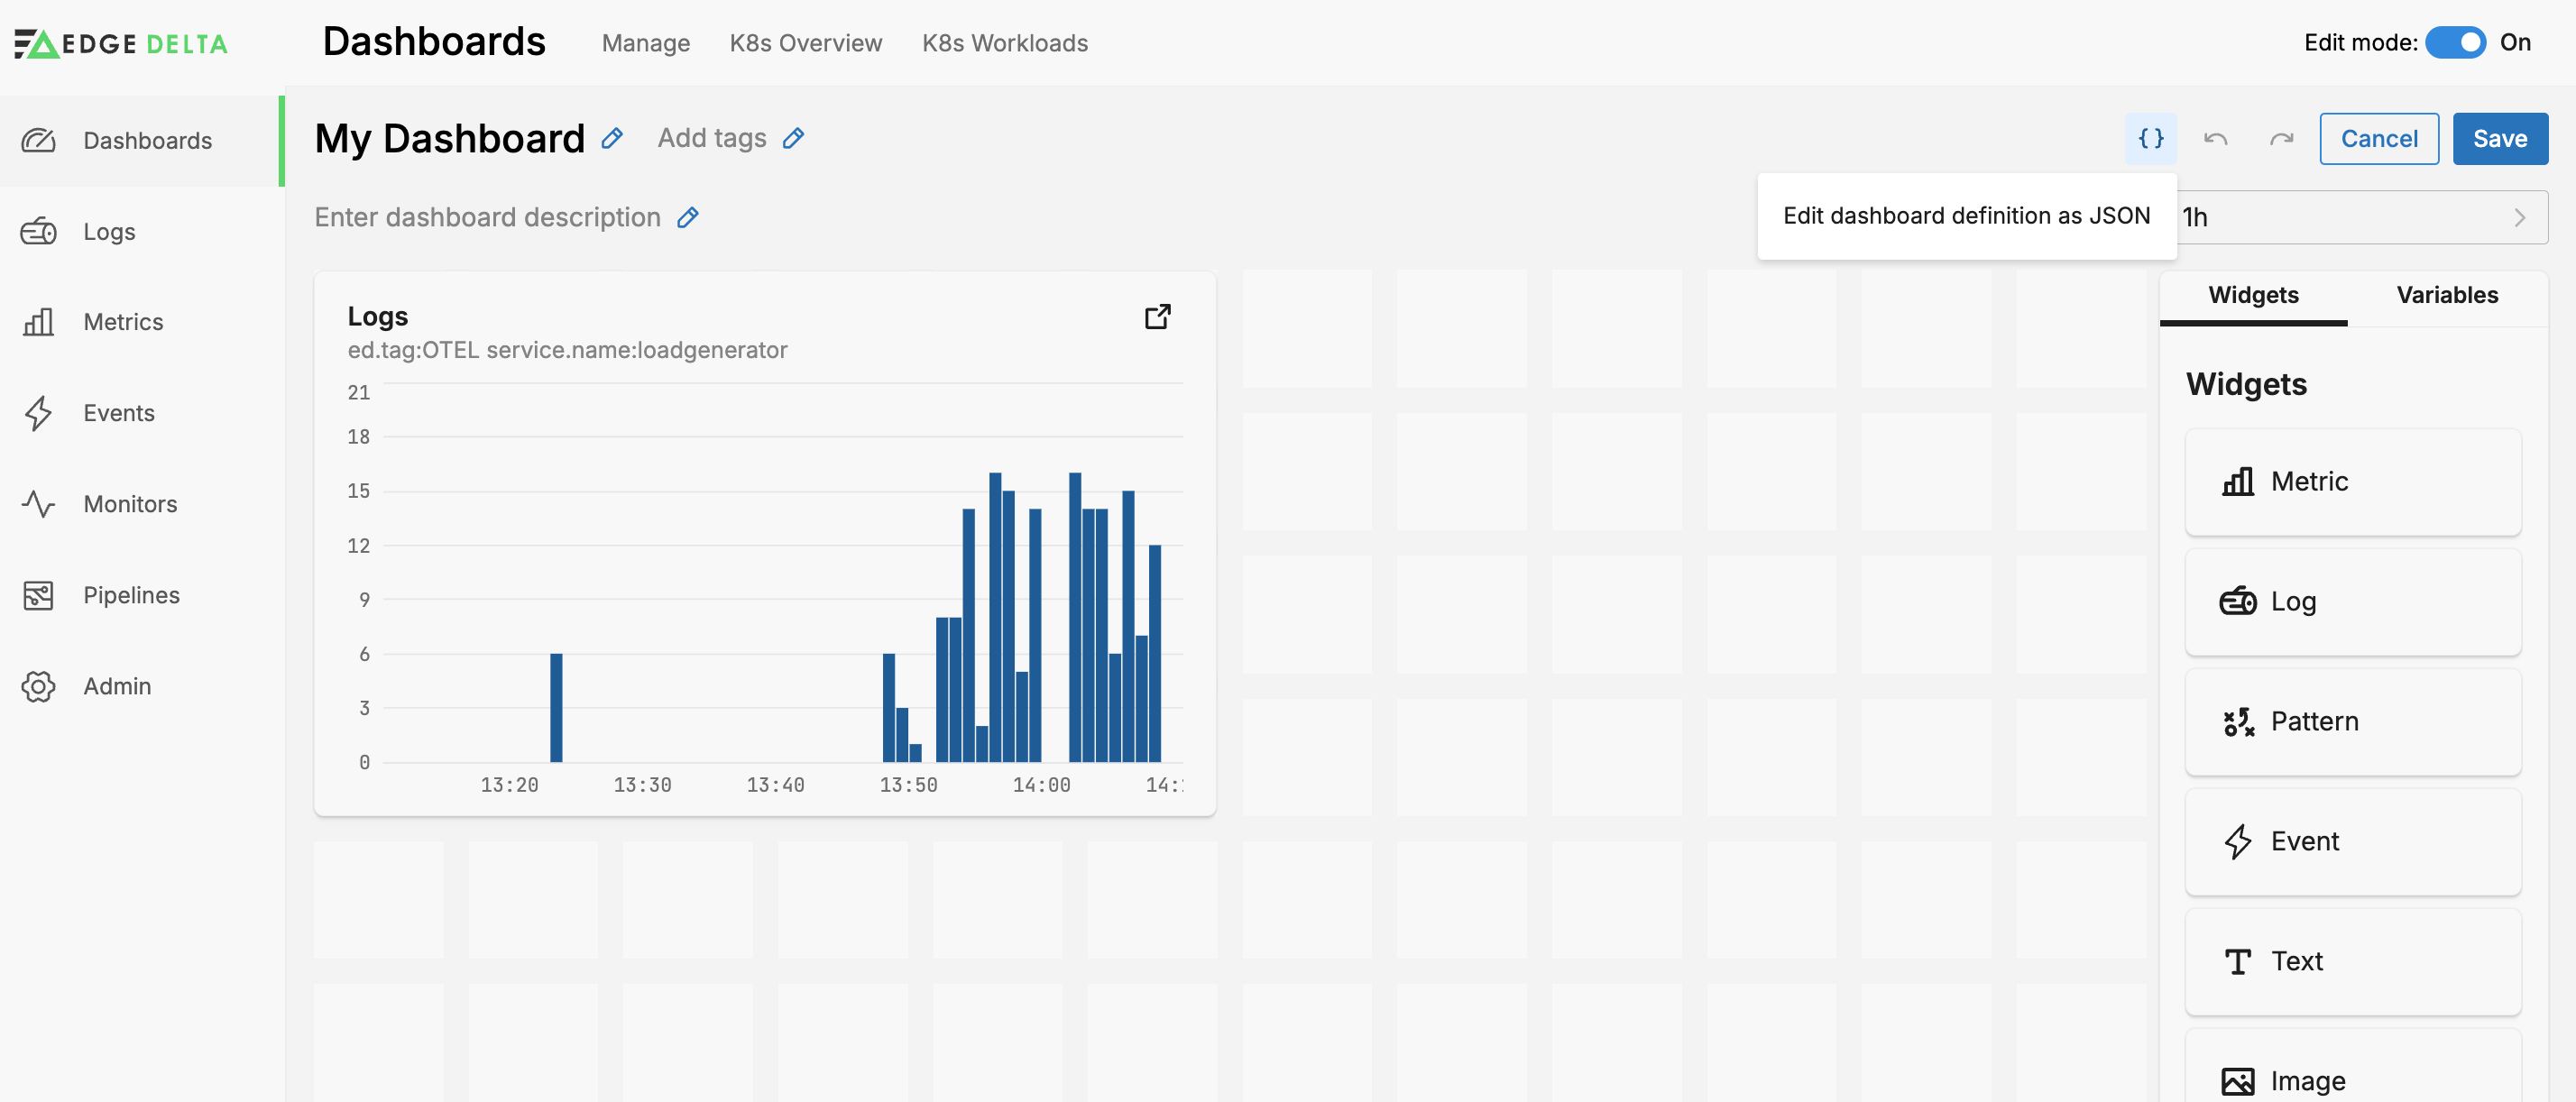
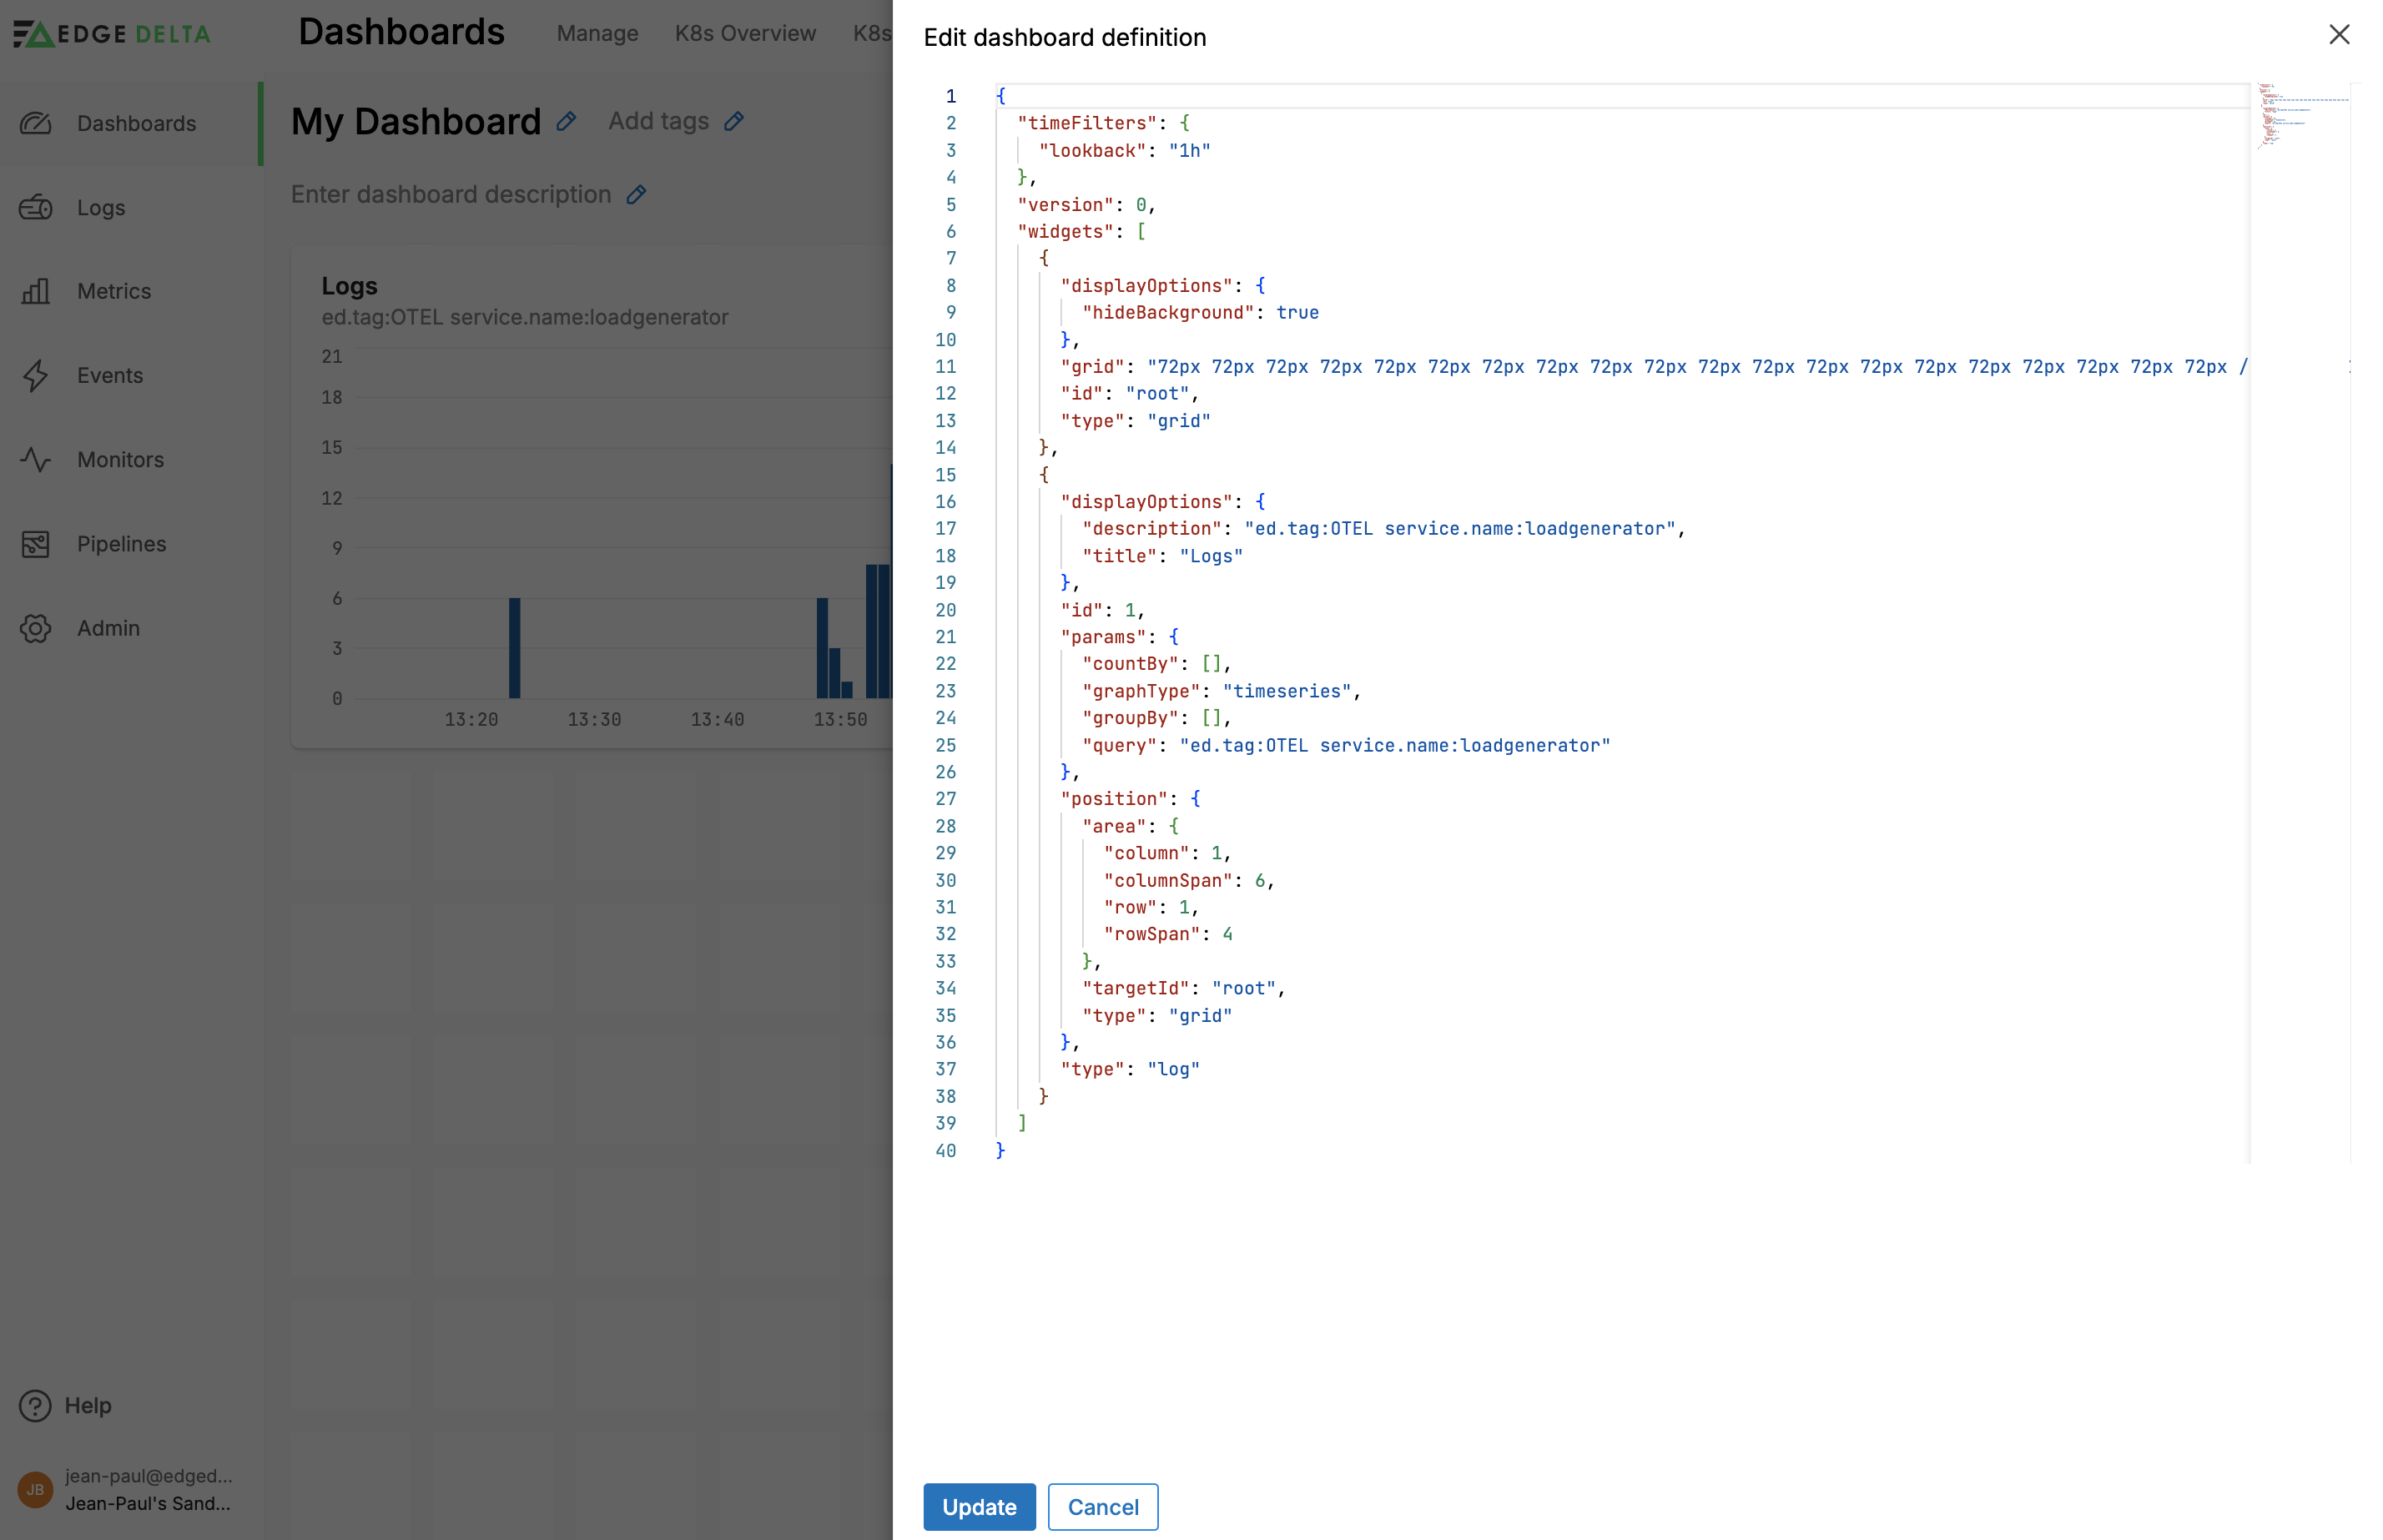
Edit Dashboard Definition as JSON
You can view a Dashboard’s JSON definition. With Edit Mode active, click the Edit dashboard definition as JSON button.
You can tweak the JSON, or copy/paste the JSON to share a dashboard definition.
Share Dashboard
Dashboards can be shared with users who don’t have Edge Delta accounts. This enables you to publish a dashboard on a device such as a TV screen, large monitor or NUC display in a common SRE office area without creating an account for that device.
See Share a Dashboard.