Monitors
Monitors in the Edge Delta back end trigger notifications based on event thresholds and provide status management across all pipelines.
7 minute read
Overview
Edge Delta provides two complementary approaches to threshold-based alerting:
| Approach | Location | Scope | Use Case |
|---|---|---|---|
| Pipeline Triggers | Edge (within pipelines) | Single pipeline | Low-latency alerts for pipeline-specific conditions |
| Monitors | Centralized back end | All pipelines | Cross-pipeline correlation and aggregated thresholds |
This page covers Monitors, which are centralized back-end components. For edge-based alerting within individual pipelines, see Pipeline Triggers.
Monitors vs Pipeline Triggers
The following diagram illustrates how both alerting approaches work together:
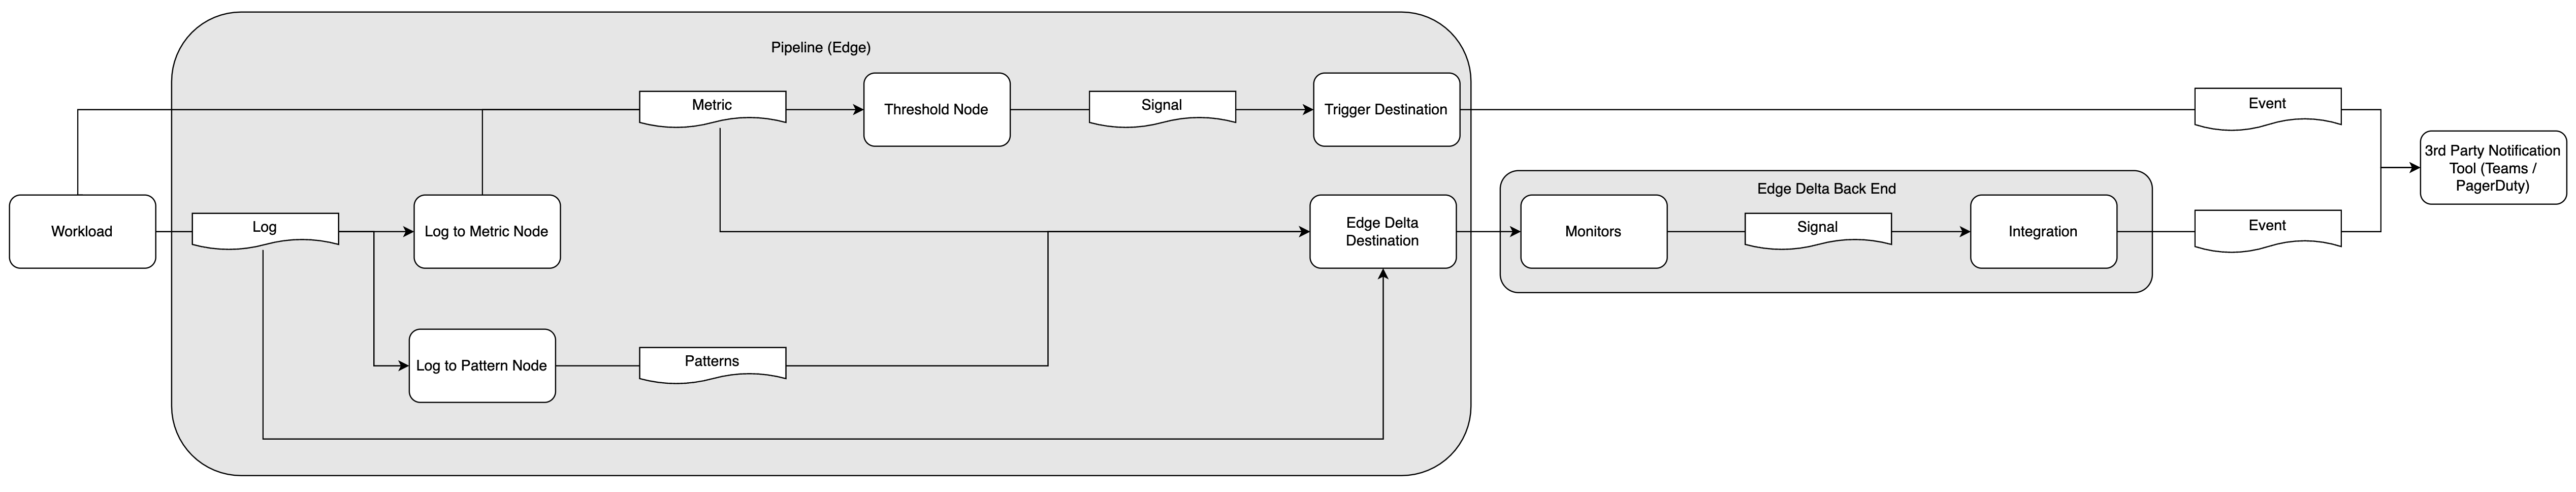
A workload generates logs and metrics. Data flows through the pipeline where it can take two paths:
Edge path (Pipeline Triggers): Metrics flow to a threshold node within the pipeline. If conditions are met, a signal is sent directly to a trigger destination (webhook, Slack, etc.). These alerts are specific to that single pipeline and provide the lowest latency response.
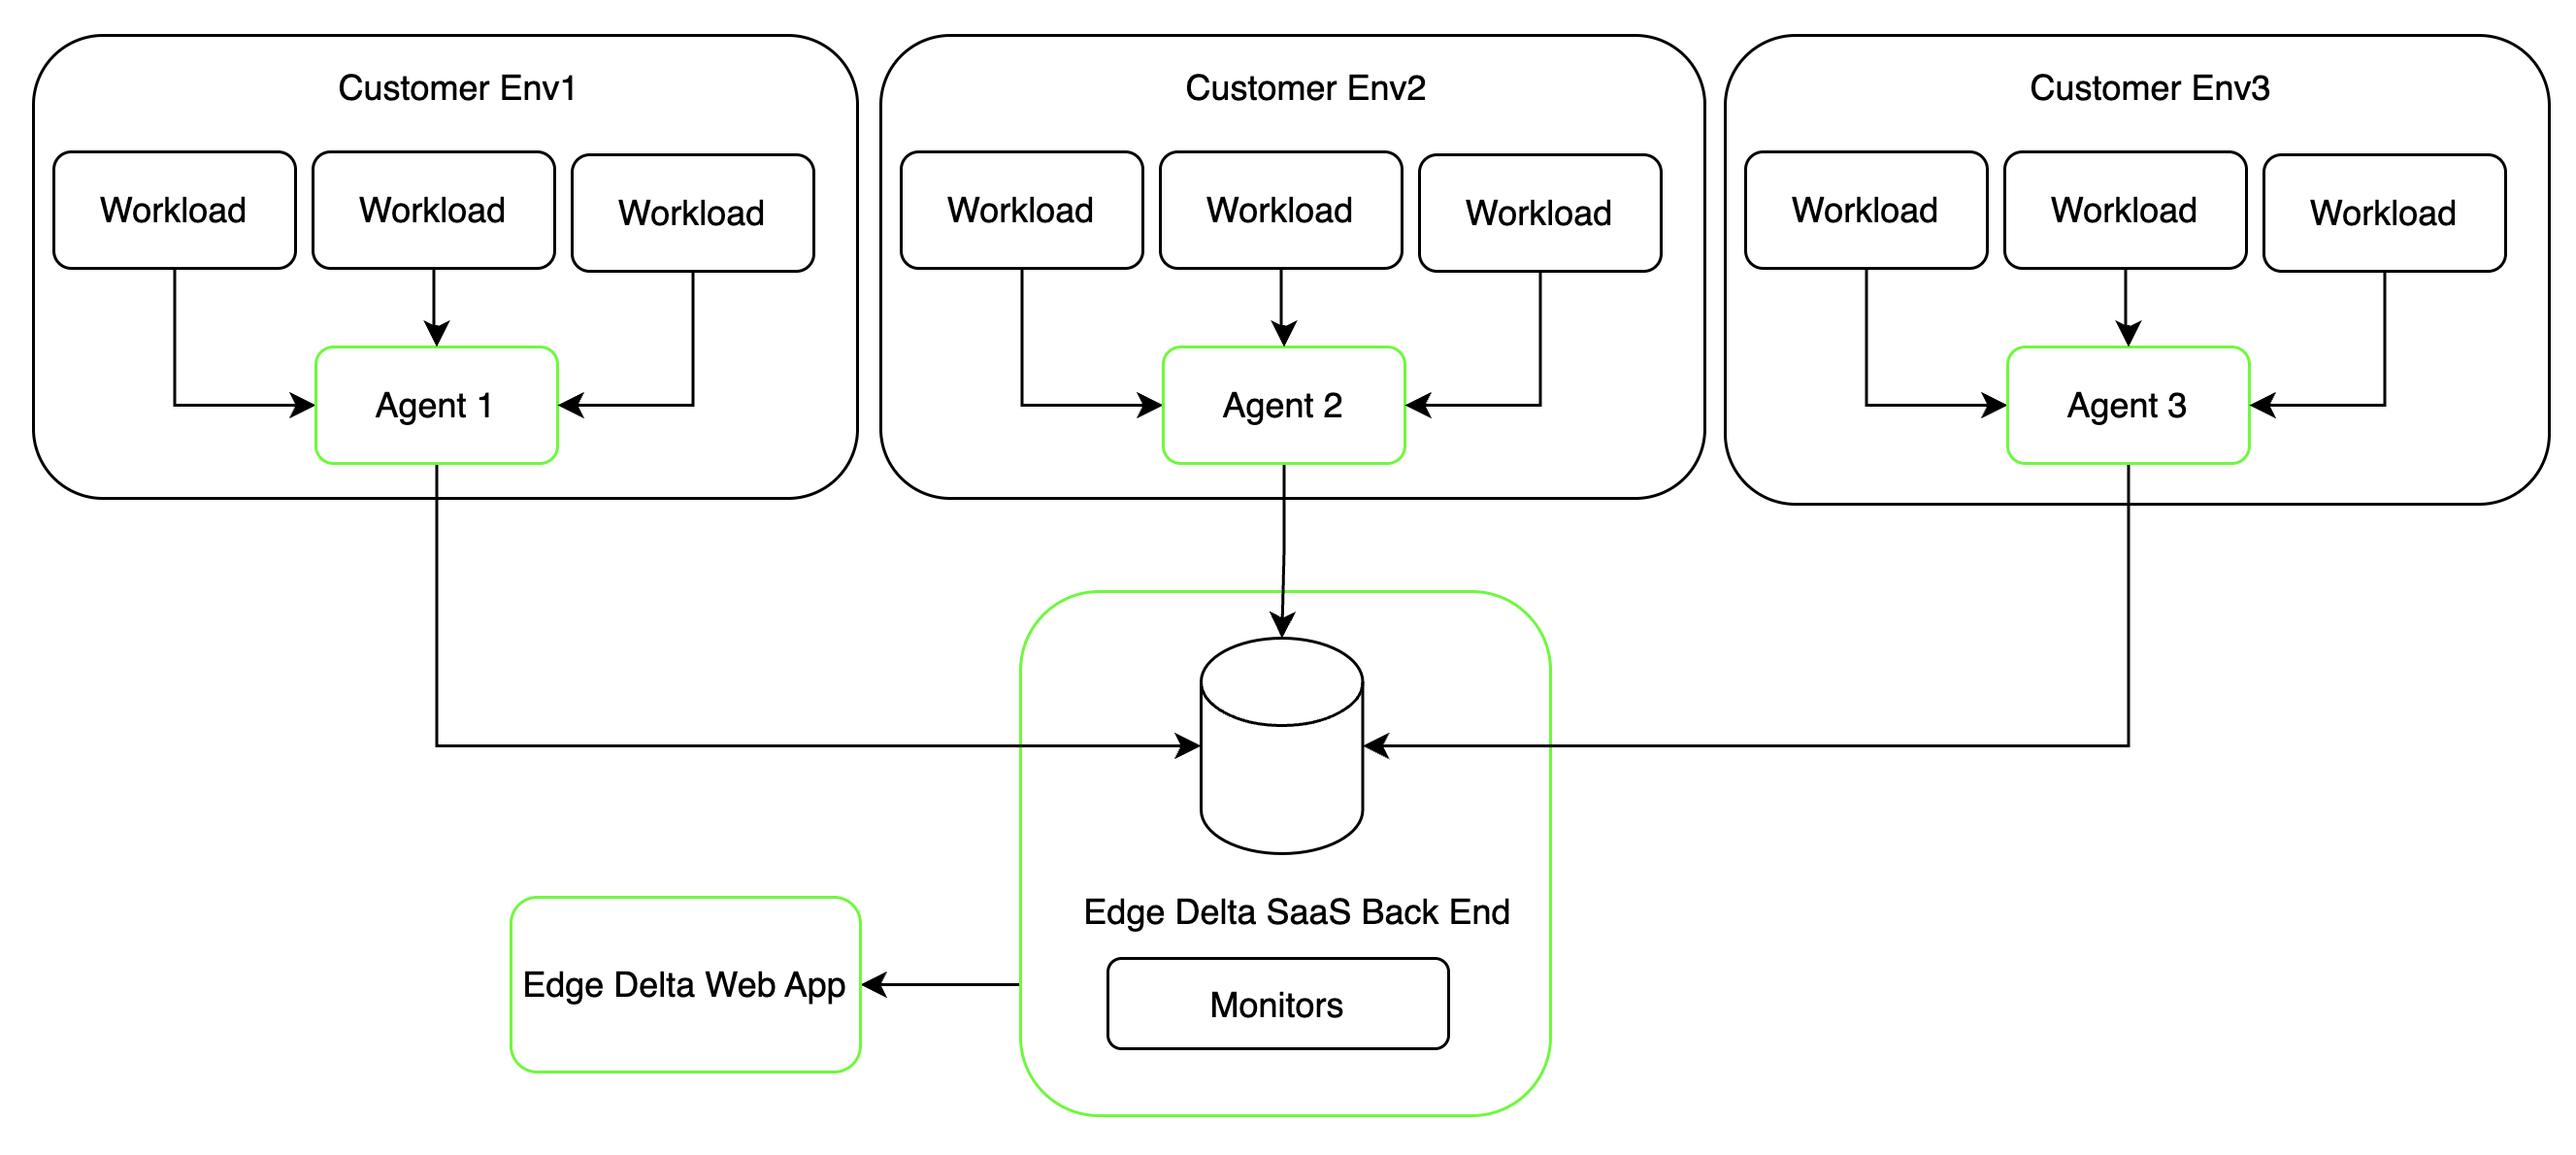
Central path (Monitors): Data flows to the Edge Delta Destination, which archives logs, metrics, and patterns in the Edge Delta back end. Monitors then evaluate this aggregated data across all pipelines, enabling cross-pipeline correlation and organization-wide thresholds.
When to Use Monitors
Monitors are ideal when you need to:
- Aggregate across pipelines: Detect patterns that span multiple environments, clusters, or services
- Correlate cross-telemetry data: Combine metrics, logs, and patterns in a single evaluation
- Monitor agent health: Track downed agents, crash loops, or pipeline issues across your fleet
- Set organization-wide thresholds: Define alerts based on total error rates, combined throughput, or other aggregated metrics
Monitors generate signals that can be sent to third-party notification tools such as Teams, PagerDuty, Slack, or Dynatrace. Unlike pipeline triggers, these alerts may represent conditions across multiple pipelines rather than a single source.
See Quickstart: Create a Monitor for a quickstart guide to creating a monitor.
AI-Powered Alert Analysis
Monitor notifications can be routed to AI Team channels for automated analysis. When a monitor enters WARN or ALERT state, AI teammates can immediately investigate the underlying telemetry data, correlate with related signals, and provide actionable insights.
Routing Alerts to AI Team
Configure monitor notifications to post to an AI Team channel (such as #alerts):
- In your monitor configuration, add a Slack notification targeting your AI Team channel
- Ensure the channel includes specialized teammates with appropriate connectors (e.g., SRE with Edge Delta MCP access)
- When the monitor triggers, OnCall AI creates a thread and coordinates the investigation
What AI Teammates Provide
When responding to monitor alerts, AI teammates can:
- Correlate signals: Compare the triggered metric with related logs, other metrics, and recent patterns
- Identify root causes: Analyze telemetry to generate hypotheses about why the threshold was breached
- Provide context: Surface recent deployments, configuration changes, or similar historical incidents
- Recommend actions: Suggest remediation steps based on the analysis
This transforms raw threshold notifications into context-rich investigations, reducing the time engineers spend gathering initial evidence.
For proactive monitoring, you can also create workflows with a Periodic Run trigger to have AI teammates review monitor states at regular intervals, identifying emerging issues before they escalate.
Preparing Data for Cross-Telemetry Monitoring
Effective monitoring across multiple telemetry types requires proper data preparation in your Telemetry Pipelines. Structure and enrich your data to enable correlation and context-aware alerting.
Add Context with Tags
Use the Add Field processor to enrich telemetry with contextual tags. Apply tags selectively based on data relevance to enable precise filtering and correlation:
- type: ottl_transform
  metadata: '{"type":"add-field","name":"Add Environment Tag"}'
  condition: resource["k8s.namespace.name"] == "production"
  statements: set(attributes["environment"], "prod")
Tags create common dimensions across logs, metrics, and traces, enabling monitors to correlate events from different sources.
Extract Metrics from Logs
Convert log-embedded values into time-series metrics using the Extract Metric processor. For example, parse CPU utilization from system logs:
- type: extract_metric
  metadata: '{"name":"Extract CPU Metrics"}'
  extract_metric_rules:
  - name: system_cpu_usage
    description: CPU utilization from system logs
    unit: "%"
    gauge:
      value: Double(attributes["cpu_usage"])
    condition: attributes["log_type"] == "system"
Extracted metrics can be monitored alongside native metrics, providing unified visibility across all telemetry sources.
Monitor List
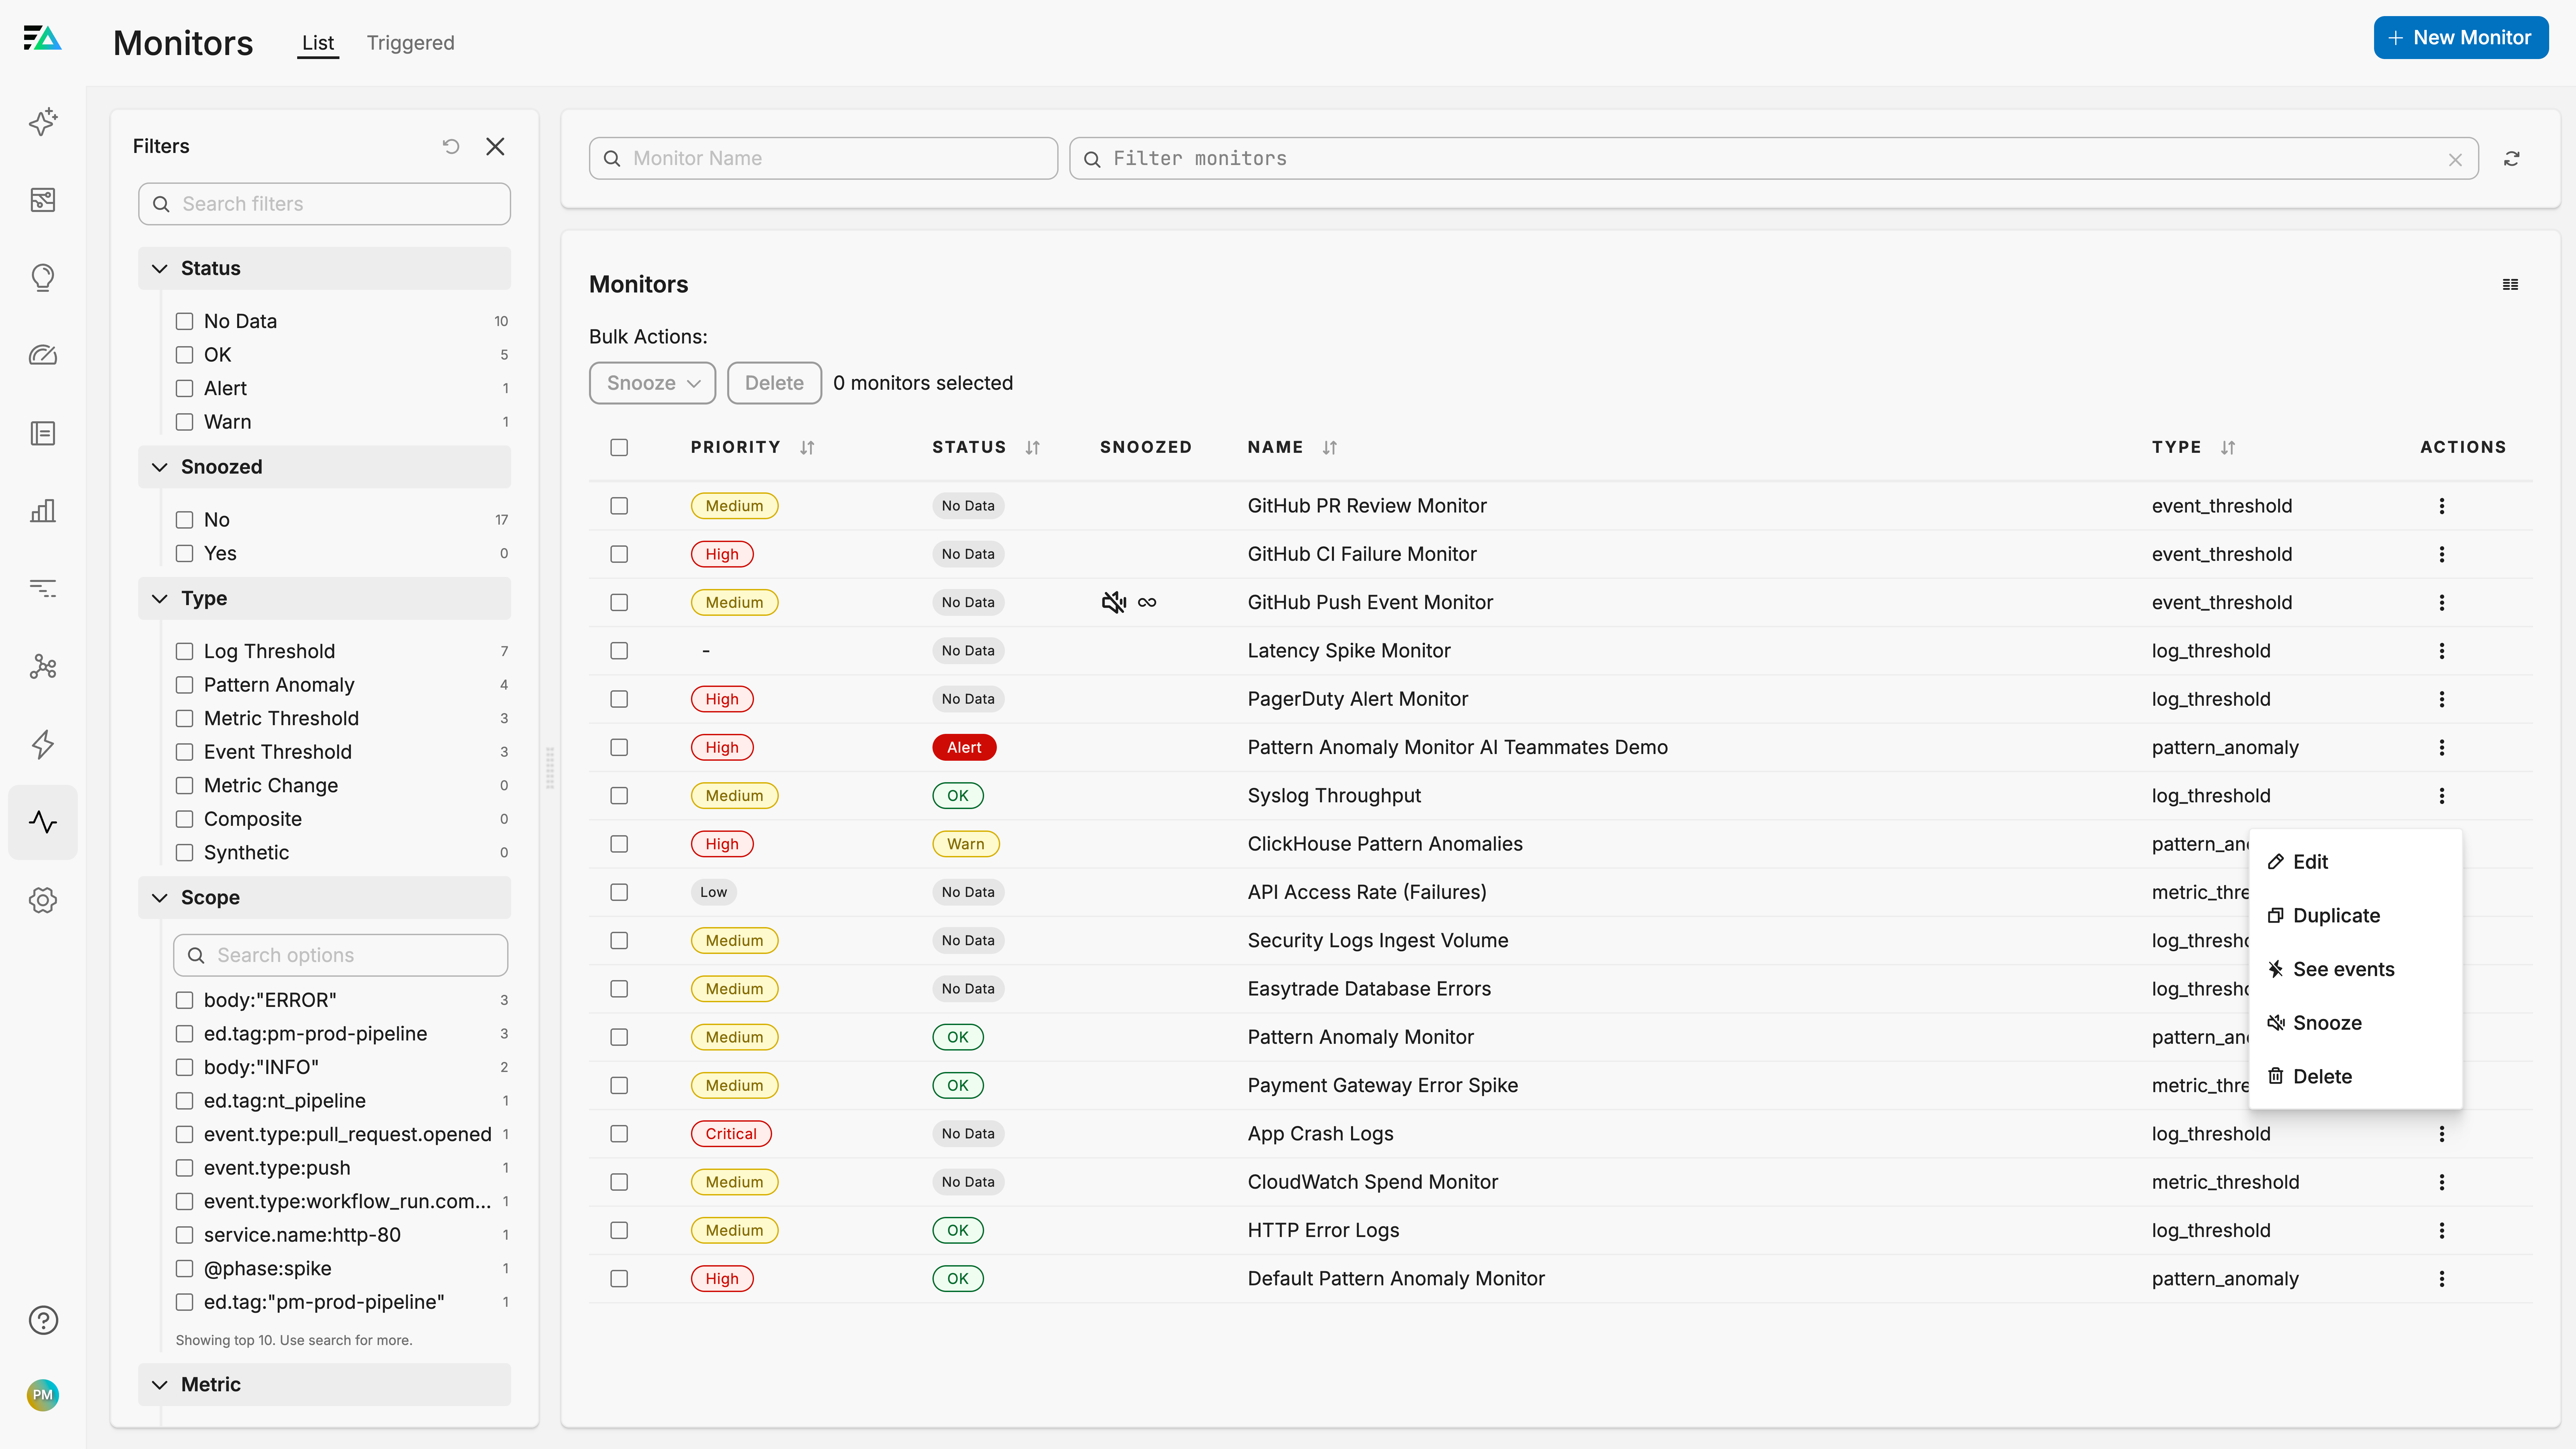
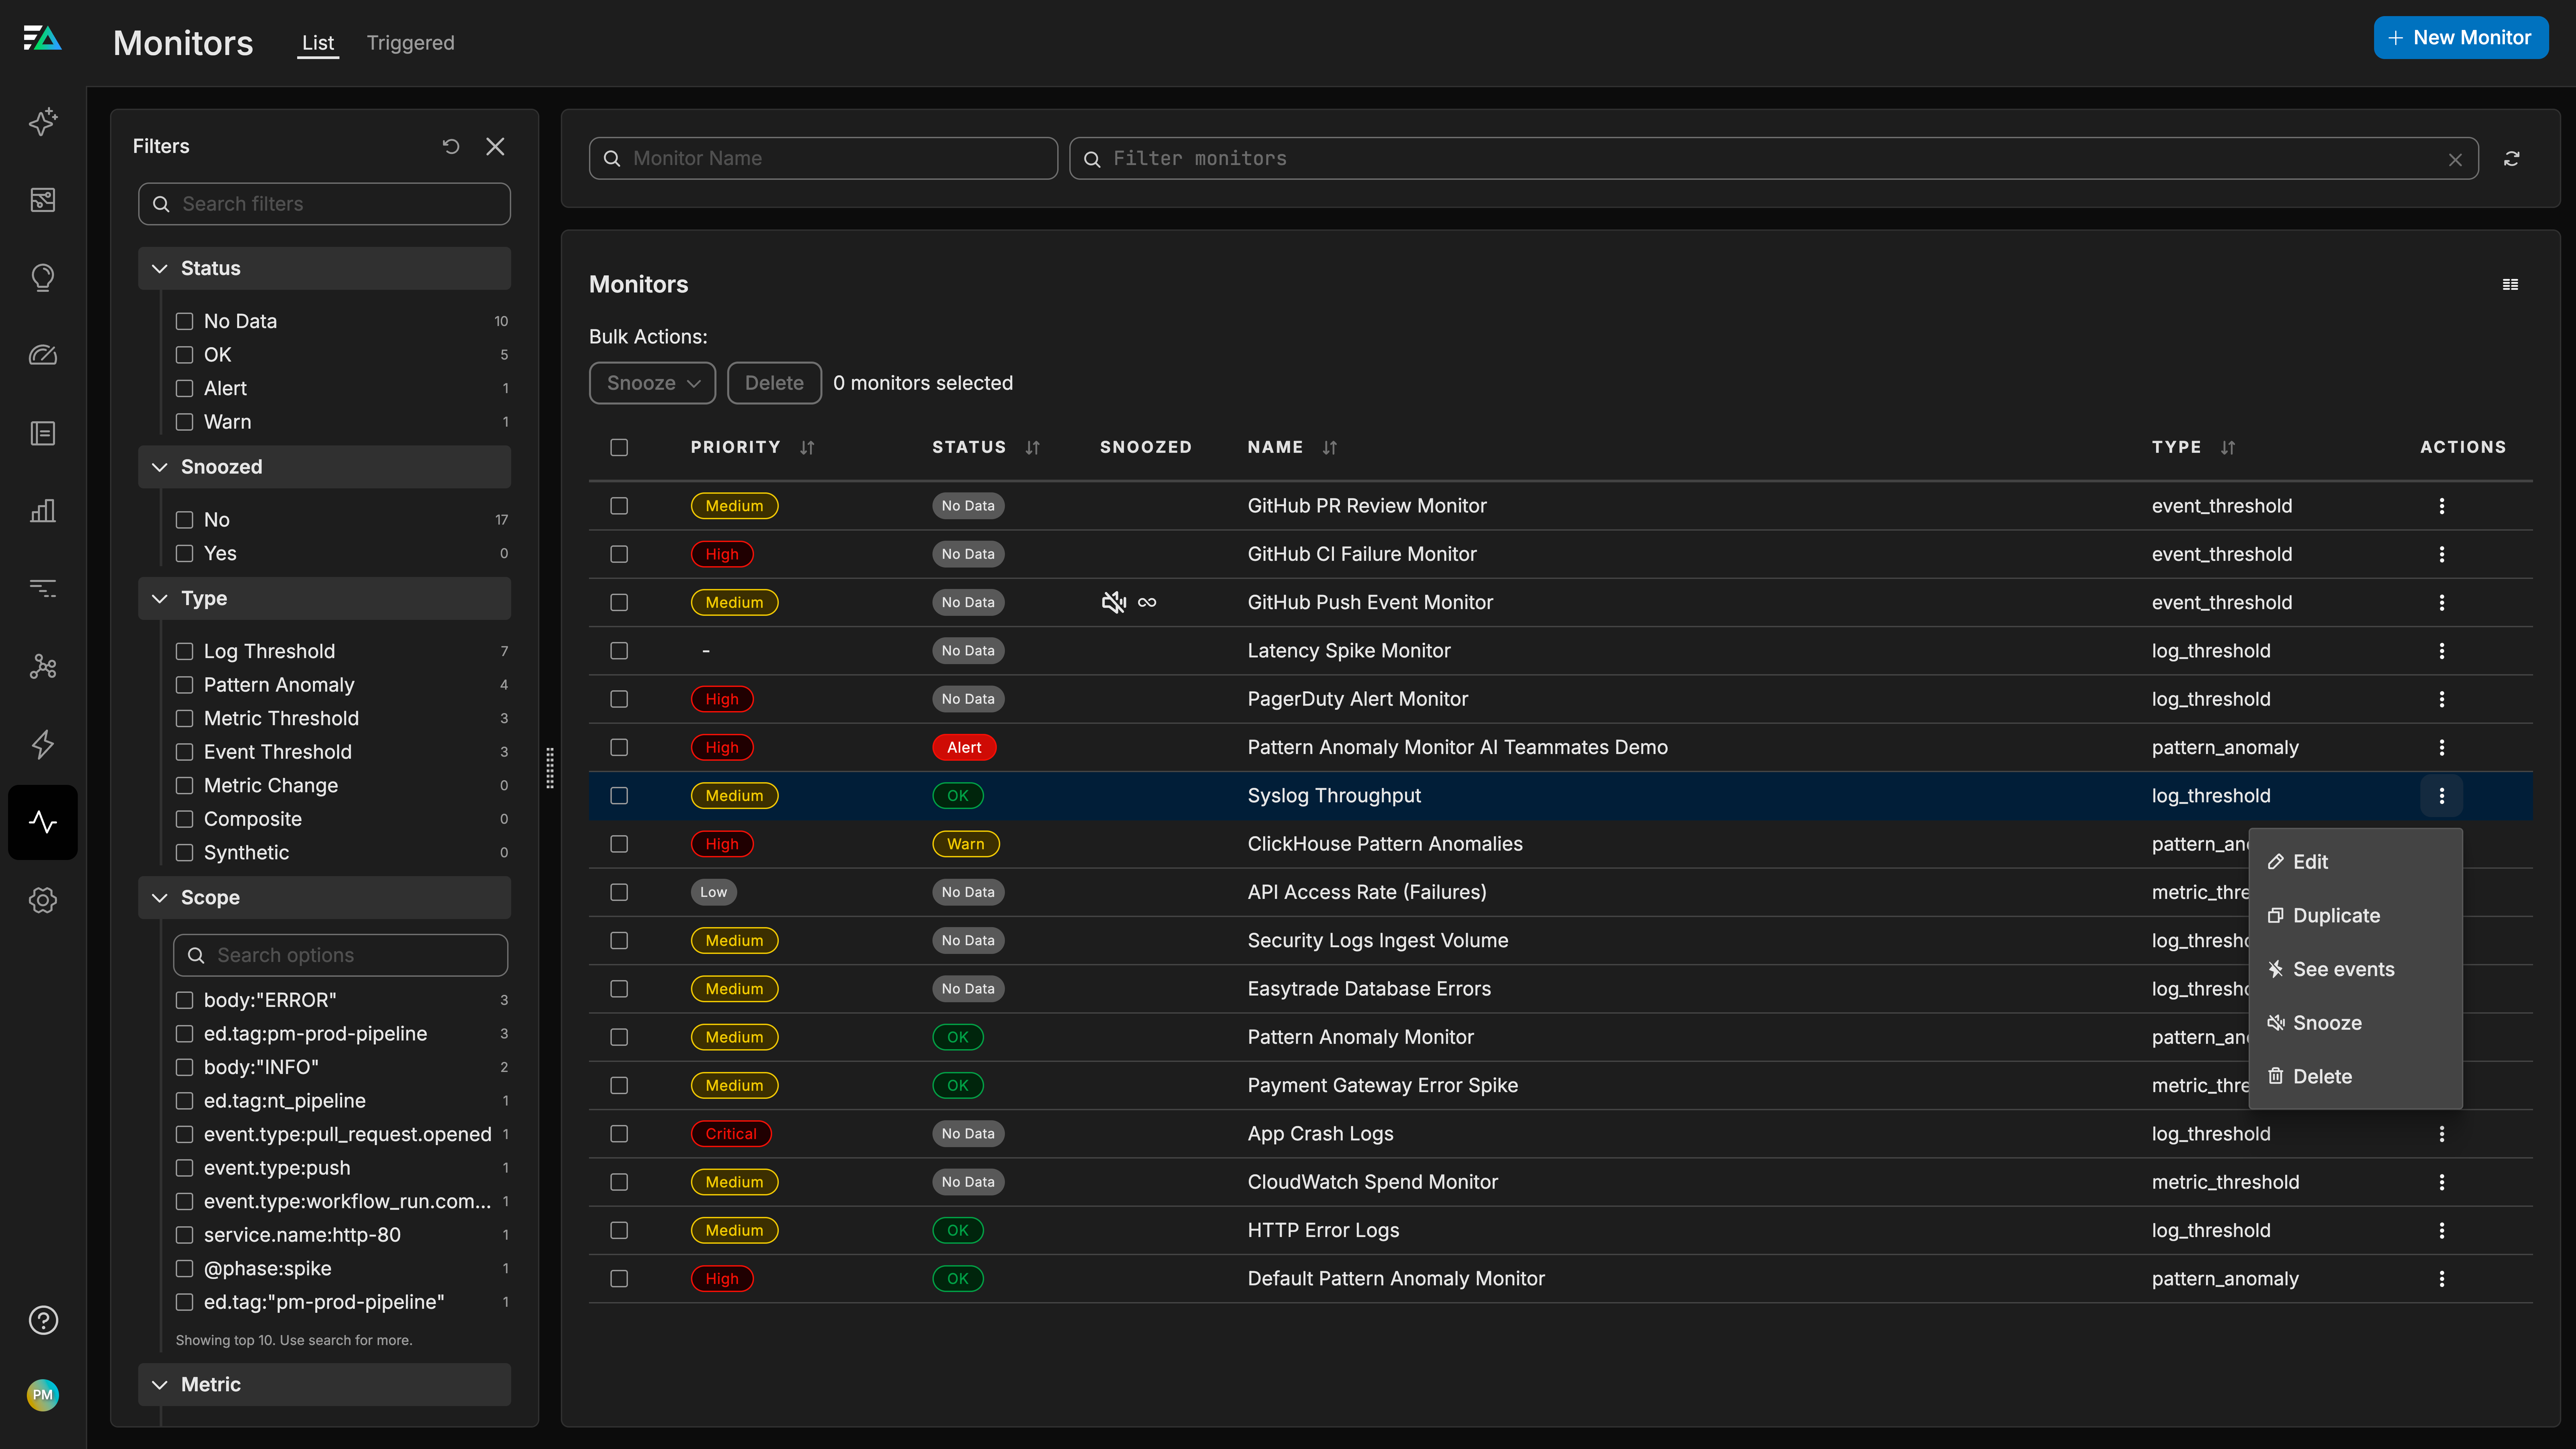
Click Monitors and select the List tab.
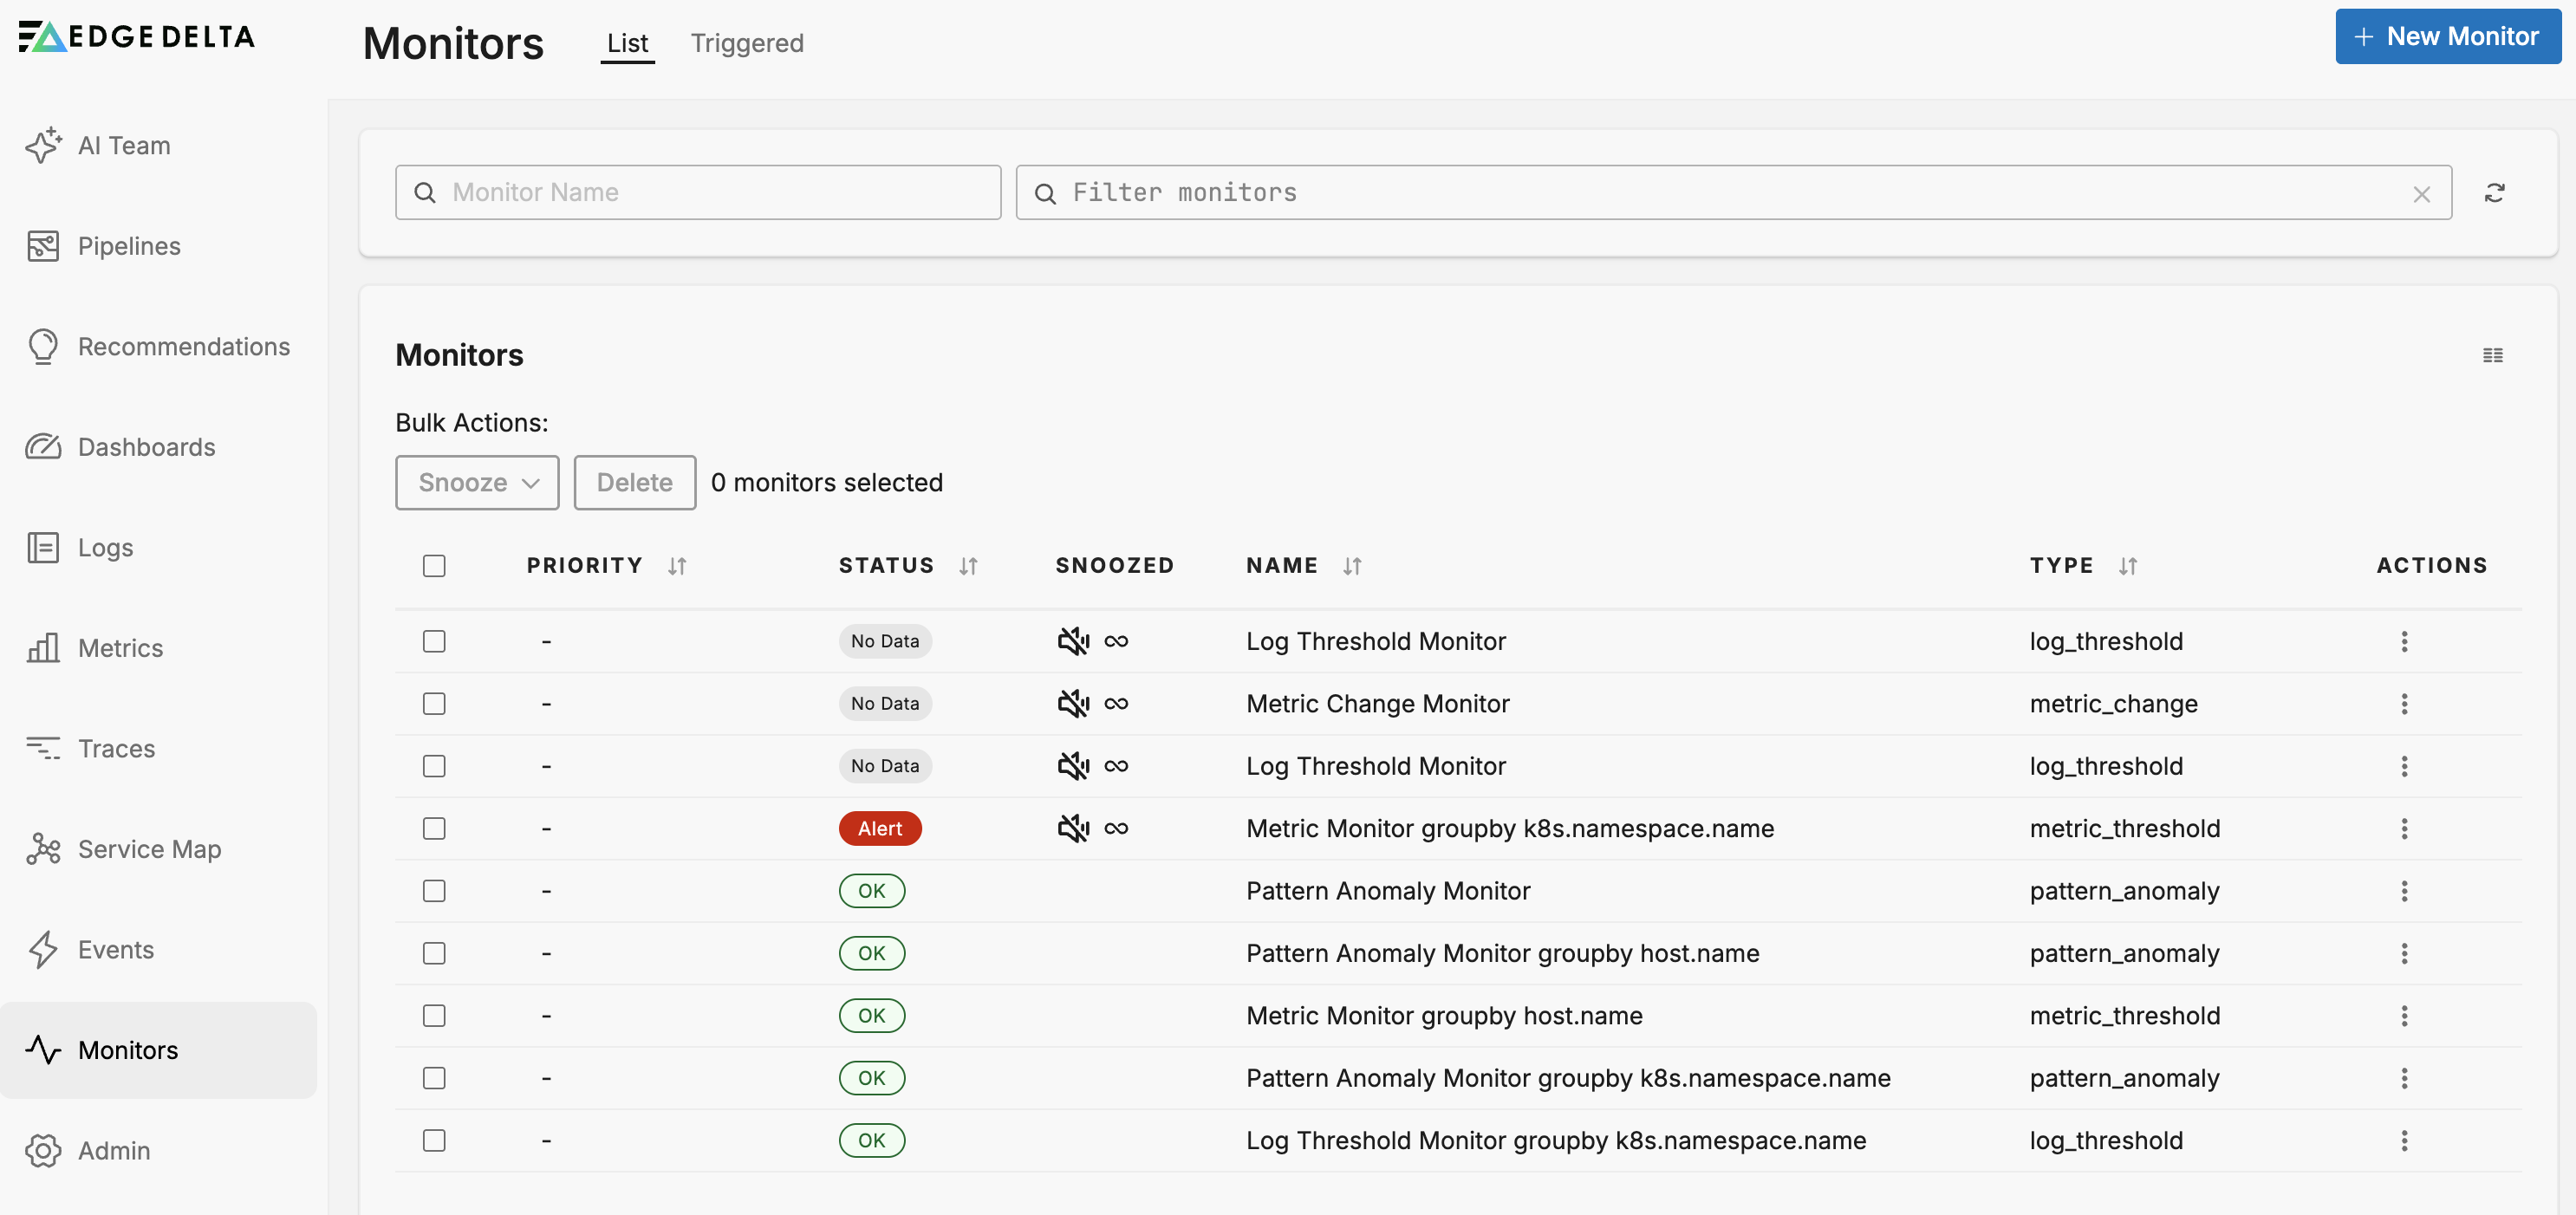
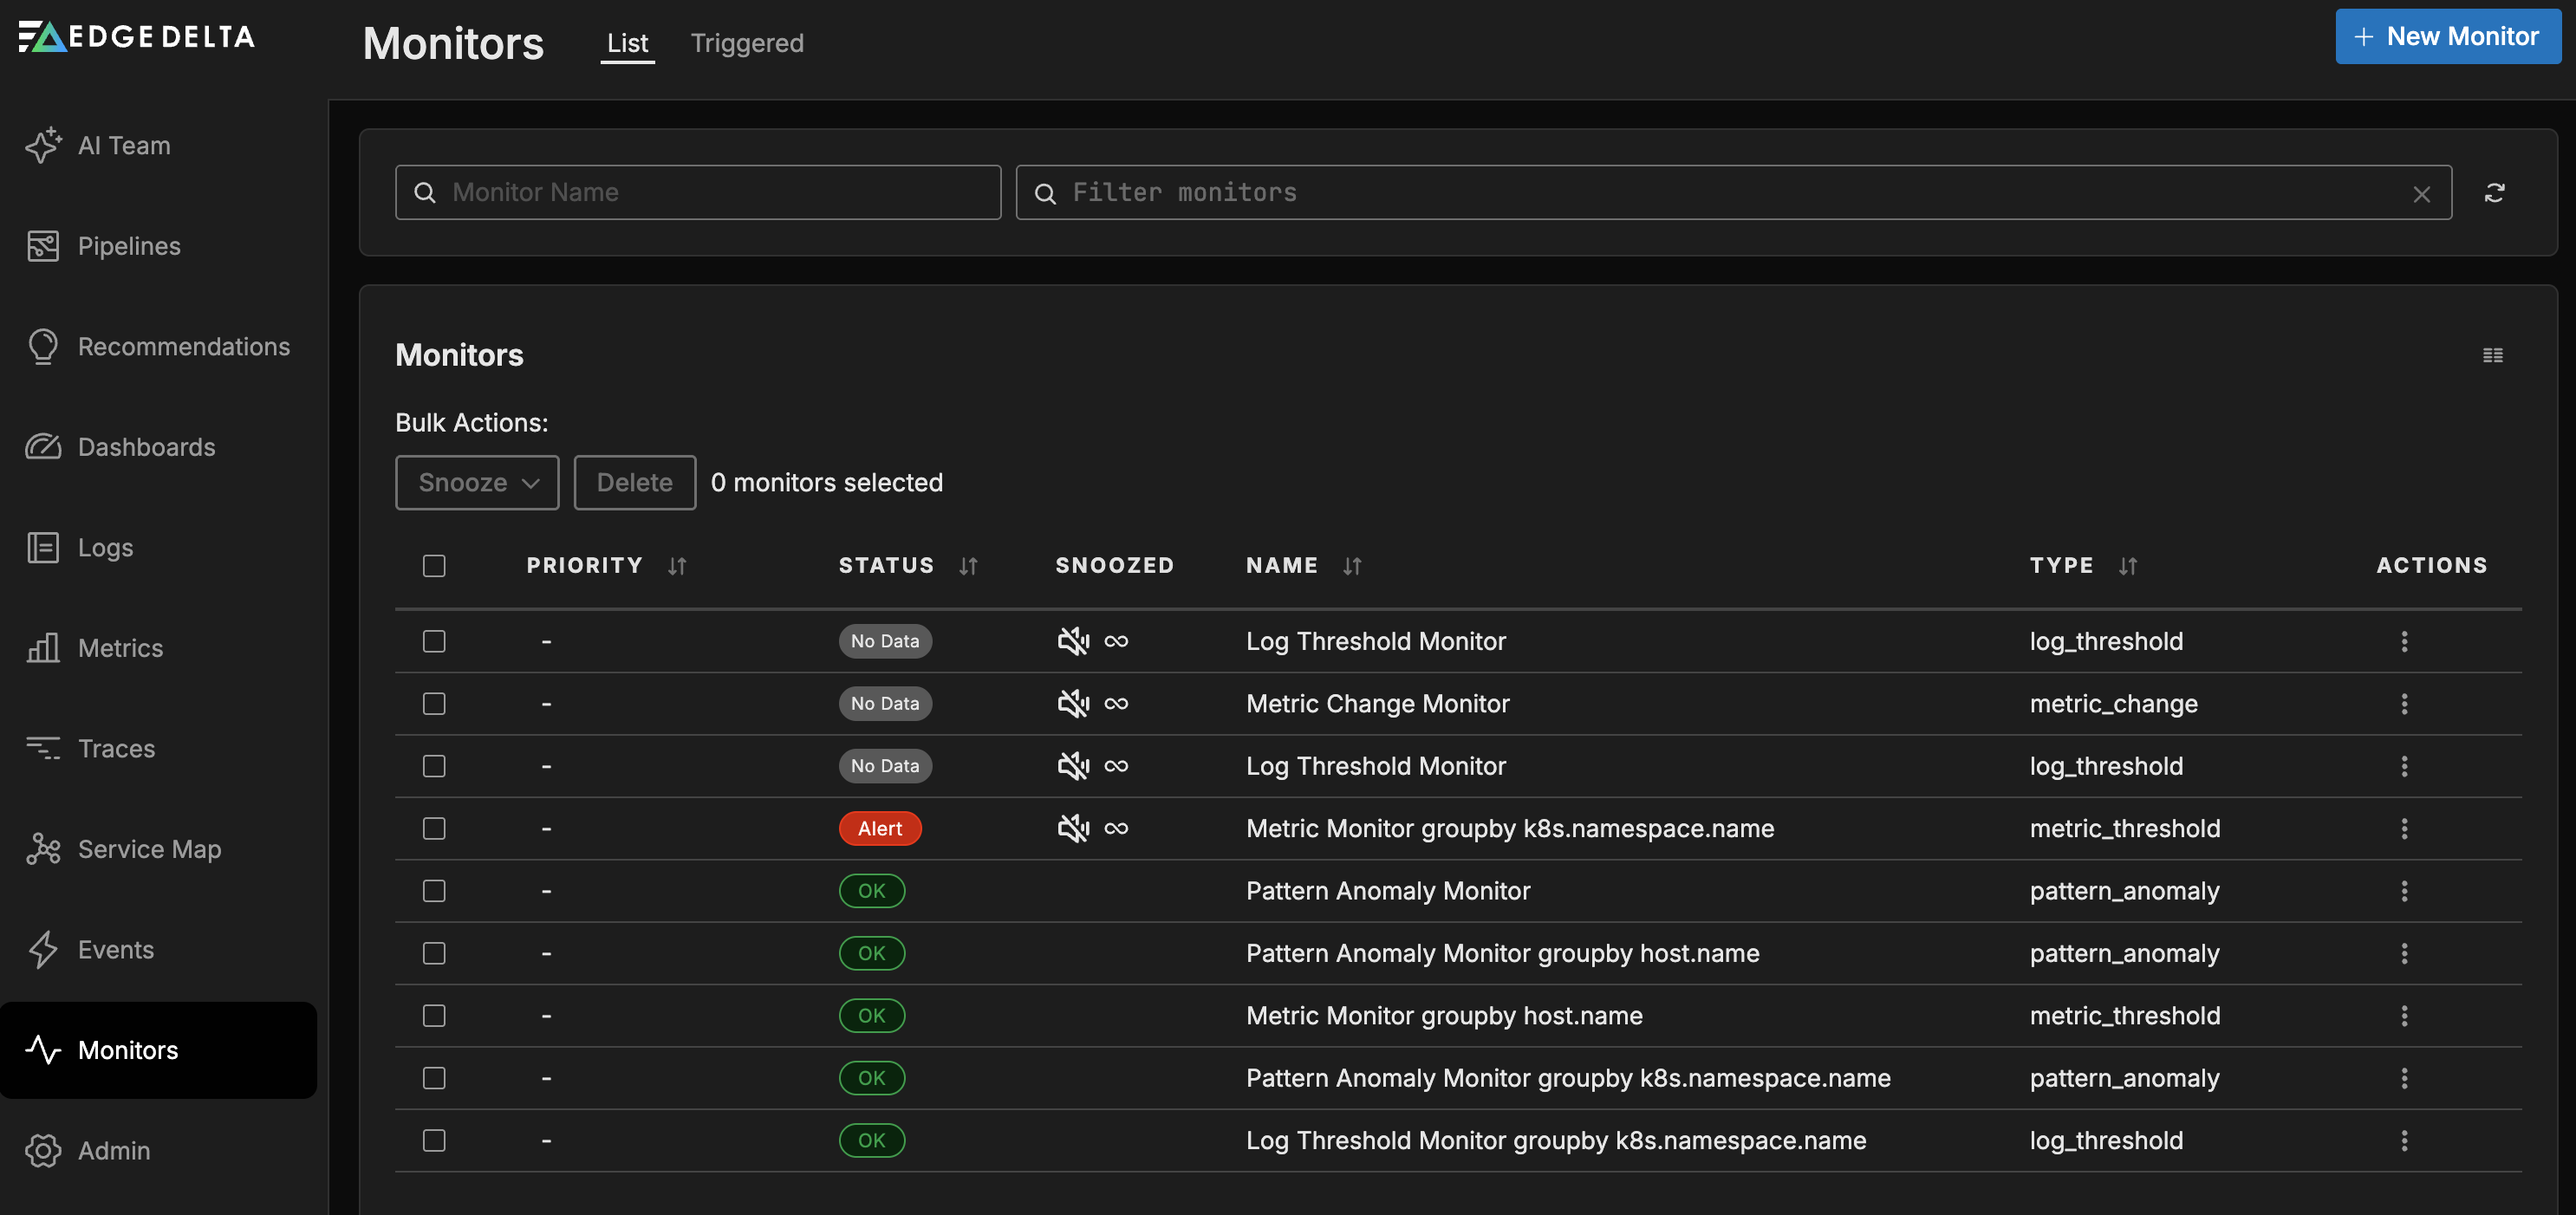
The monitors List page lists all existing monitors and their current state. It displays the following columns:
- Priority: The priority level of the monitor.
- Status: The current state of the monitor.
- Snoozed: Indicates if the monitor is currently snoozed.
- Name: The name of the monitor.
- Type: The monitor type (Metric Threshold, Log Threshold, etc.).
- Actions: Options to manage the monitor.
There are four states (status) that a monitor can be in:
- Alert: The monitor has detected a breach of its configured Alert threshold.
- Warning: The monitor has detected a breach of its configured Warning threshold.
- OK: The monitor has not detected a breach of any configured thresholds. This includes cases where source data exists but none meets the monitor’s conditions.
- No Data: The monitor enters this state when:
- There is absolutely no data for the entire evaluation window, or
- More than 25% of the data is missing within the evaluation window (when “Require Full Window” is enabled)
- When “Require Full Window” is disabled, the monitor only enters No Data state if all data buckets are missing (100% tolerance)
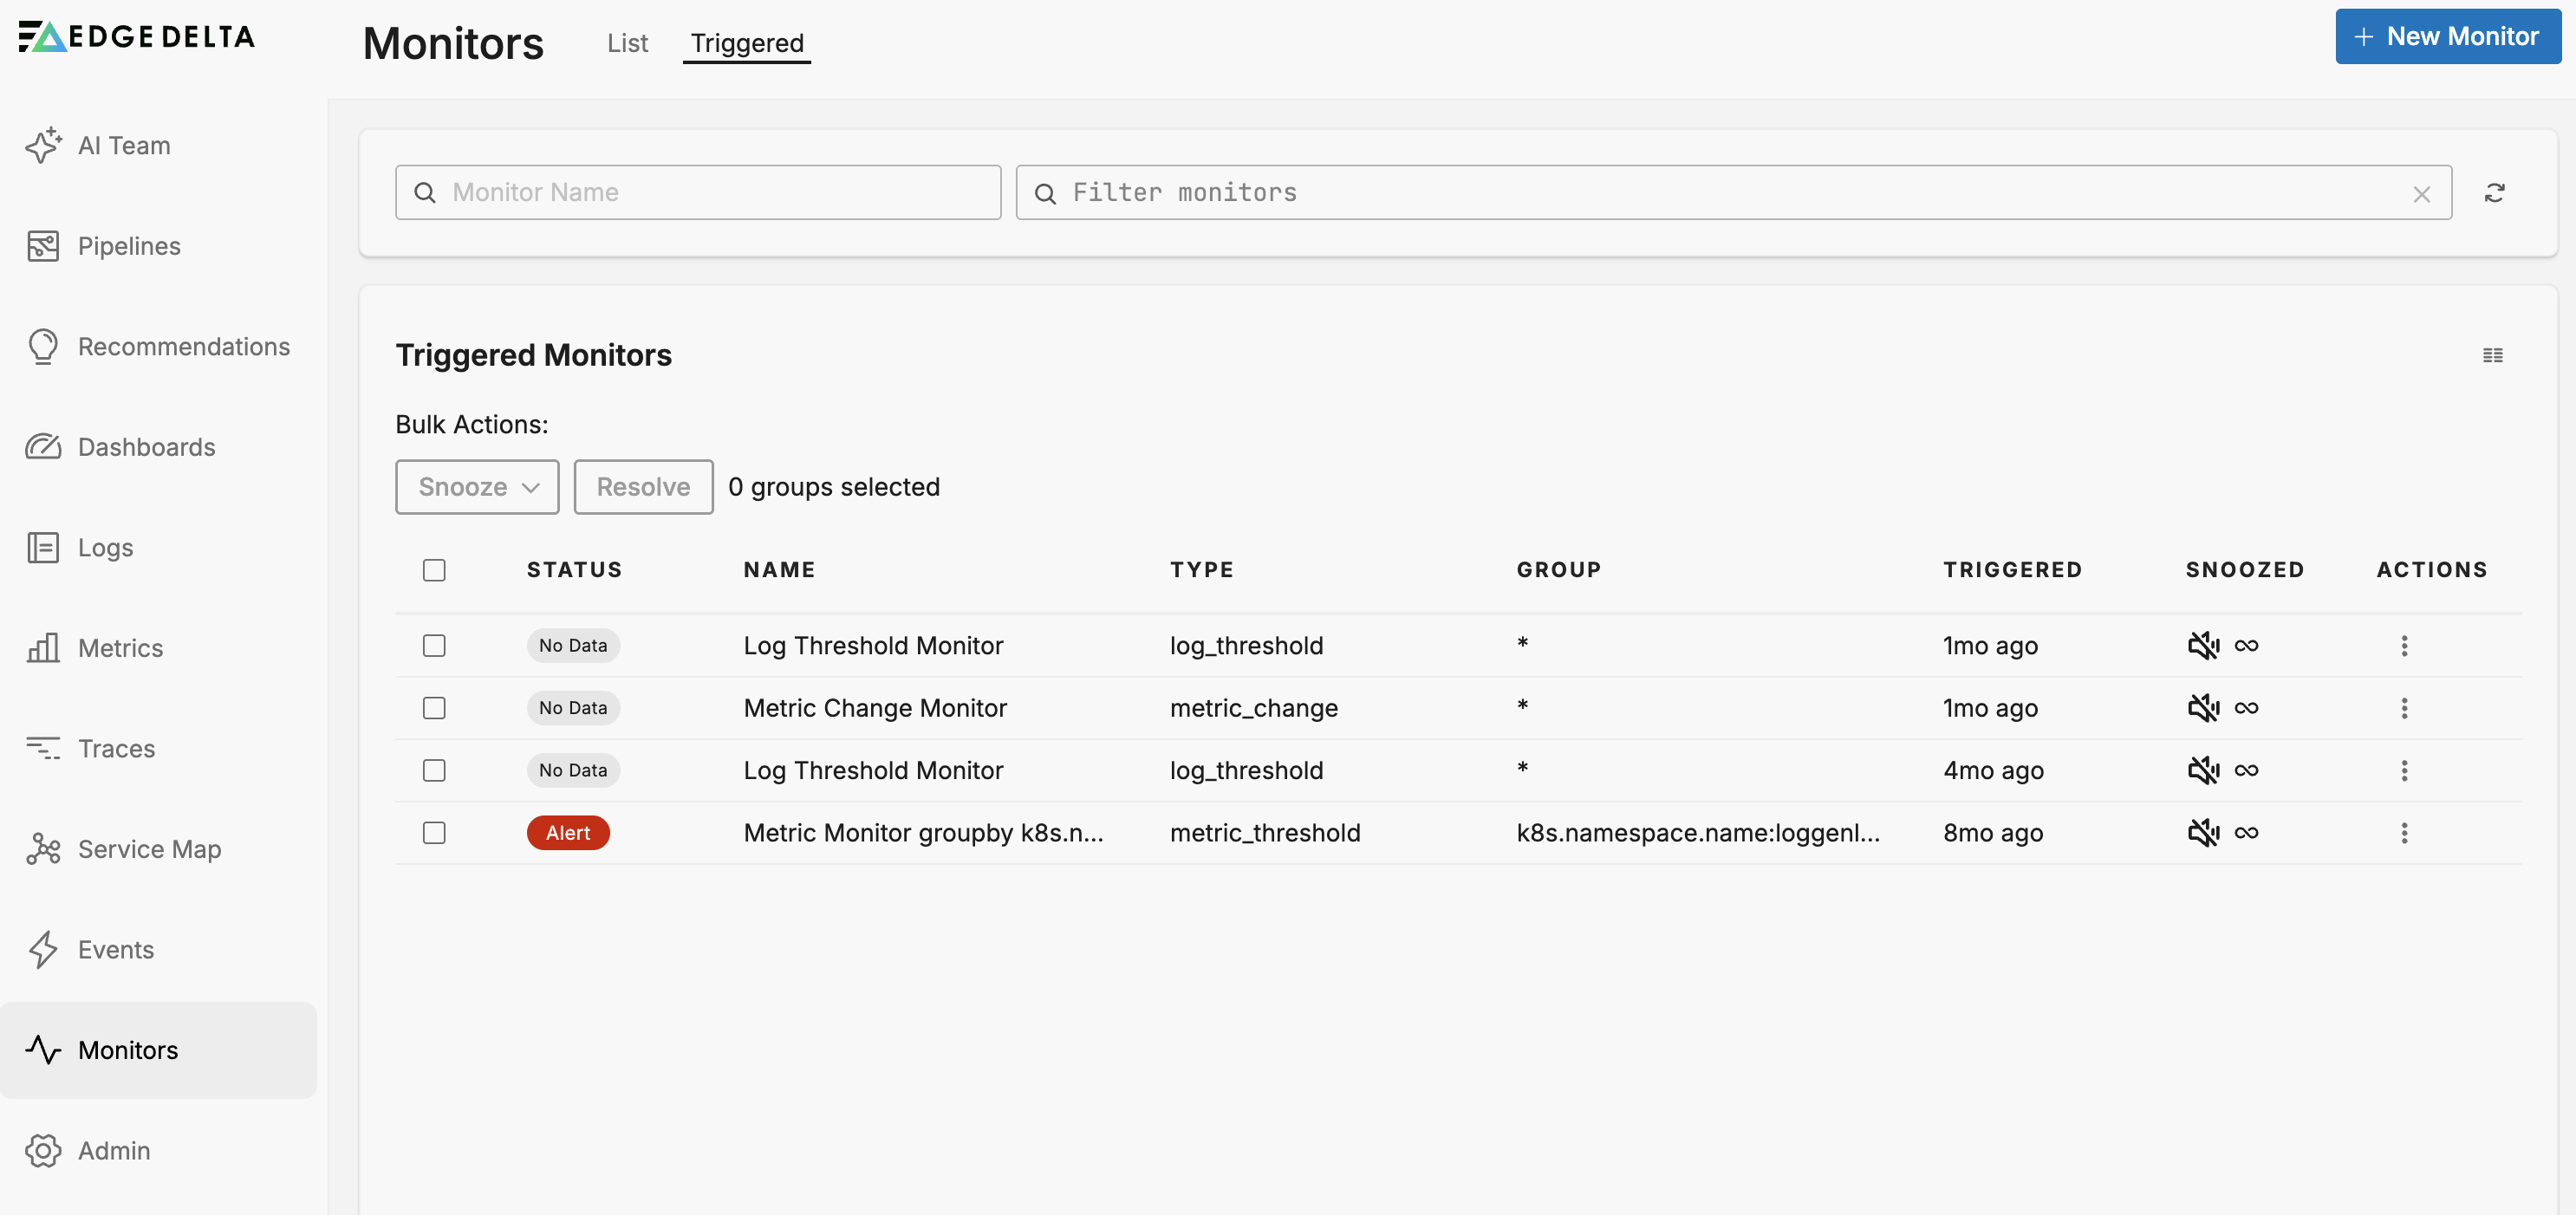
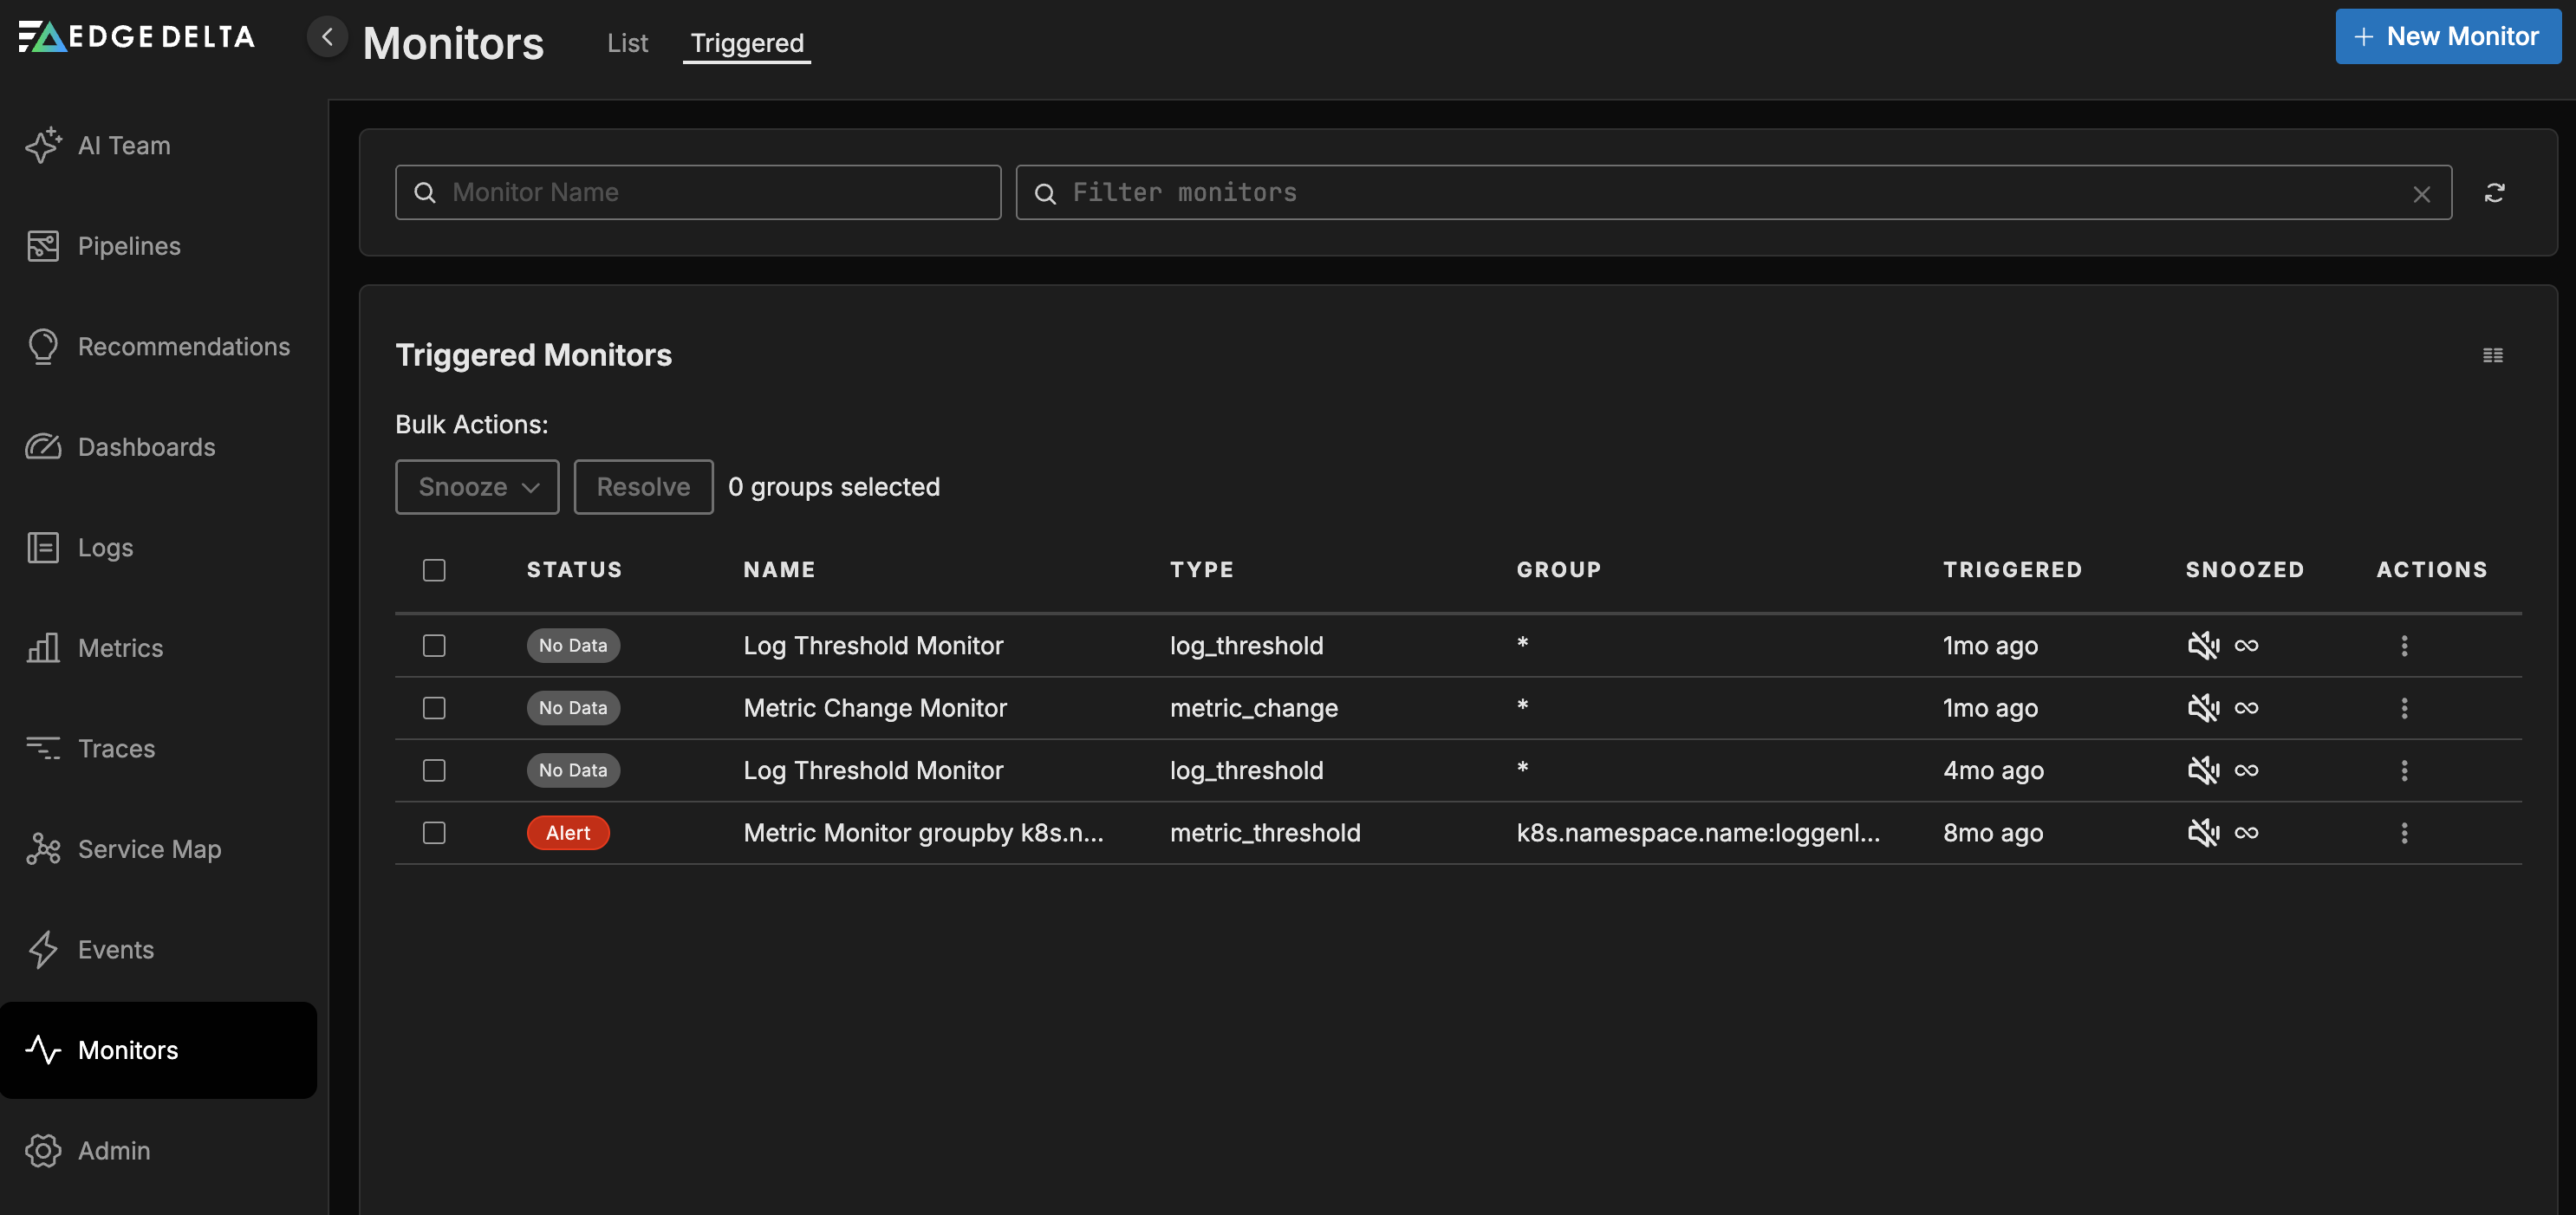
Triggered List
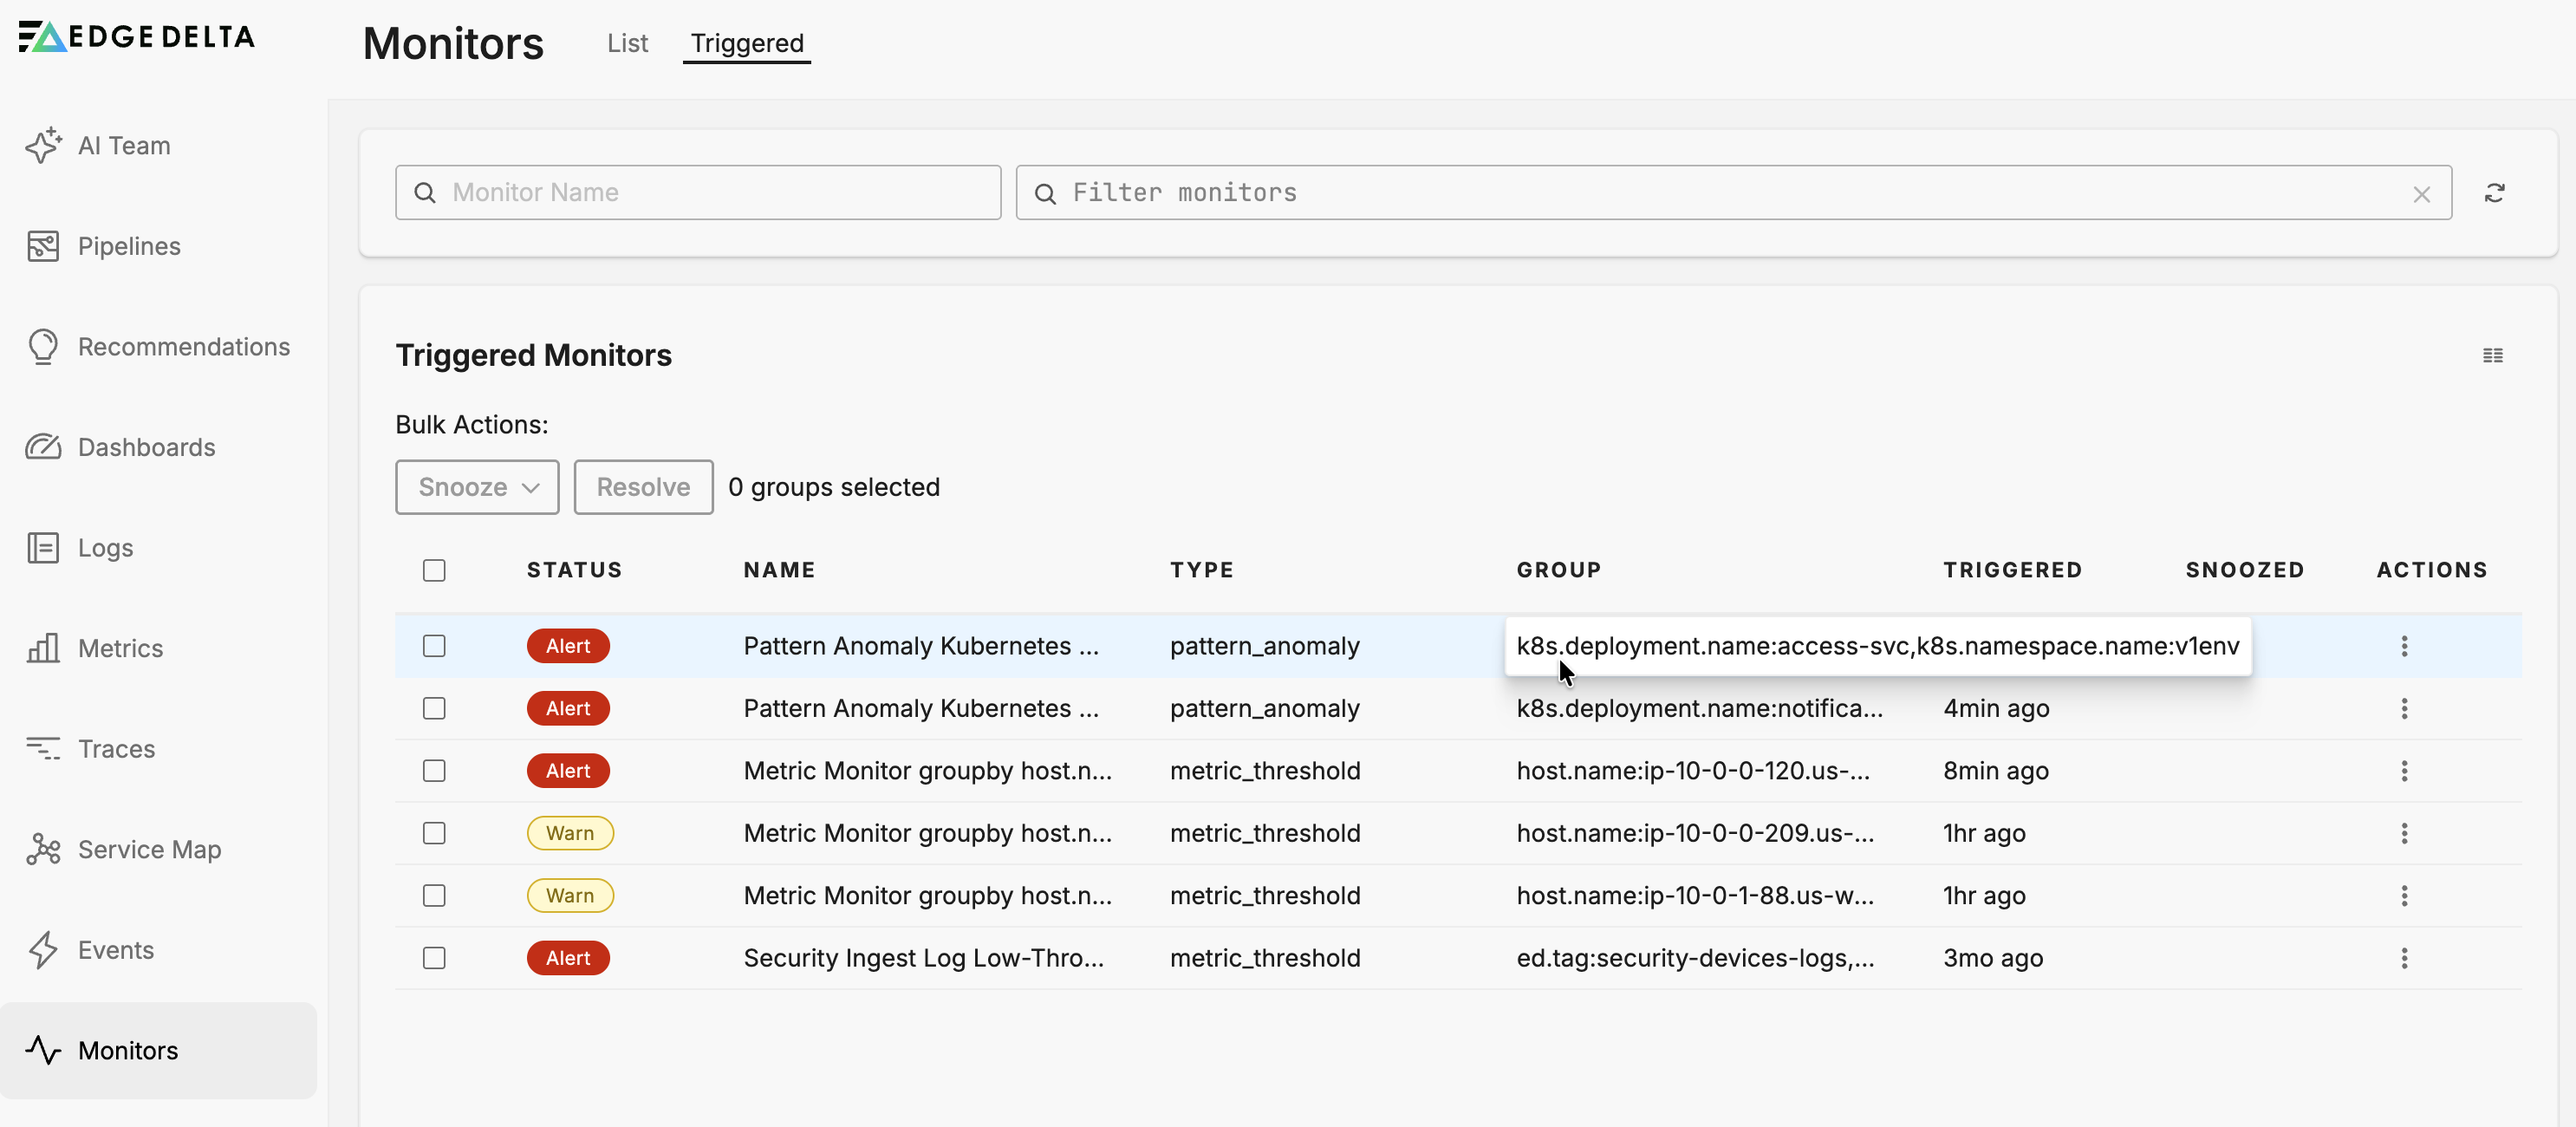
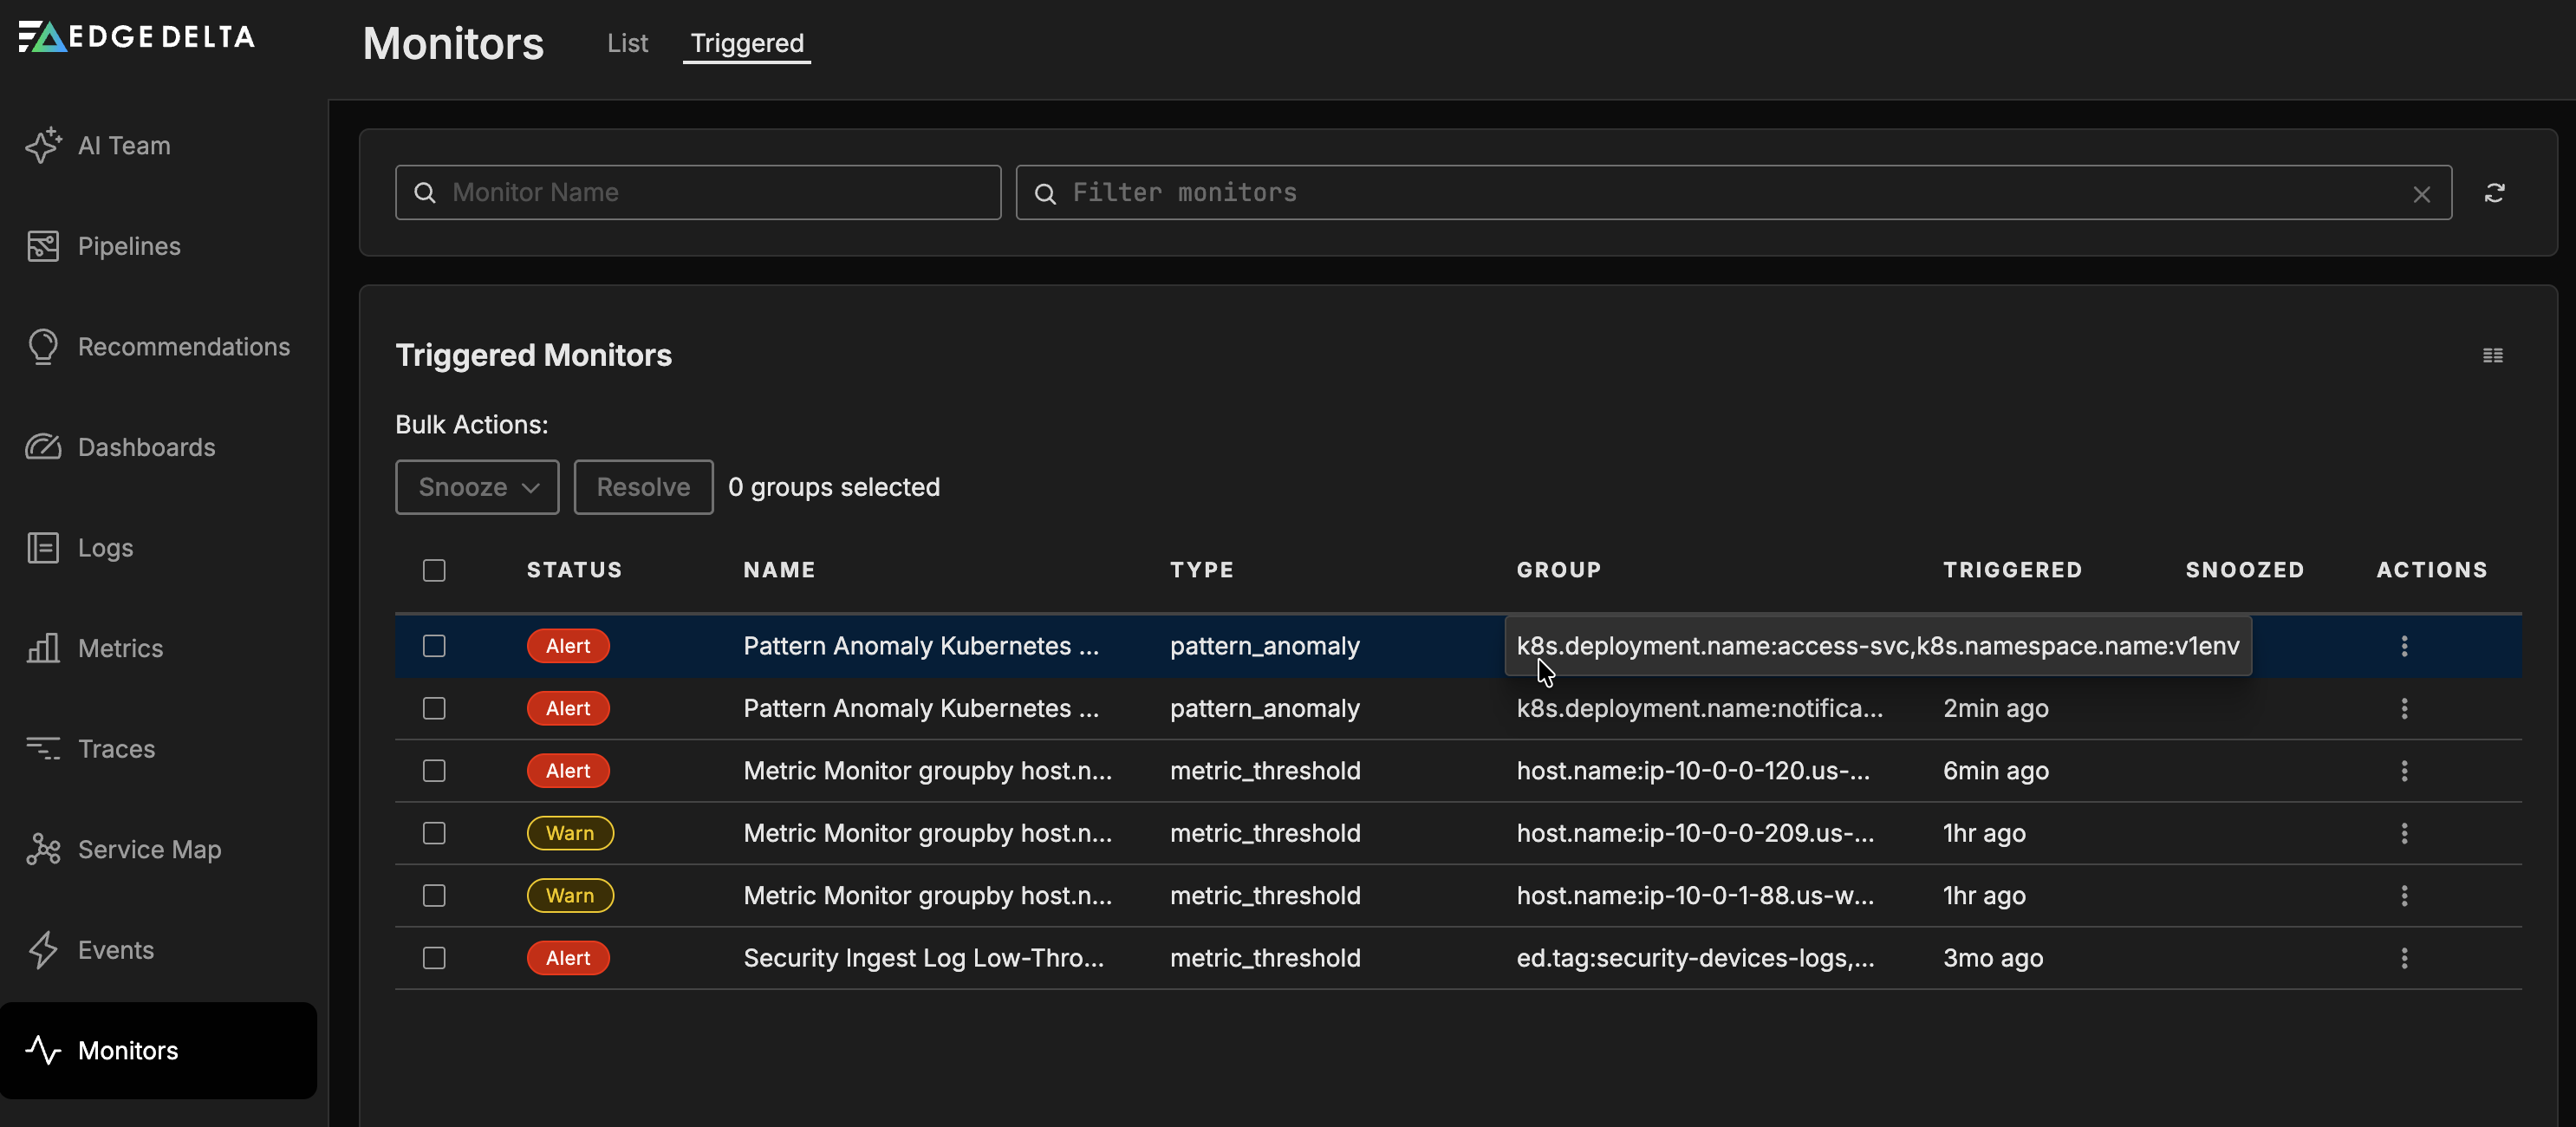
Click Monitors and select the Triggered tab.
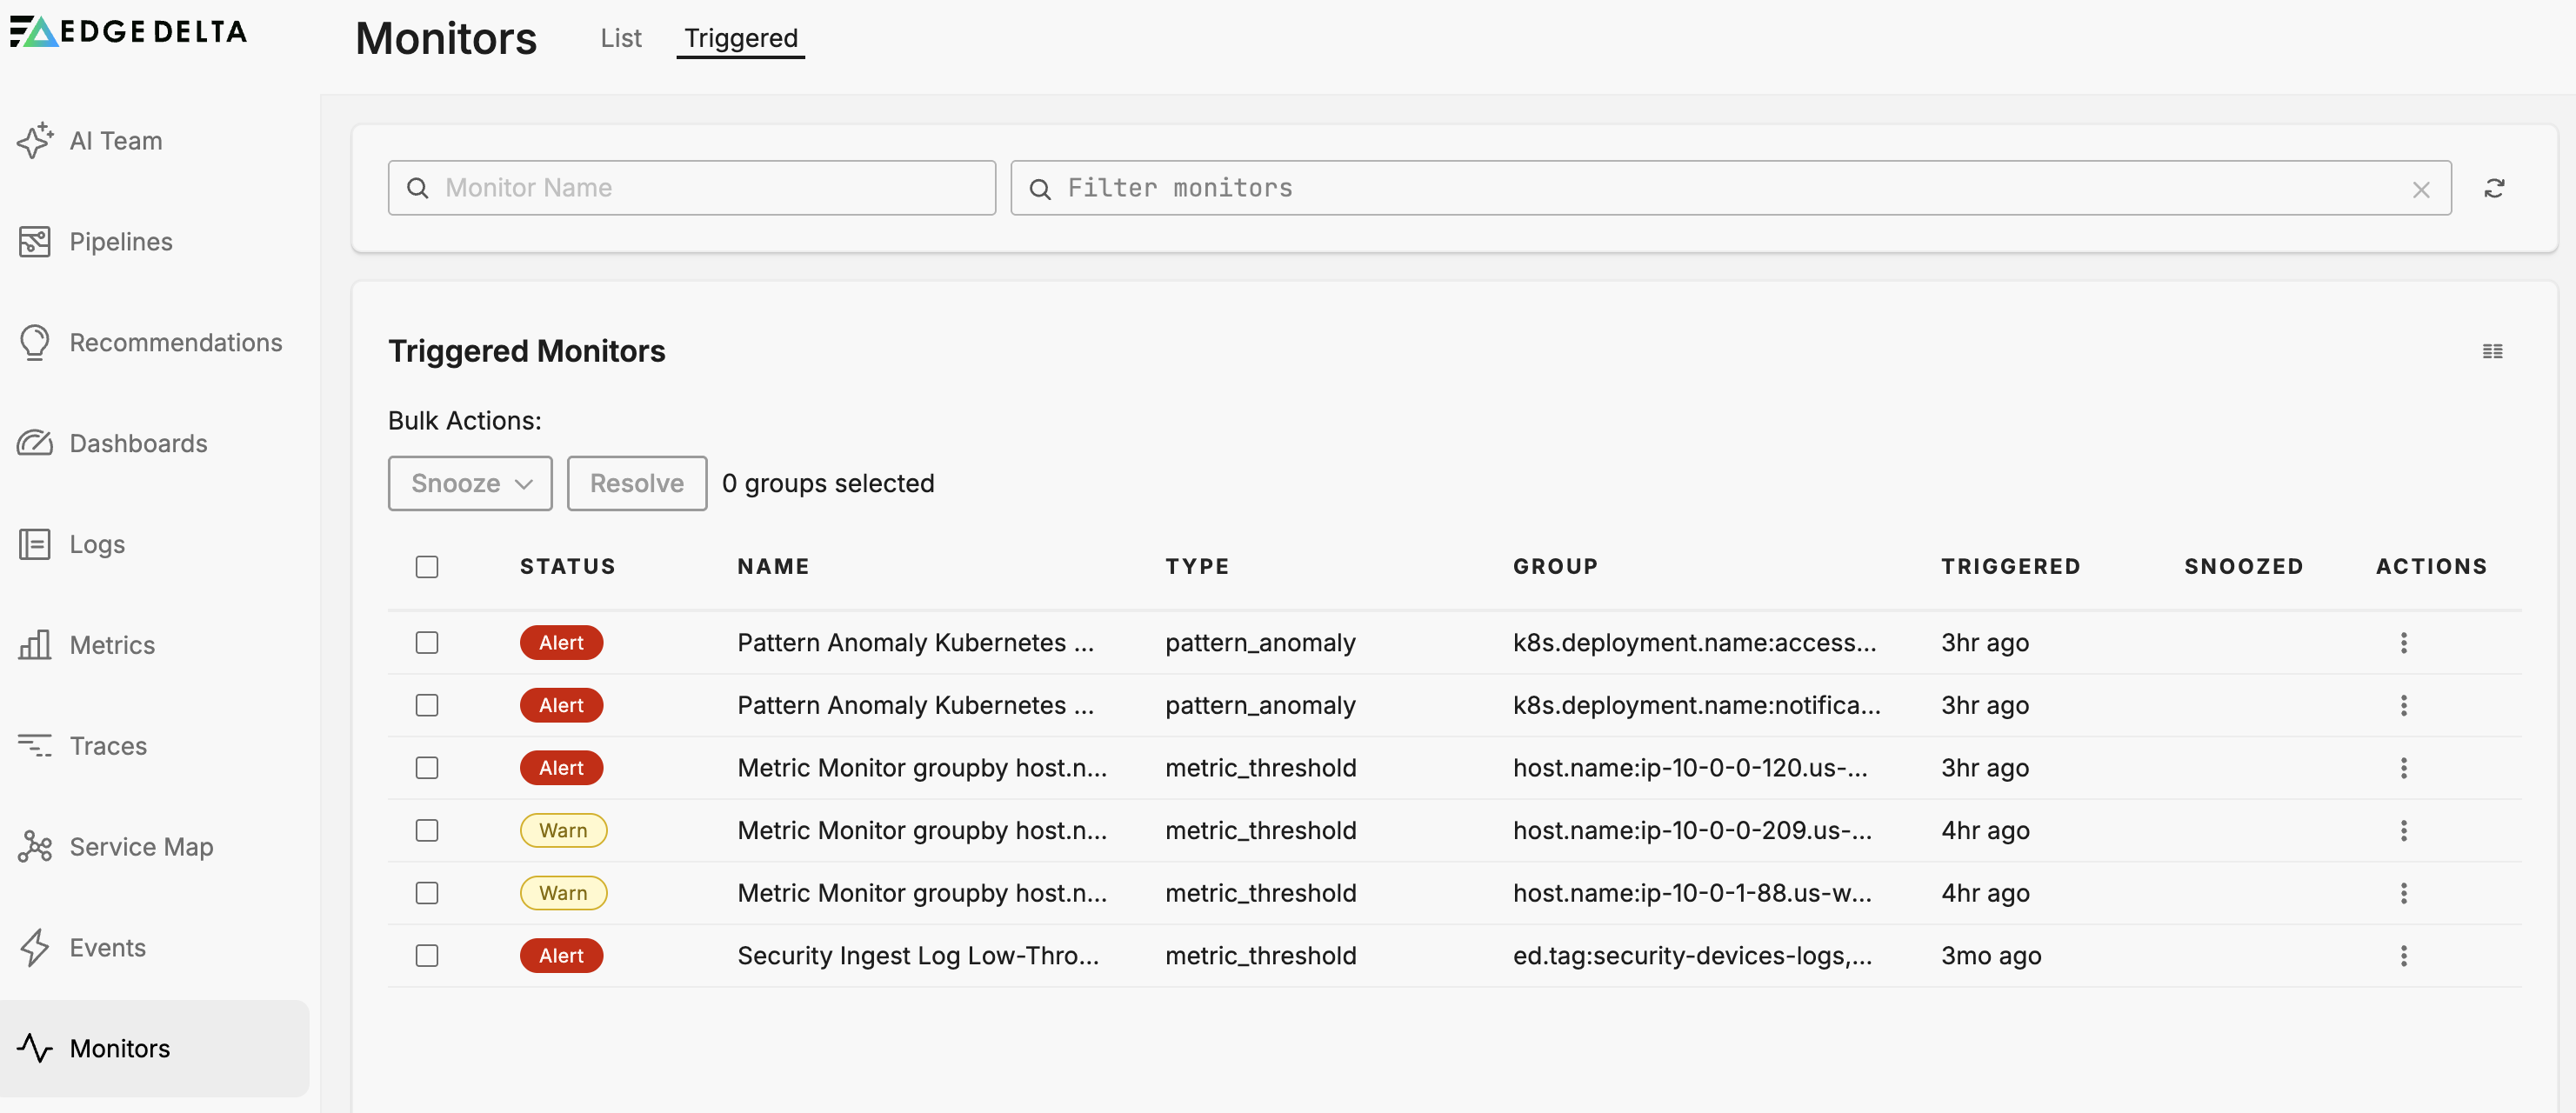
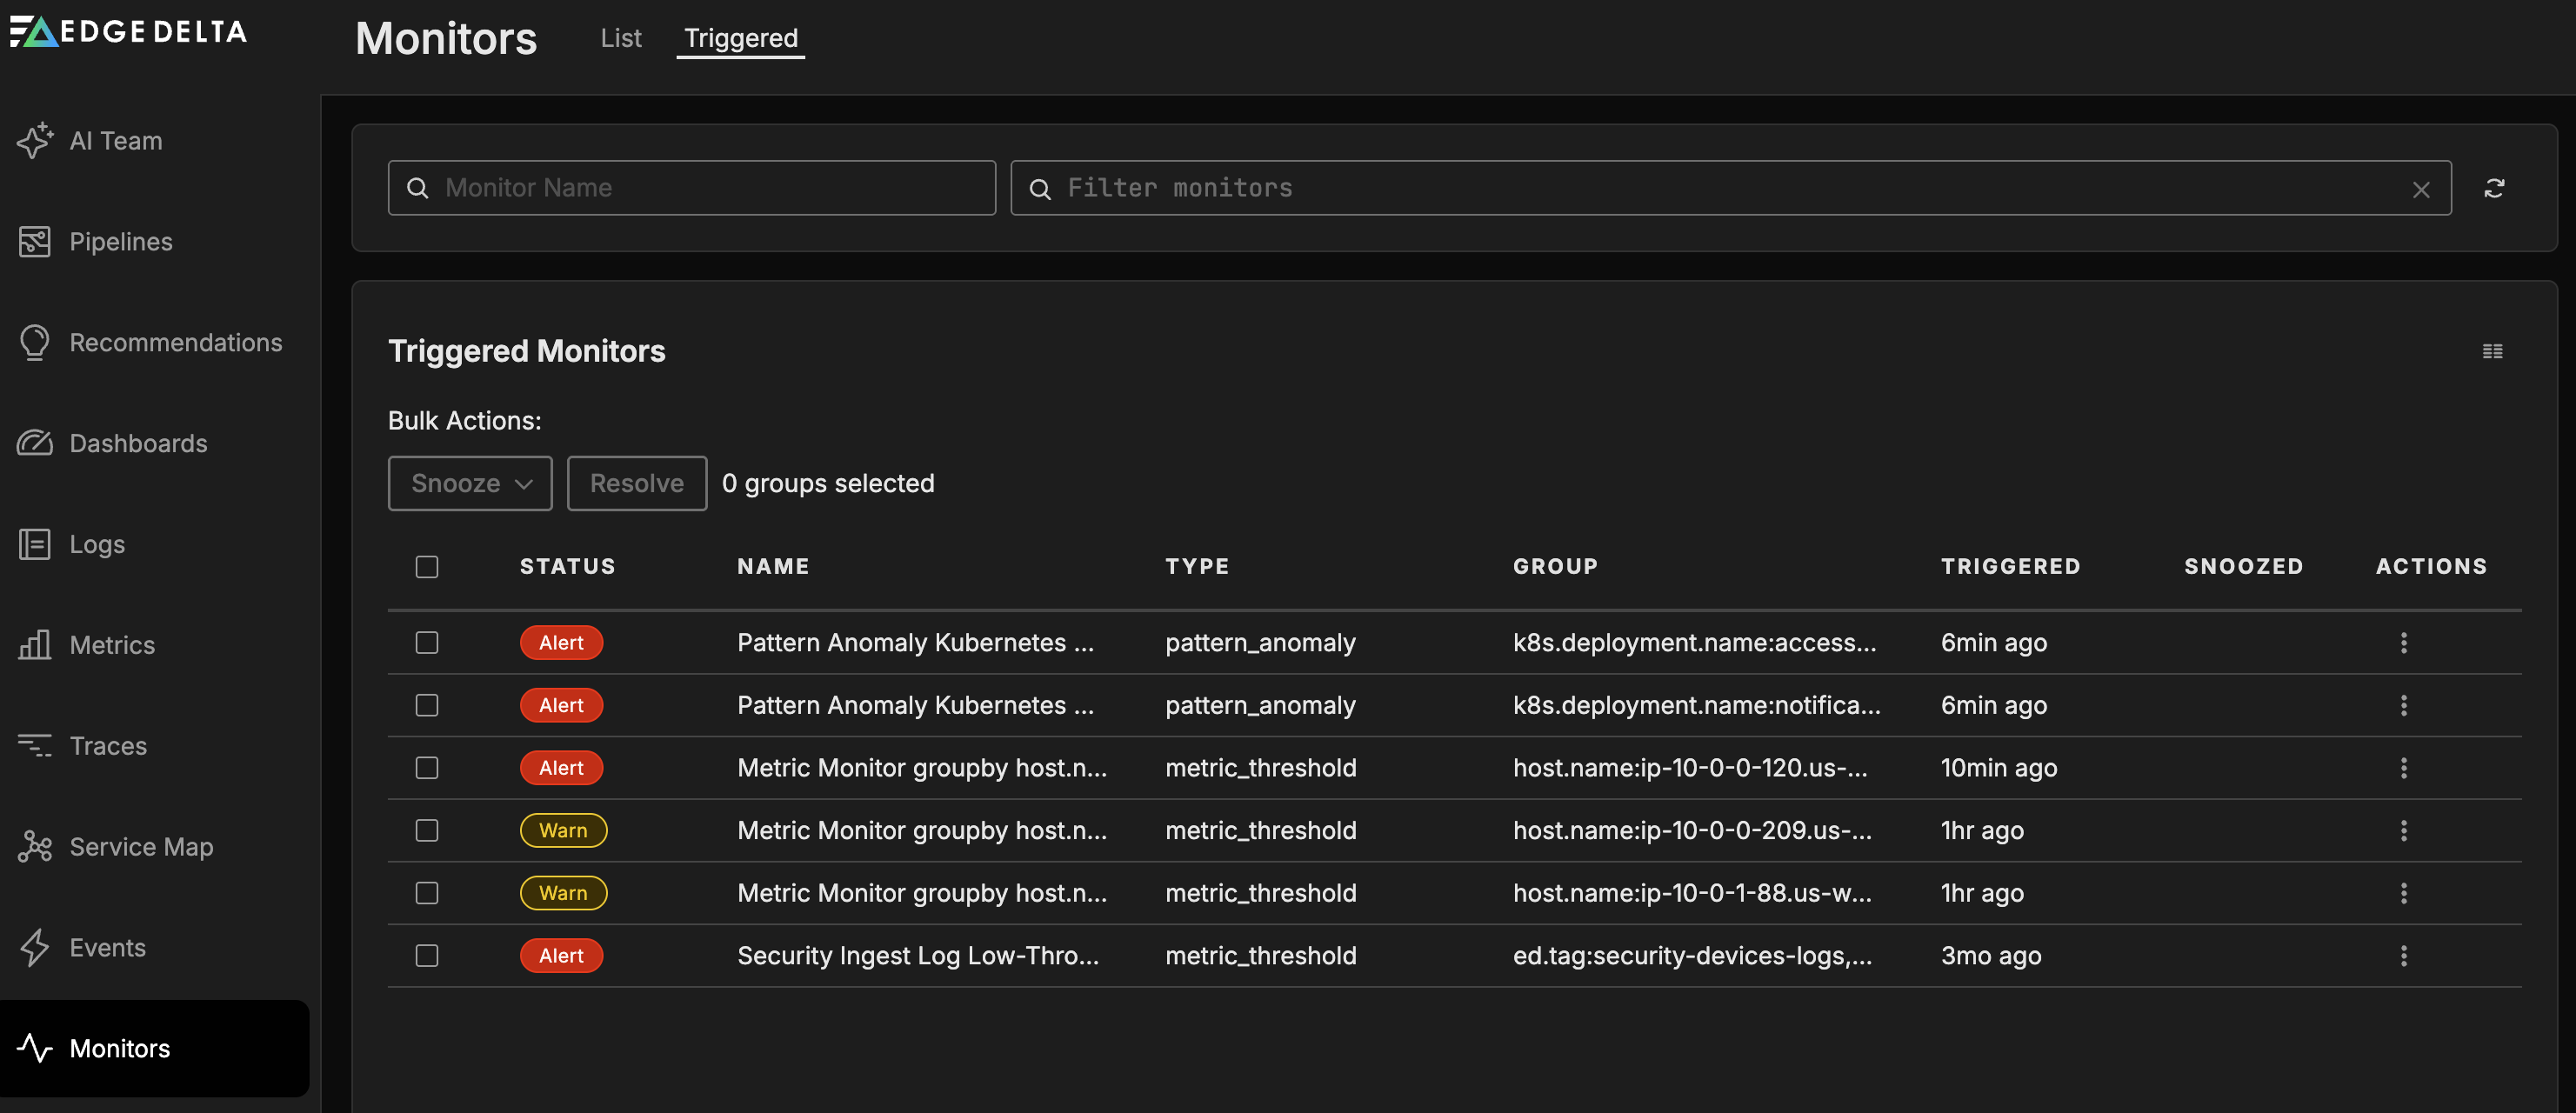
The Triggered tab shows monitors in the Alert, No Data, or Warning state. It displays the following columns:
- Status: The current state of the monitor.
- Snoozed: Indicates if the monitor is currently snoozed.
- Name: The name of the monitor.
- Type: The monitor type (Metric Threshold, Log Threshold, etc.).
- Group: The group-by dimension values that triggered the alert.
- Triggered: When the monitor entered its current state.
- Actions: Options to manage the monitor.
Manage Monitors
You click the kebab (three vertical dots) menu in the Actions column to make changes to the monitor, mute it, or see the events matching its monitoring criteria.
Notification suppression
Each monitor type includes notification suppression options that control how frequently alerts fire. Use suppression to reduce noise from monitors that trigger repeatedly for the same condition.
Suppression options are configured per monitor in the monitor’s settings. By default, suppression is disabled.
When suppression is enabled, you configure two values: a notification threshold and a duration. Edge Delta opens a counting window when the first notification fires, and the window lasts for the configured duration. Each notification within that window increments a counter. Once the counter exceeds the threshold, further notifications in the same window are suppressed. When the window expires, the counter resets, and the next notification opens a new window. The monitor’s evaluation window does not affect suppression timing.

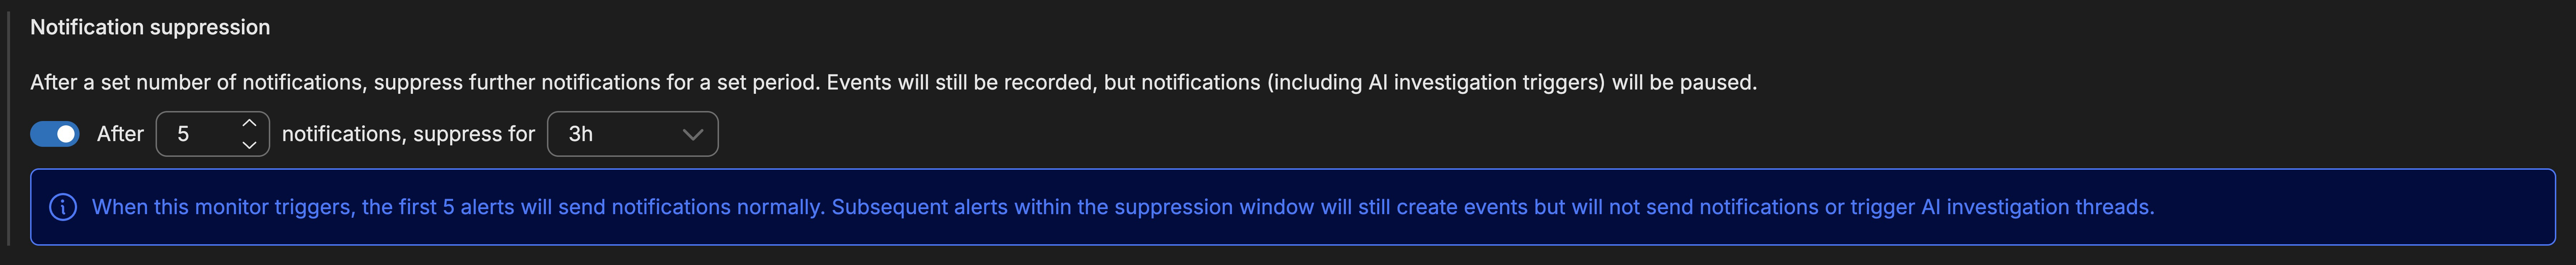
For example, a monitor configured with a threshold of 3 notifications and a duration of 6 hours sends the first 3 notifications normally. The 4th and any later notifications within those 6 hours are suppressed. After 6 hours elapse from the first notification, the counter resets on the next notification.
During suppression, events are still recorded but notifications and AI investigation triggers are paused.
Monitor Limits
Monitors have the following operational limits:
Group By Limits
When using Group By to split monitor evaluations by dimensions like k8s.pod.name or service.name, there is a limit on the number of unique group combinations that can trigger alerts simultaneously per minute:
| Monitor Type | Maximum Unique Group-By Combinations |
|---|---|
| Metric Threshold | 50 |
| Log Threshold | 50 |
| Metric Change | 50 |
| Pattern Anomaly | 30 |
For example, if you have a Log Threshold monitor grouped by k8s.pod.name and 100 pods are sending data that would trigger an alert, only the top 50 will fire alerts at the same time.
Group Value Length Limit
When you configure a monitor with Group By dimensions, Edge Delta concatenates those values into a single string like k8s.pod.name:my-pod-name,service.name:payment-service. This combined string is limited to 942 bytes. If your combined group-by values exceed this limit, they are truncated in the Monitor Status page and in notifications.
Slack Notification Limit
When sending notifications to Slack, the message body is truncated to 3,000 characters. If the message exceeds this limit, it is truncated and appended with ... *(truncated due to slack character limit)*.
In this section
- Log Threshold Monitor
- Metric Threshold Monitor
- Metric Change Monitor
- Metric Anomaly Monitor
- Pattern Anomaly Monitor
- Composite Monitor
- Monitor Notifications
- Synthetic Monitor
- Send Events from Edge Delta Monitors to Slack
- Send Events from Edge Delta Monitors to PagerDuty
- Send Events from Edge Delta Monitors to Dynatrace
- Trigger AI Team Workflows from Monitors
- Send Monitor Events to AI Team Channels