Correlate Logs and Traces in Edge Delta
2 minute read
Overview
Edge Delta enables the seamless of logs and traces, allowing you to monitor complex distributed systems. This feature supports debugging, performance optimization, and troubleshooting across microservices by revealing full request lifecycles and dependencies within your applications. It provides the ability to trace errors back to logs and understand the interplay between different services. Logs supply discrete event data, while traces offer a structured perspective on operations within and between services. By correlating trace IDs found in logs, you can track requests from inception to completion and access detailed trace views for in-depth analysis and insight into areas of concern.
Trace IDs and the Trace Explorer
To begin, ensure your logs contain trace IDs.
Note: Ensure you are using an up-to-date version of the OTEL SDK, and Edge Delta agents must be at least version 1.39.
These IDs are essential for linking logs to their corresponding traces:
- Start by searching for logs with associated trace IDs using
-trace_id:"". Filter logs as needed, for example, by error types or recent time windows, and select a log of interest
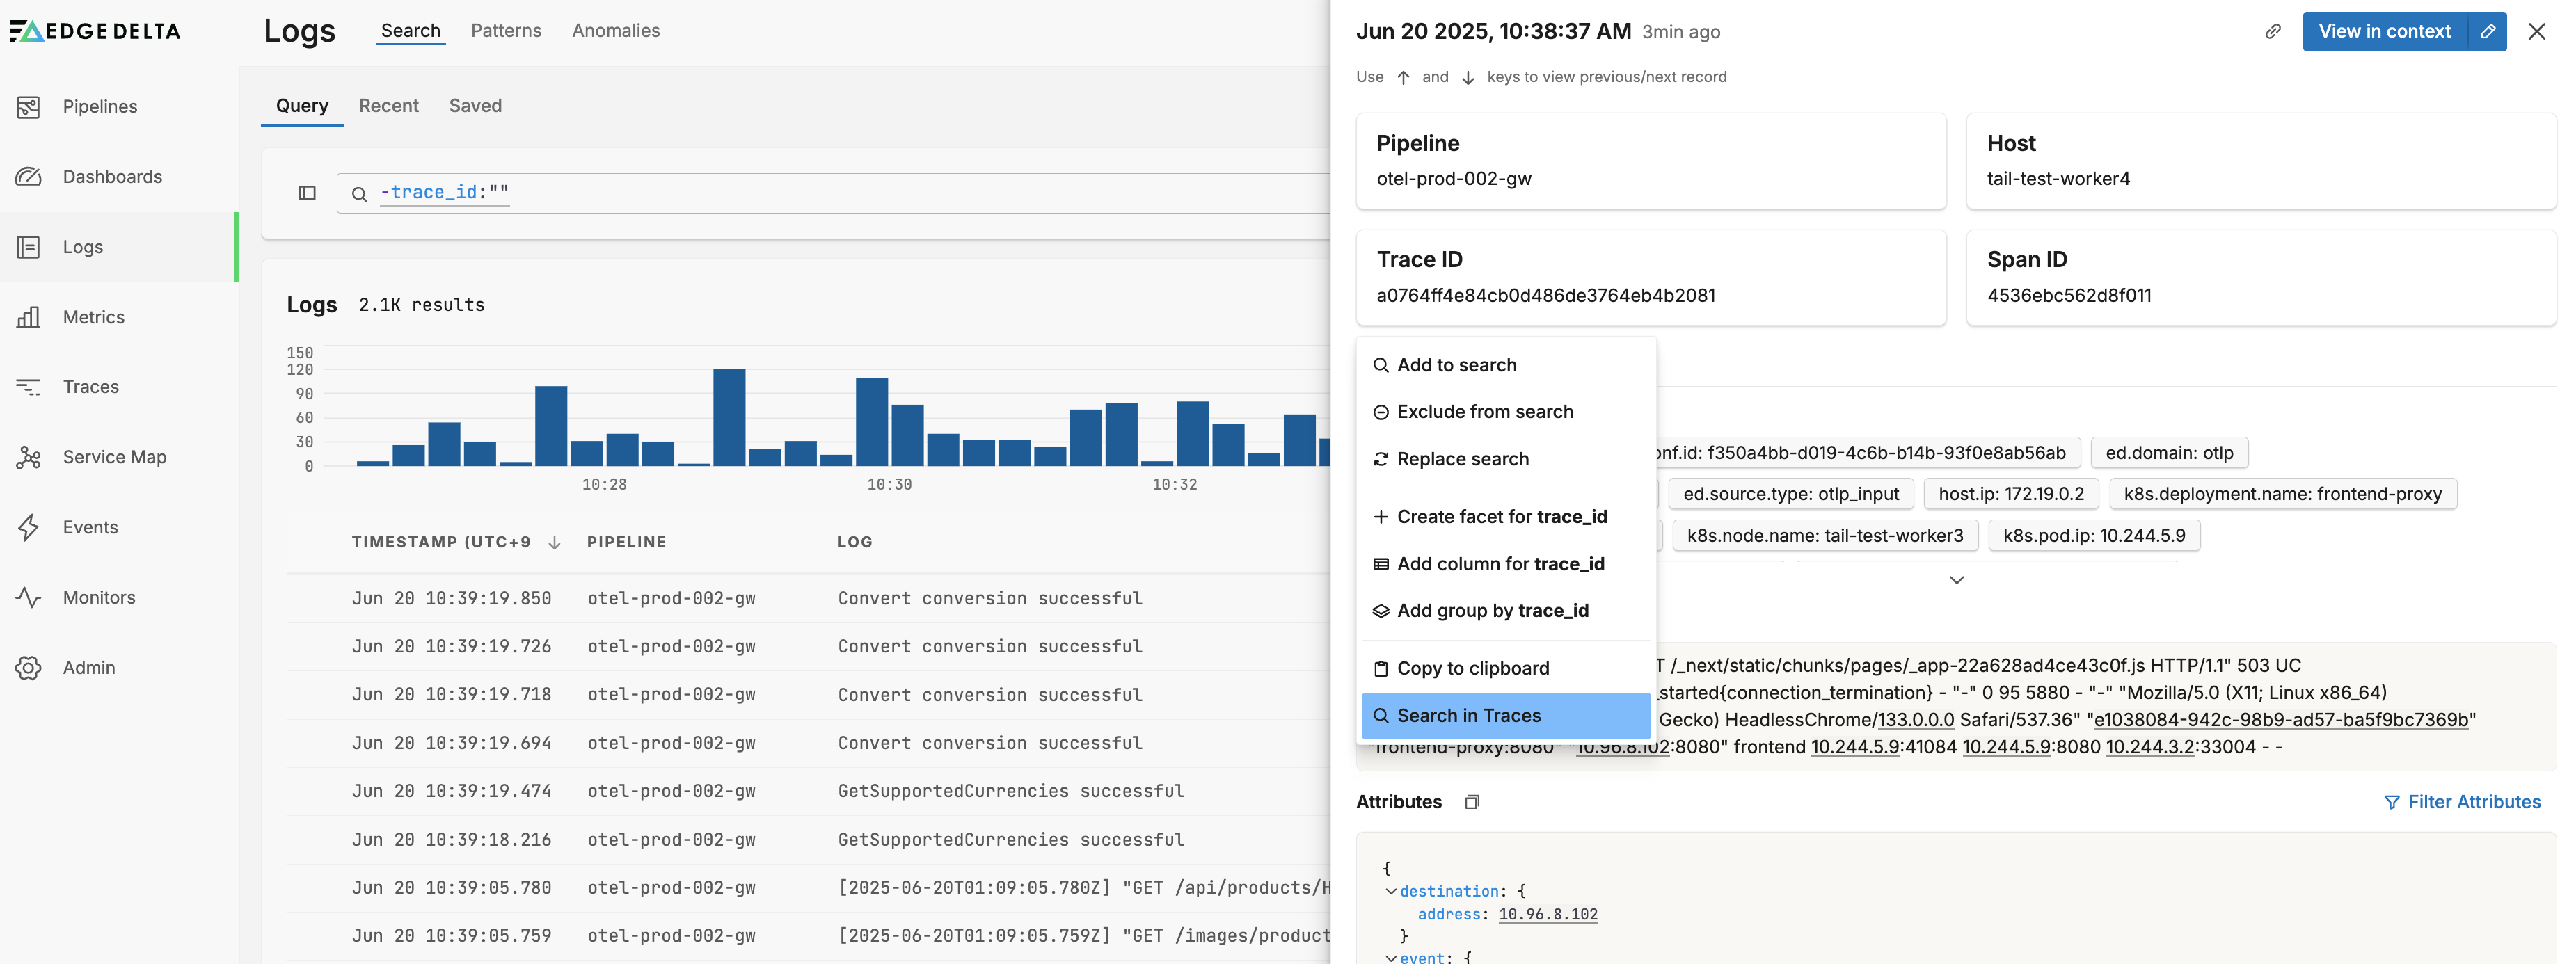
In this example, all logs with trace IDs are visible and a log has been selected.
- Click the Trace or Space ID and select Search in Traces. This opens the trace in the Trace Explorer.
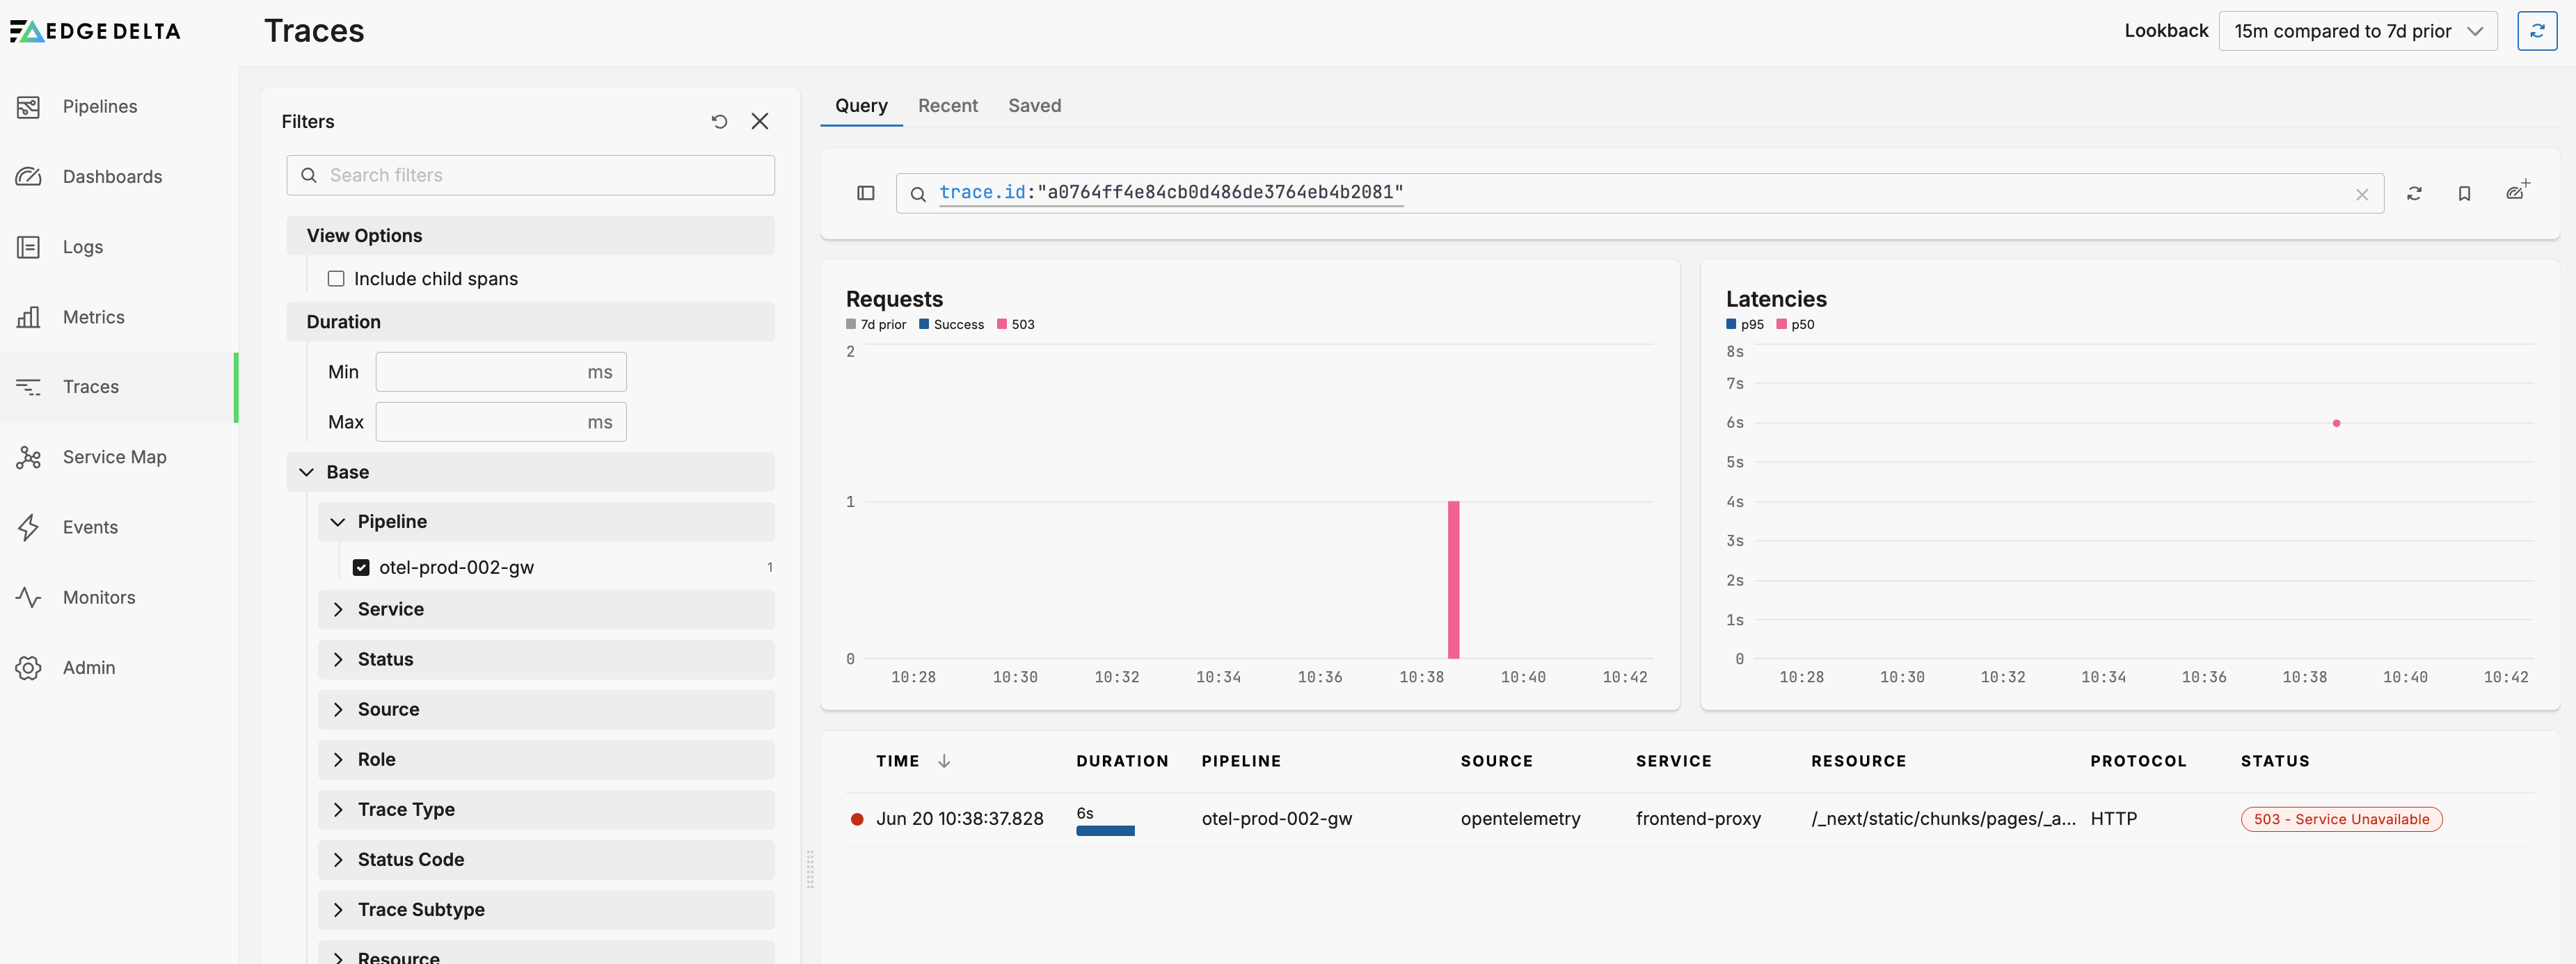
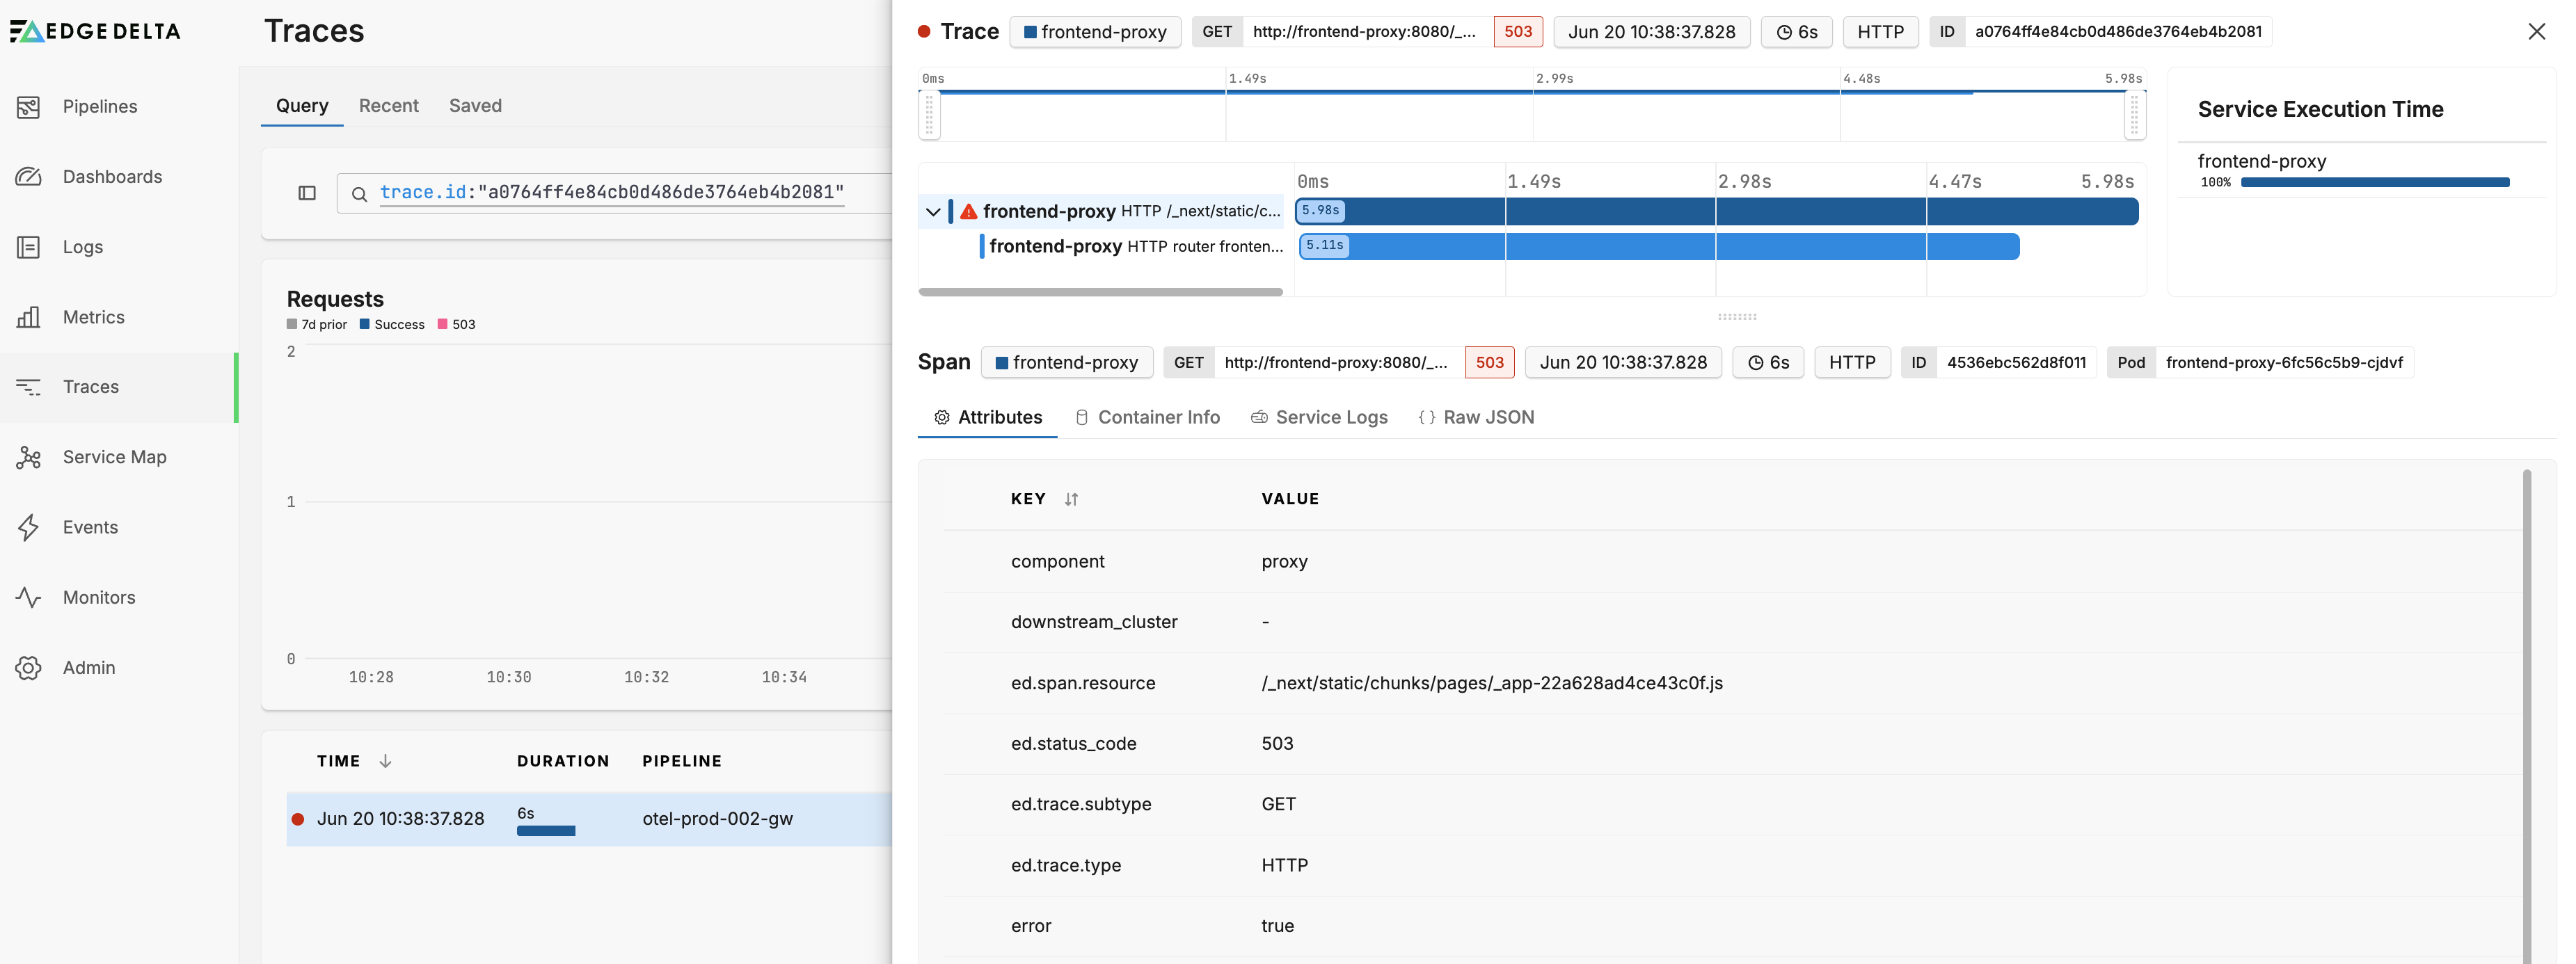
- Click the trace to view detailed trace information associated with that log entry.
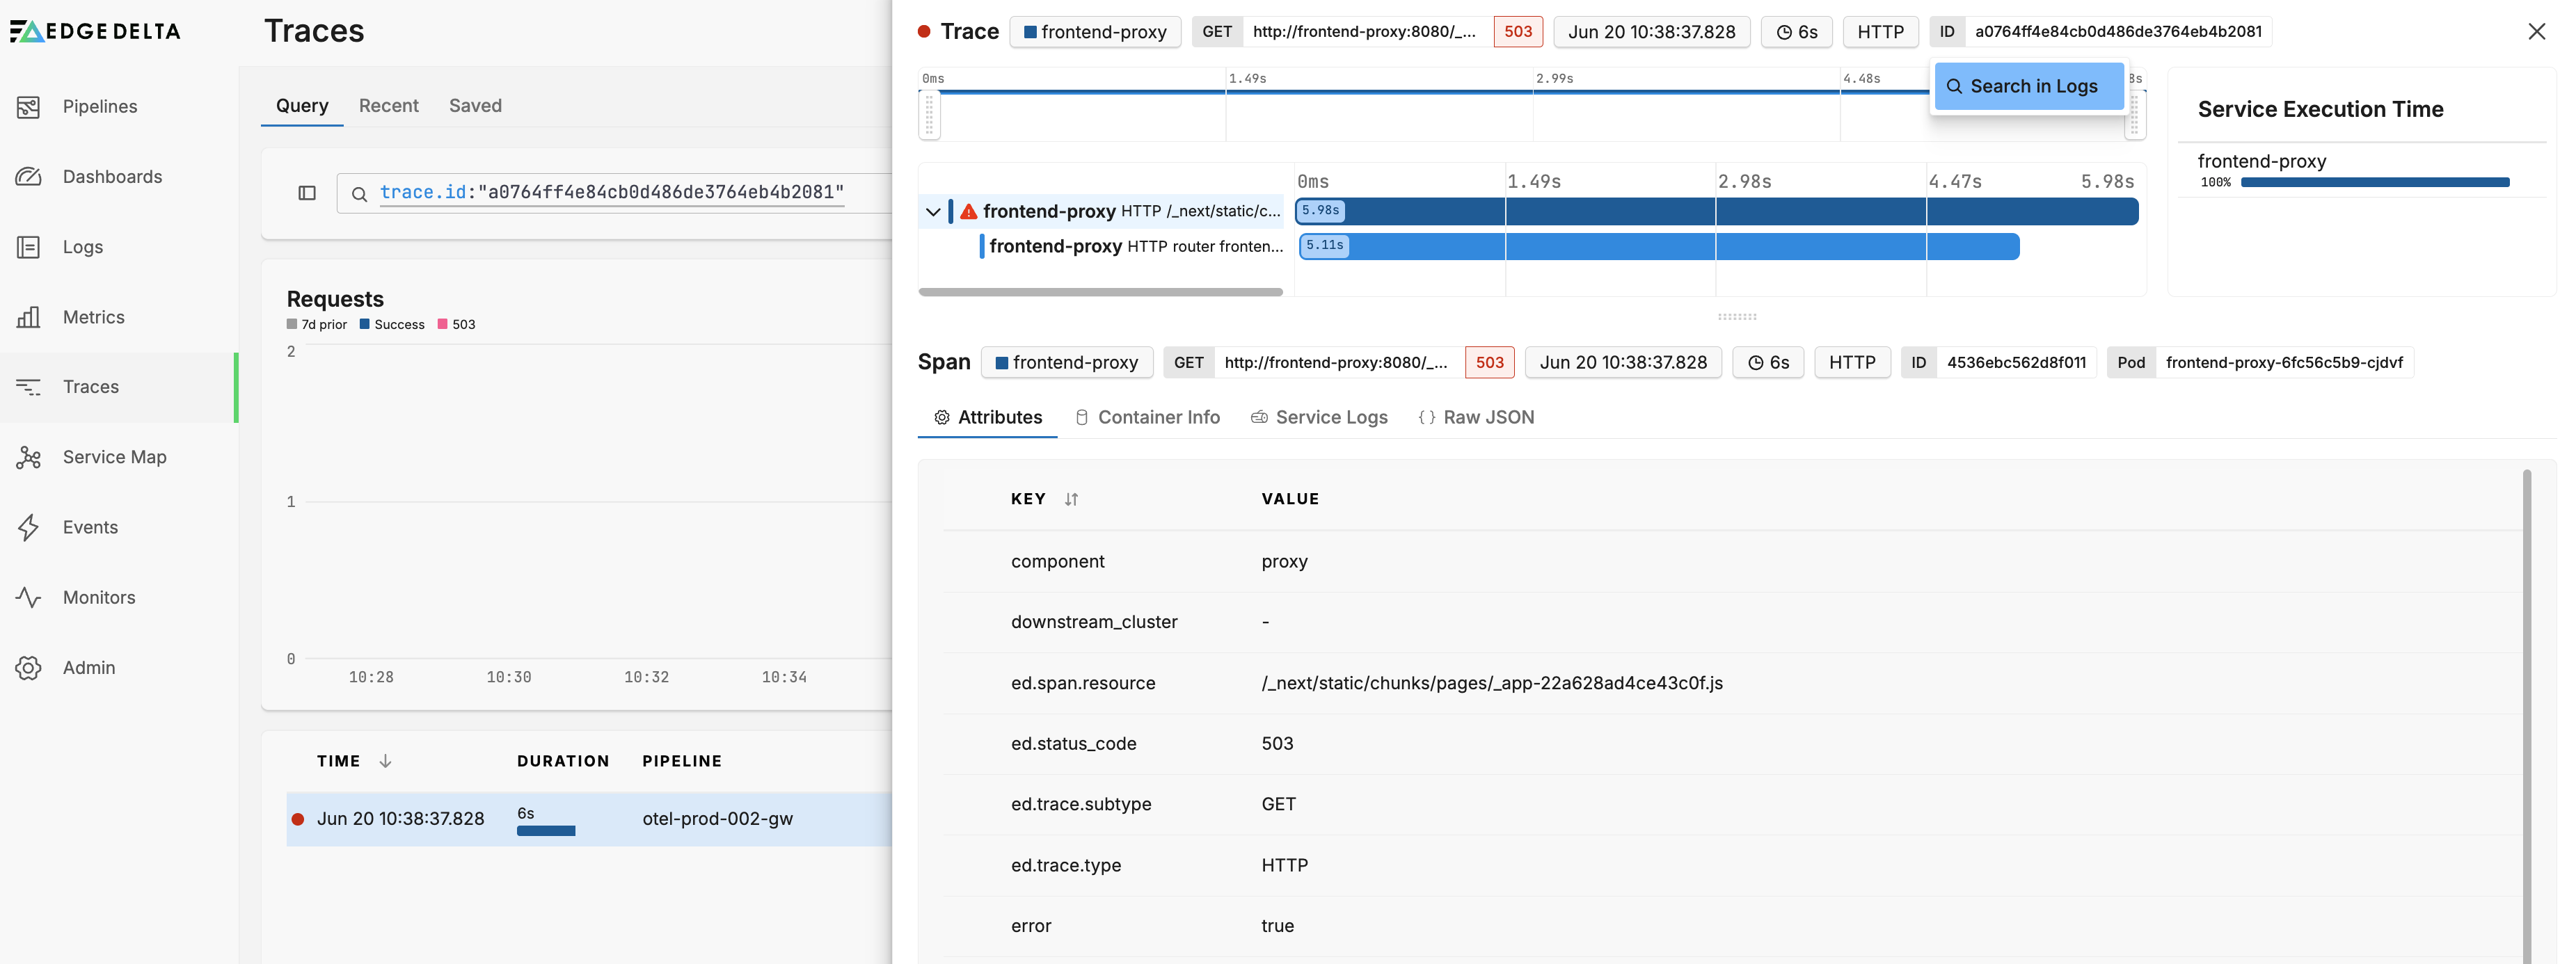
- Similarly, you can click the Trace ID and select Search in Logs to view logs associated with the trace.
Practical Application
This capability proves especially beneficial for incident investigations. First, filter log entries by error levels or specific messages to swiftly identify problematic areas. Then, utilize trace views to examine individual spans, reveal service interactions, and pinpoint the origins of errors.
Diagnosing with Correlated Data
Use log and trace data actively for diagnostics to enhance application reliability by gaining insights into service dependencies, identifying bottlenecks or failures, and tracking metrics such as response times and error rates across distributed components.
Next steps:
- Check Service Metrics: Review service and network performance metrics related to impacted requests. Assess resource utilization for services highlighted in traces.
- Inspect Logs: Dive into logs where trace IDs surface, examining detailed messages or warnings that might accompany errors.
- Analyze System Events: Investigate any deployment or configuration changes recorded around incident times.