Edge Delta Aggregation Widget
Configure the Aggregation Widget in the Edge Delta web application to visualize aggregate data using various chart types.
less than a minute
Overview
The Aggregation widget shows aggregate data. When you add it to a dashboard or select Edit on an existing widget, the Edit pane opens. To start, you select a data type:
- Log
- Metric
- Pattern
- Event
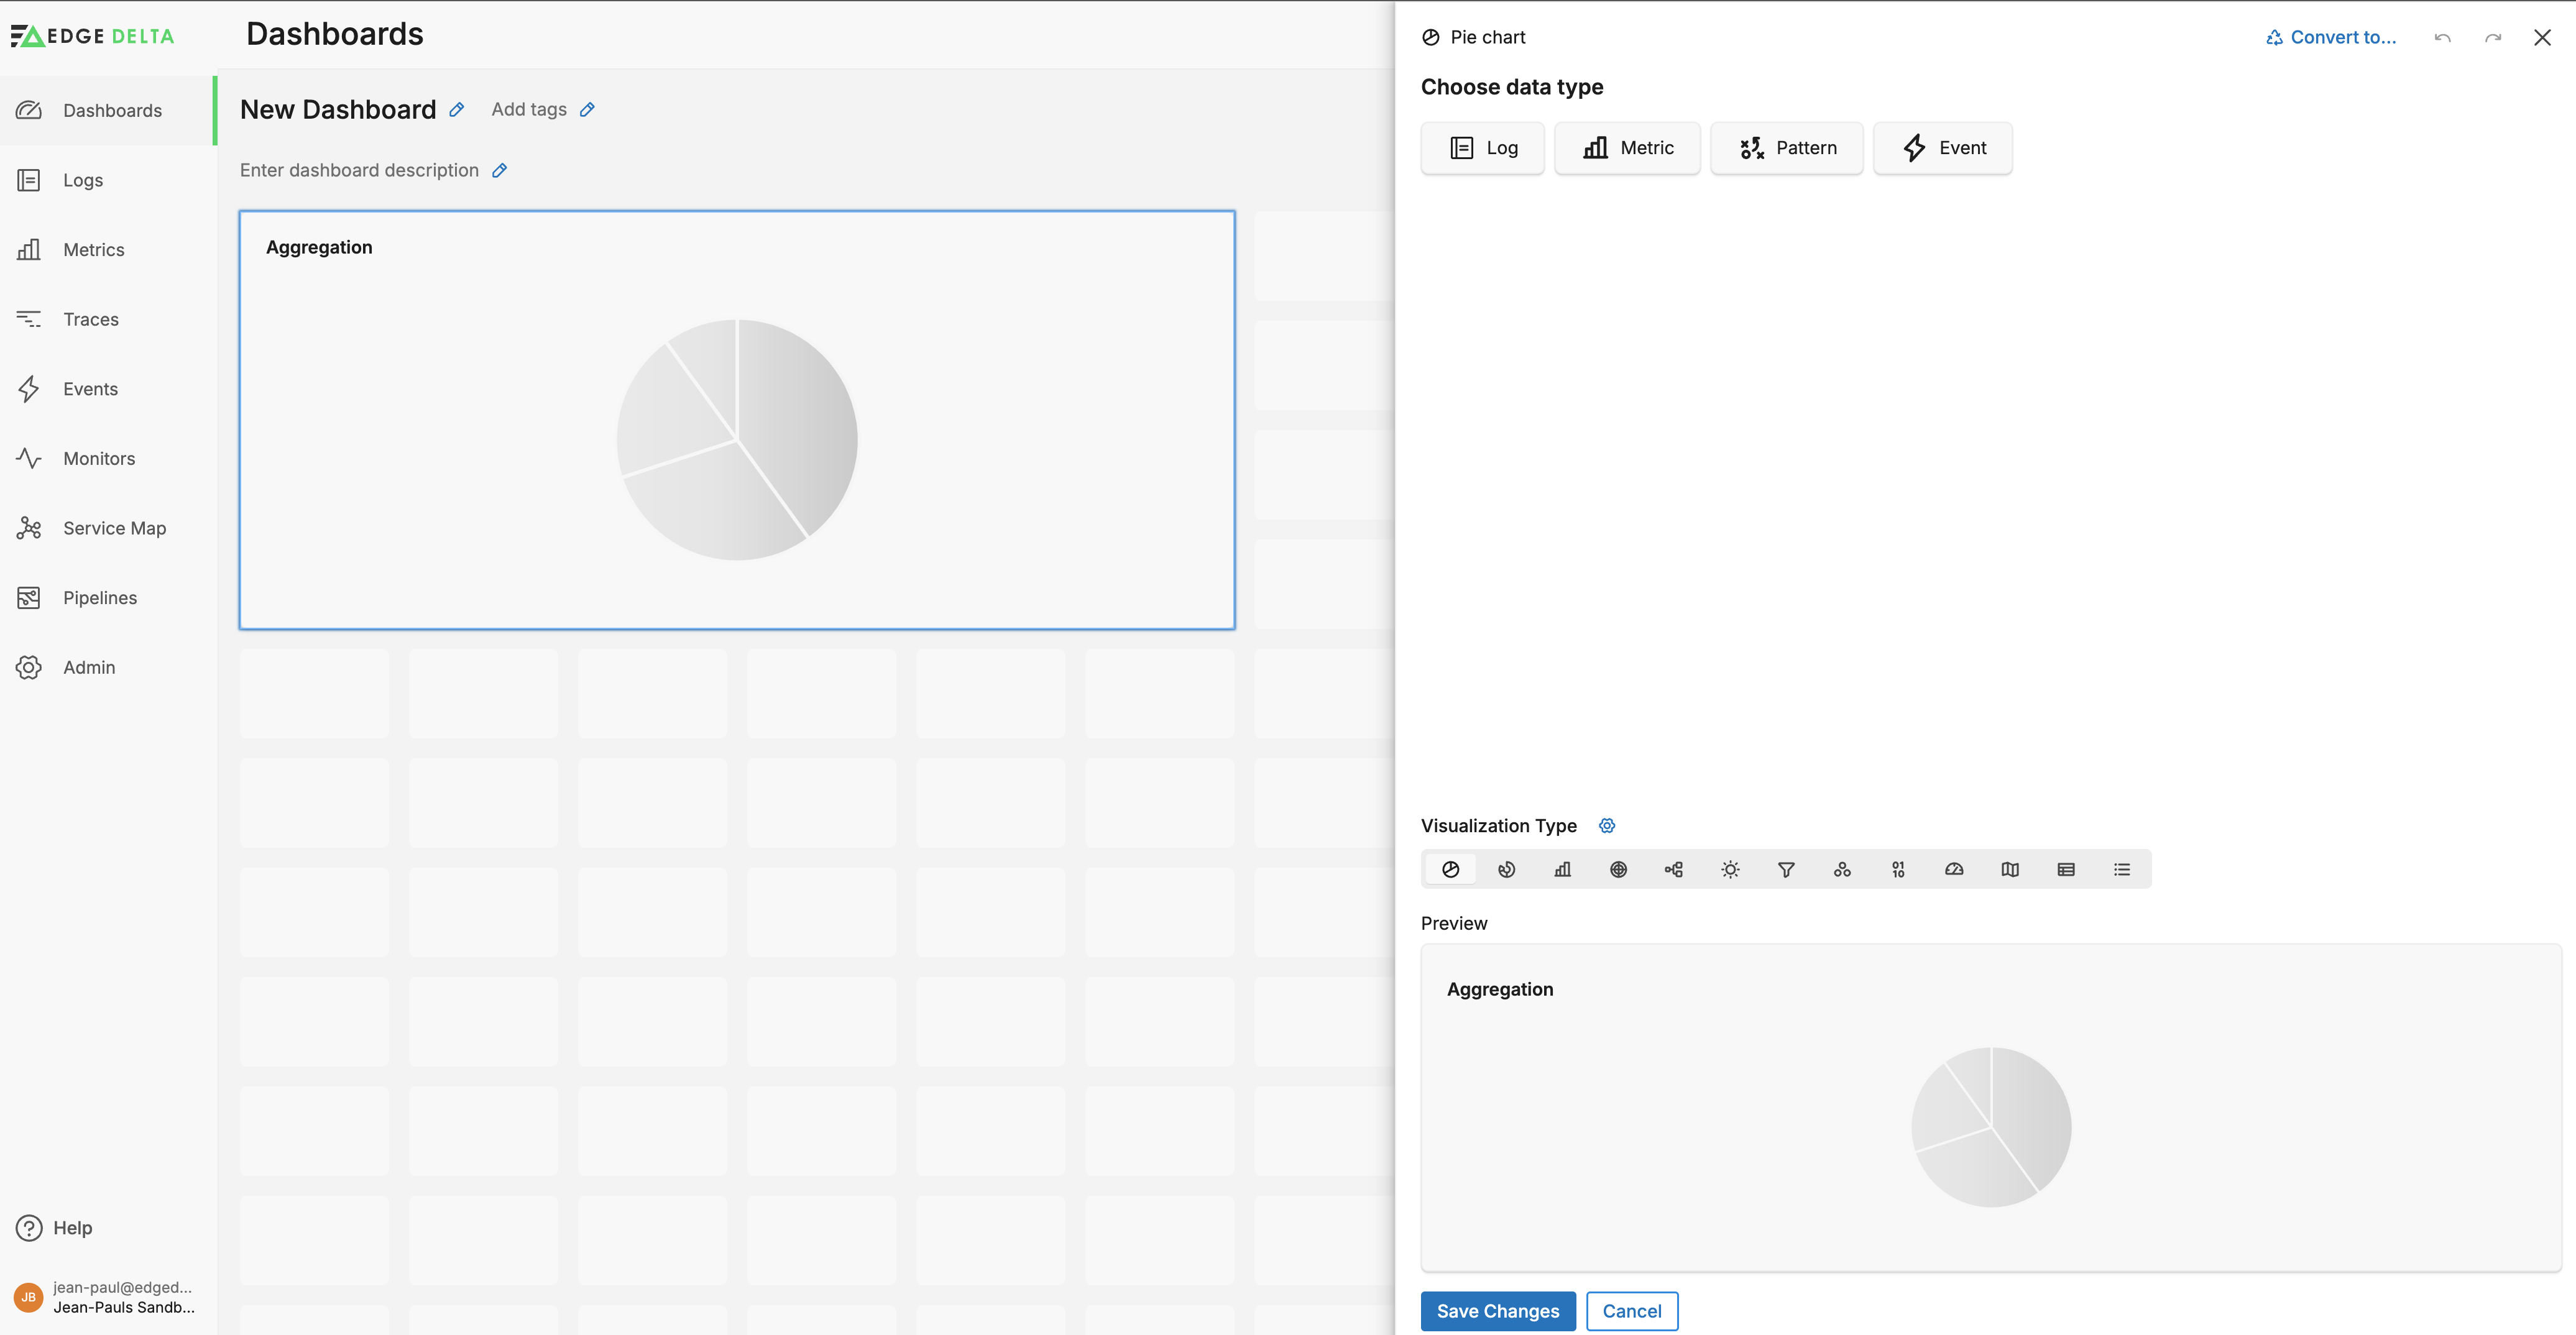
Visualization Type
The Visualization types change the way in which the data is rendered. For an Aggregate data type you can view data as a
- Pie Chart
- Donut Chart
- Column Chart
- Radar Chart
- Treemap
- Sunburst Chart
- Sankey Chart
- Bubble Chart
- Big Number
- Gauge
- Geographical Map
- Table
- List