Edge Delta Anomaly Metrics
4 minute read
Overview
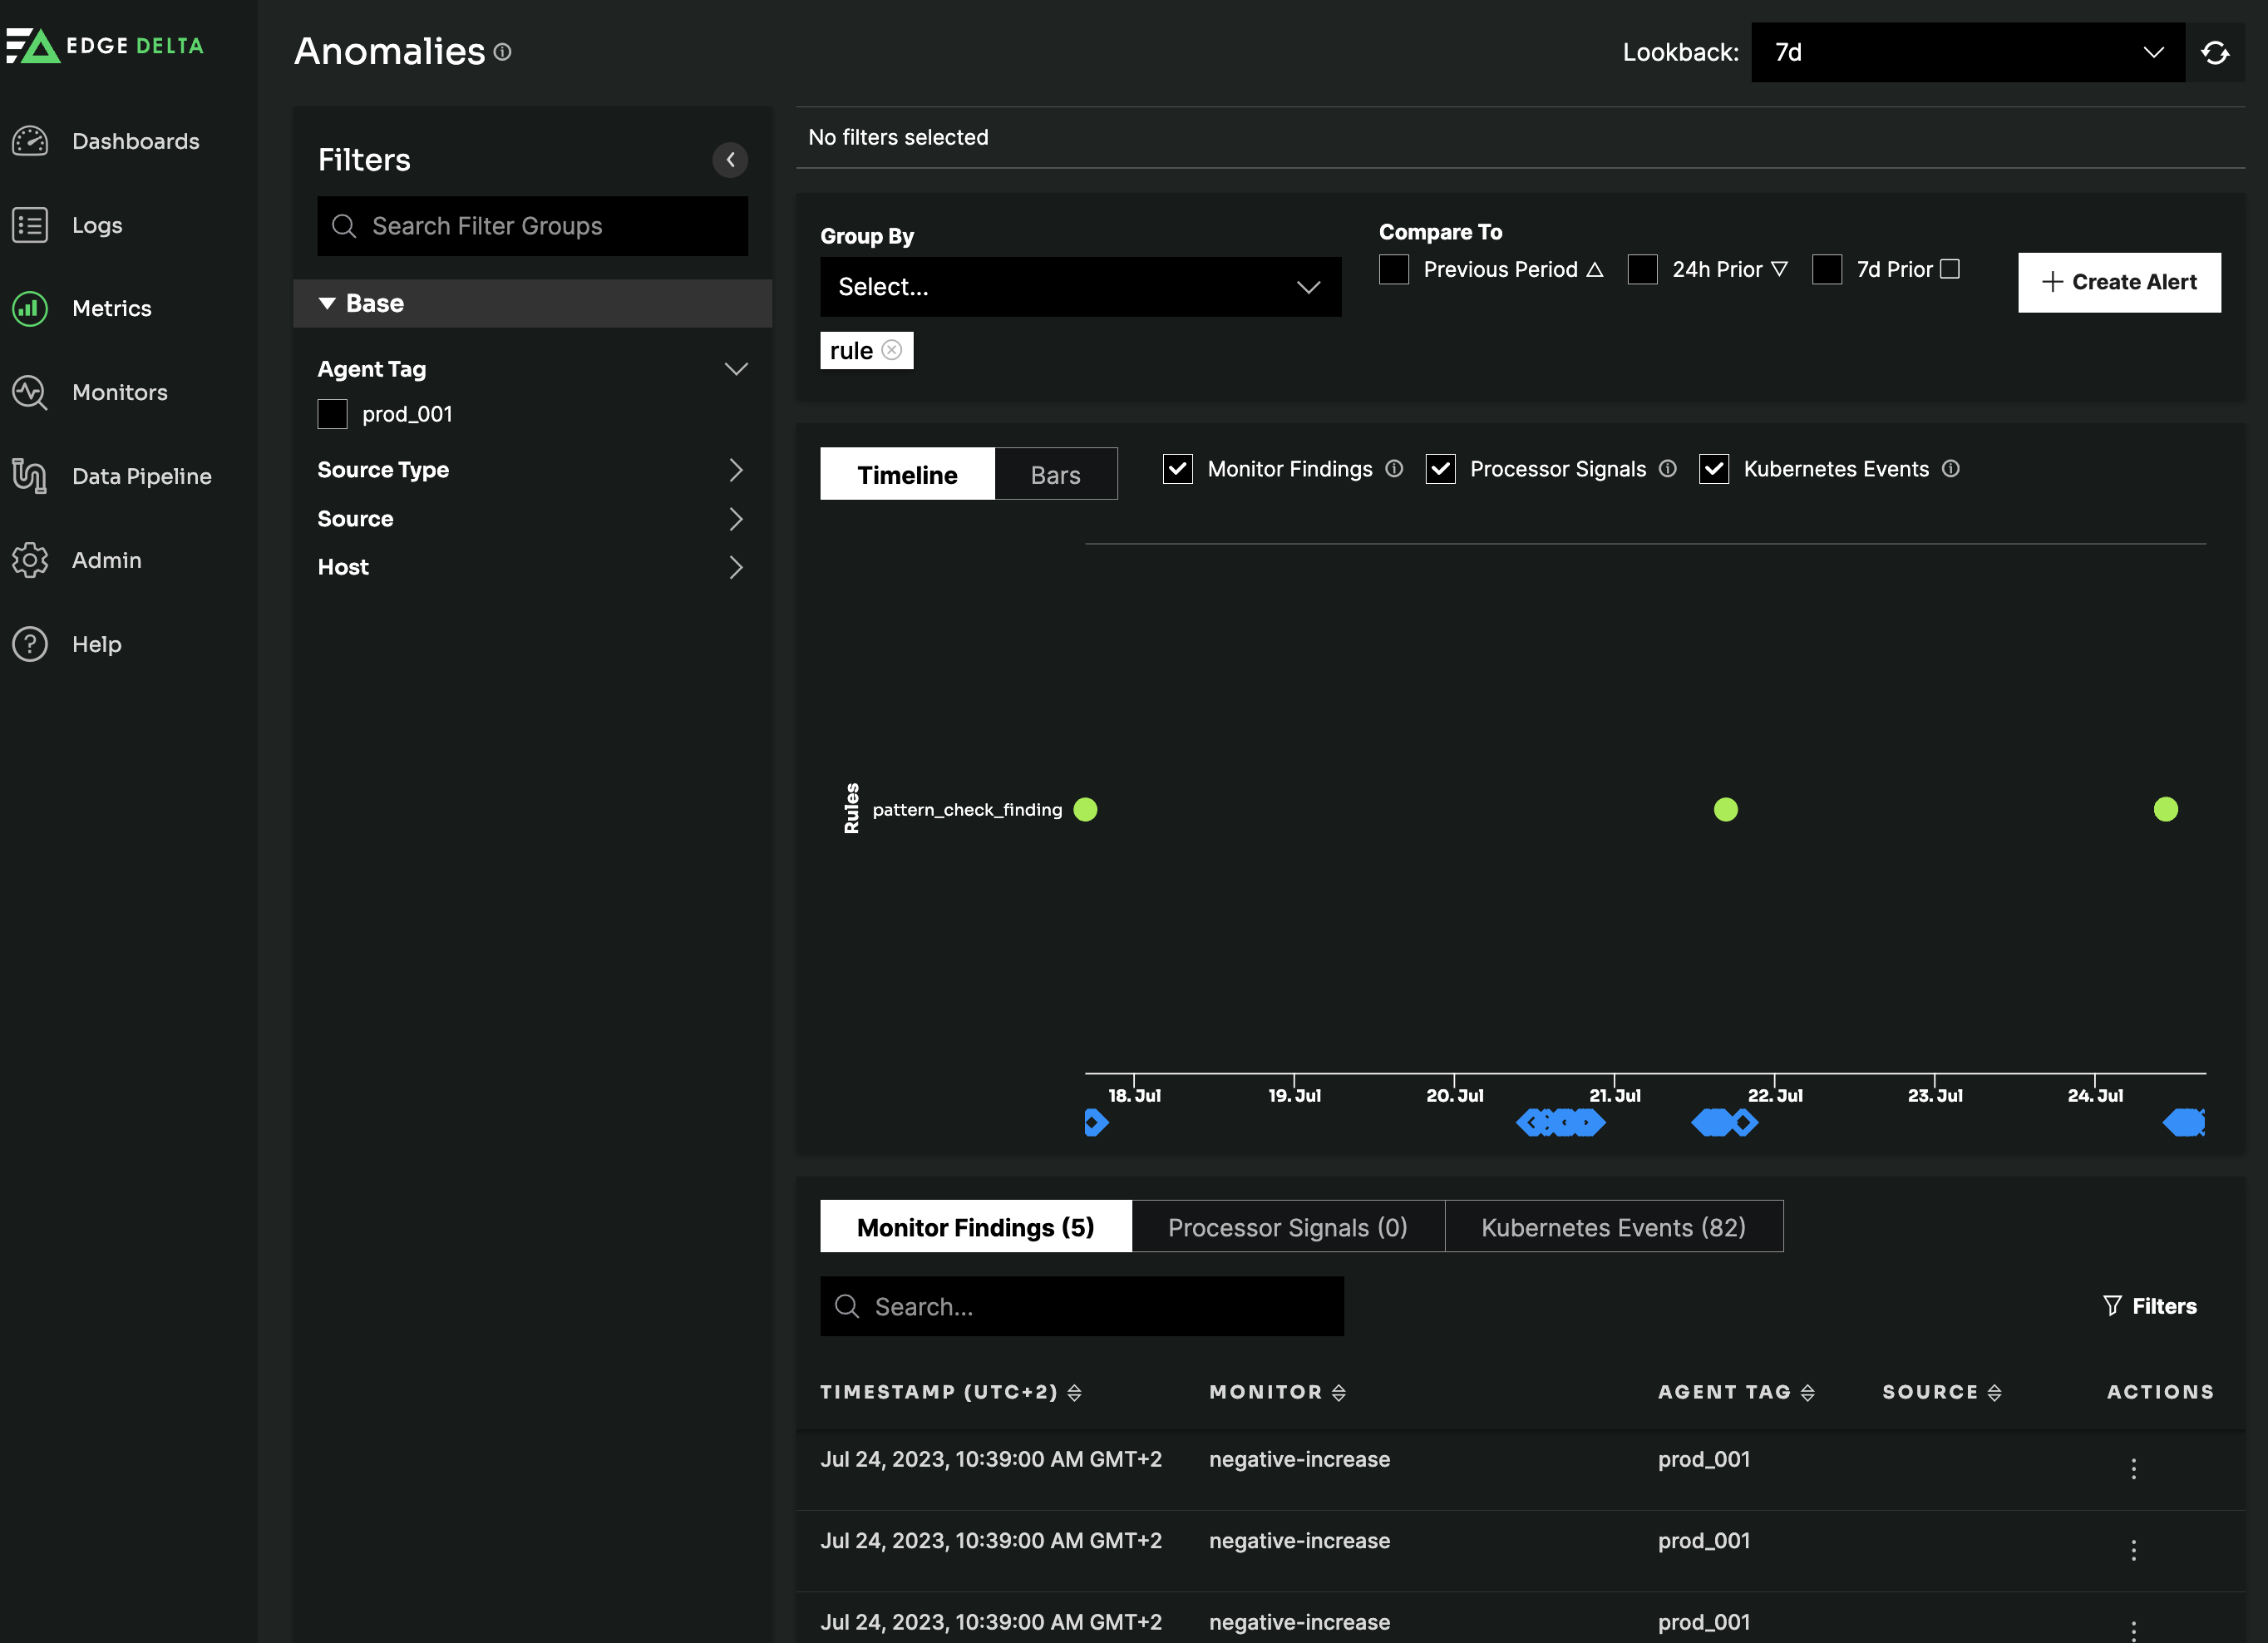
The Metrics - Anomalies page displays pattern-based anomalies, which comes from the configurations of your monitors, processors, and Kubernetes environment.
Filter Data
You can filter data on the Metrics page:
To specify the lookback period, click Lookback.
- To view data for a generic time frame, such as 1 hour, 4 hours, 1 day, etc, click Relative.
- To view data for a specific time frame, such as from February 1, 2022, at 1:15PM to February 7, 2022, at 1:14PM, click Custom.
In the Filters pane, filter by Agent Tag, Source Type, Source or Host.
In the Filter bar there are additional filters:
- Group By: This option allows you to filter data based on data sources. The listed data sources are based on the selected tag and source type.
- Previous Period: Displays a triangle in the chart to indicate if detection for the signal, finding, or event increased or decreased in the previous lookback period.
- 7d Prior: Displays an inverted triangle in the chart to indicate if detection for the signal, finding, or event increased or decreased in the previous week.
- 24h Prior: Displays a square in the chart to indicate if detection for the signal, finding, or event increased or decreased in the previous day.
Anomalies Graph
The Anomalies chart can switch between a Timeline chart and a Bar chart. It can also filter on Monitor Findings, Processor Signals, and Kubernetes Events:
Bar Graph
The bar chart shows the name of the processor whose configuration triggered the signal in the legend. The x-axis shows the count of times that the signal was triggered, while the y-axis shows the date and time when the signal was triggered.
Timeline Graphs
Processor Signals
- Severity: A low, medium, and high setting to indicate the severity of a signal. Most signals are considered a medium severity.
- EDAC: The unique, internal ID used to reference the signal.
- Timestamp: The date and time when the signal was triggered.
- Rule: The name of the processor that triggered the signal.
Monitor Findings
- Severity: A low, medium, and high setting to indicate the severity of a signal. Most signals are considered a medium severity.
- Causes: The monitor or custom metric that triggered the finding.
- Finding ID: The unique, internal ID used to reference the finding.
- Timestamp: The date and time when the signal was triggered.
- Rule: The name of the processor that triggered the signal.
Kubernetes Events
To view events in the graph, you need to select Monitor Findings or Processor Alerts, as well as Kubernetes Events.
- The green text displays a brief description of the detected event.
- Timestamp: The date and time when the signal was triggered.
- Agent Tag: The tag associated with the Fleet that triggered the event.
- Namespace: The name of the namespace where the event was detected.
- Controller Logical Name: The name of the controller that observed the event.
- Container Name: The name of the Kubernetes container where the event was detected.
Anomalies Table
The table lists the anomalies detected for further investigation. You can switch between Monitor Findings, Processor Signals, and Kubernetes Events.
Processor Signals
- Timestamp: This column displays the date and time that the signal was detected.
- EDAC (Edge Delta Anomaly Context): This column displays an internal identification, which is also known as a capture ID.
- Metric: This column displays the metric whose configuration triggered a signal. A metric is configured via a processor.
- Host: This column displays the host name where the agent is deployed.
- Tag: This column displays the tag associated with the Fleet whose configuration triggered the signal.
- Source: This column displays the source file, directory, or container of the signal.
- Actions: When you click Actions, the Investigation page opens to view detailed information for the selected signal. This page also displays contextual logs and log patterns.
Monitor Findings
- Timestamp: The date and time that the finding was detected.
- Monitor: The monitor or custom metric that triggered the finding.
- Agent Tag: The tag associated with the Fleet that triggered the finding.
- Source: he source file, directory, or container of the finding.
- Actions: Click Actions - View Investigation to see data for the tag and source that relates to the selected finding.
Kubernetes Events
- Timestamp: The date and time that the event was detected.
- Description: A description of the event.
- Agent Tag: The tag associated with the Fleet that triggered the finding.
- Source: The source file, directory, or container of the finding.
- Actions: Click Actions - View Details to see data for the tag and source that relates to the selected event.