Edge Delta K8s Log Overview
less than a minute
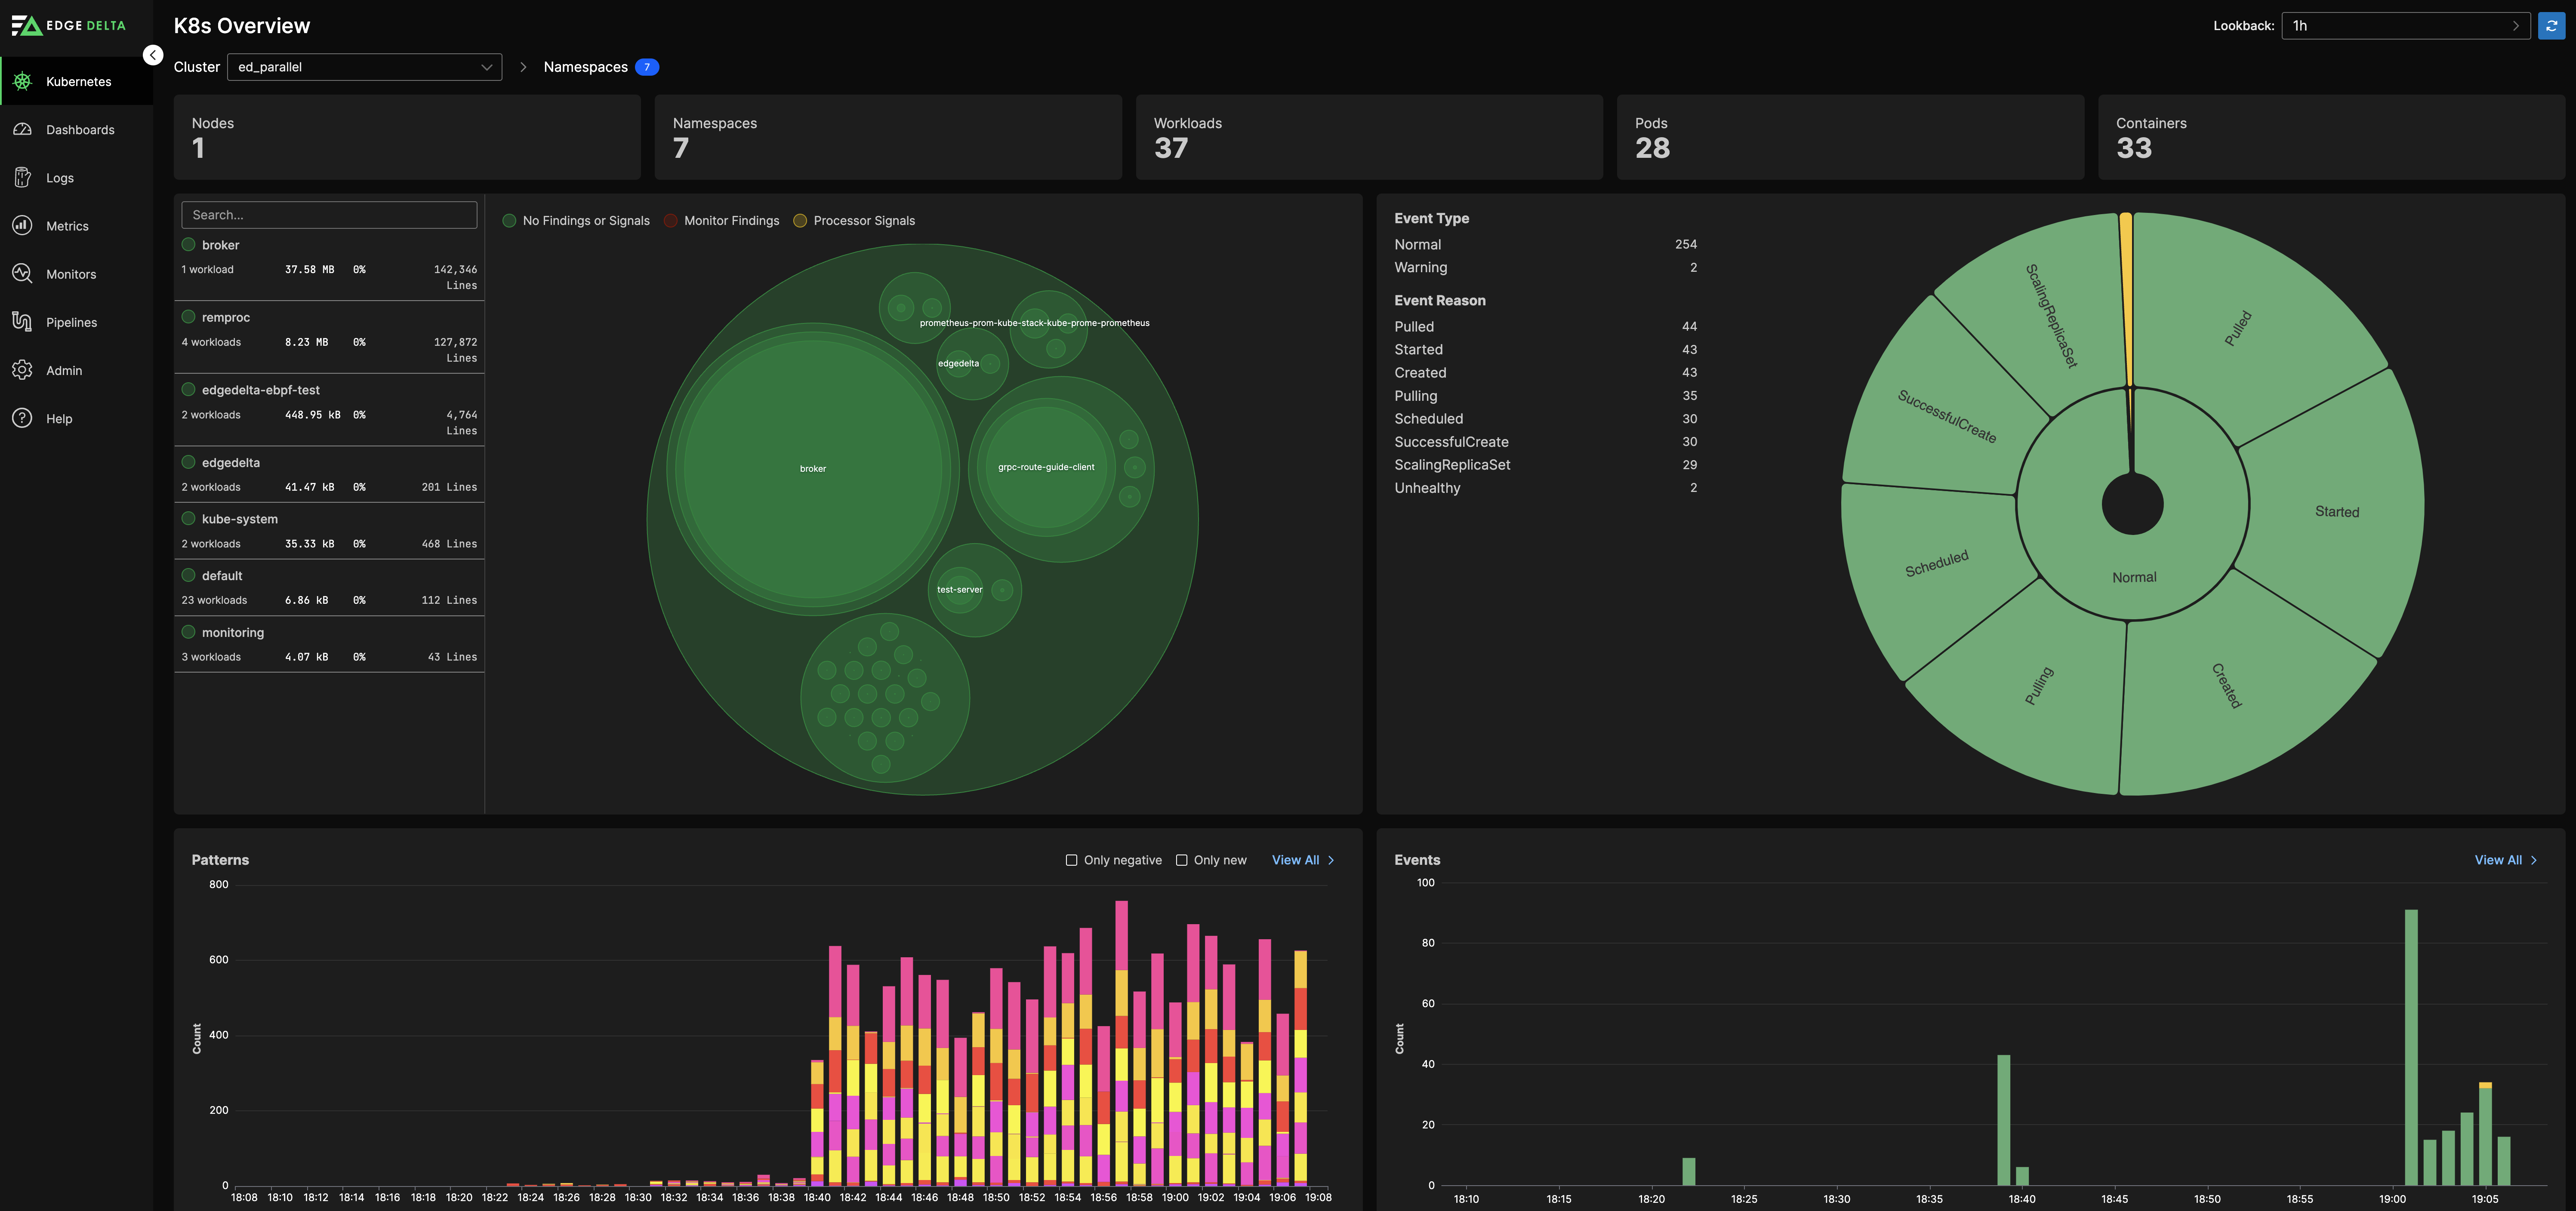
Click Dashboards - K8s Overview (or Kubernetes - Overview on some versions) for the Kubernetes components that are being monitored by an agent.
You need at least one workload in your cluster for data to populate the Kubernetes Overview.
It displays a graphical representation of the monitoring plane with the largest circle being the Edge Delta Agent daemonset. The bigger the circle, the more logs the component is generating. Negative findings are indicated with a red circle.
An events graph summarizes kubernetes events by type and over time.
You can click each component to filter on it. You can also search for keyword such as the namespace name. If any negative patterns or other insights are detected they appear on this page and on the Logs - Patterns page.