Edge Delta Default Dashboards
4 minute read
Overview
There are a number of default dashboards configured in Edge Delta out of the box:
K8s Overview
The Kubernetes Overview dashboard provides a comprehensive view of the Kubernetes cluster’s state, focusing on resource distribution and event occurrences.
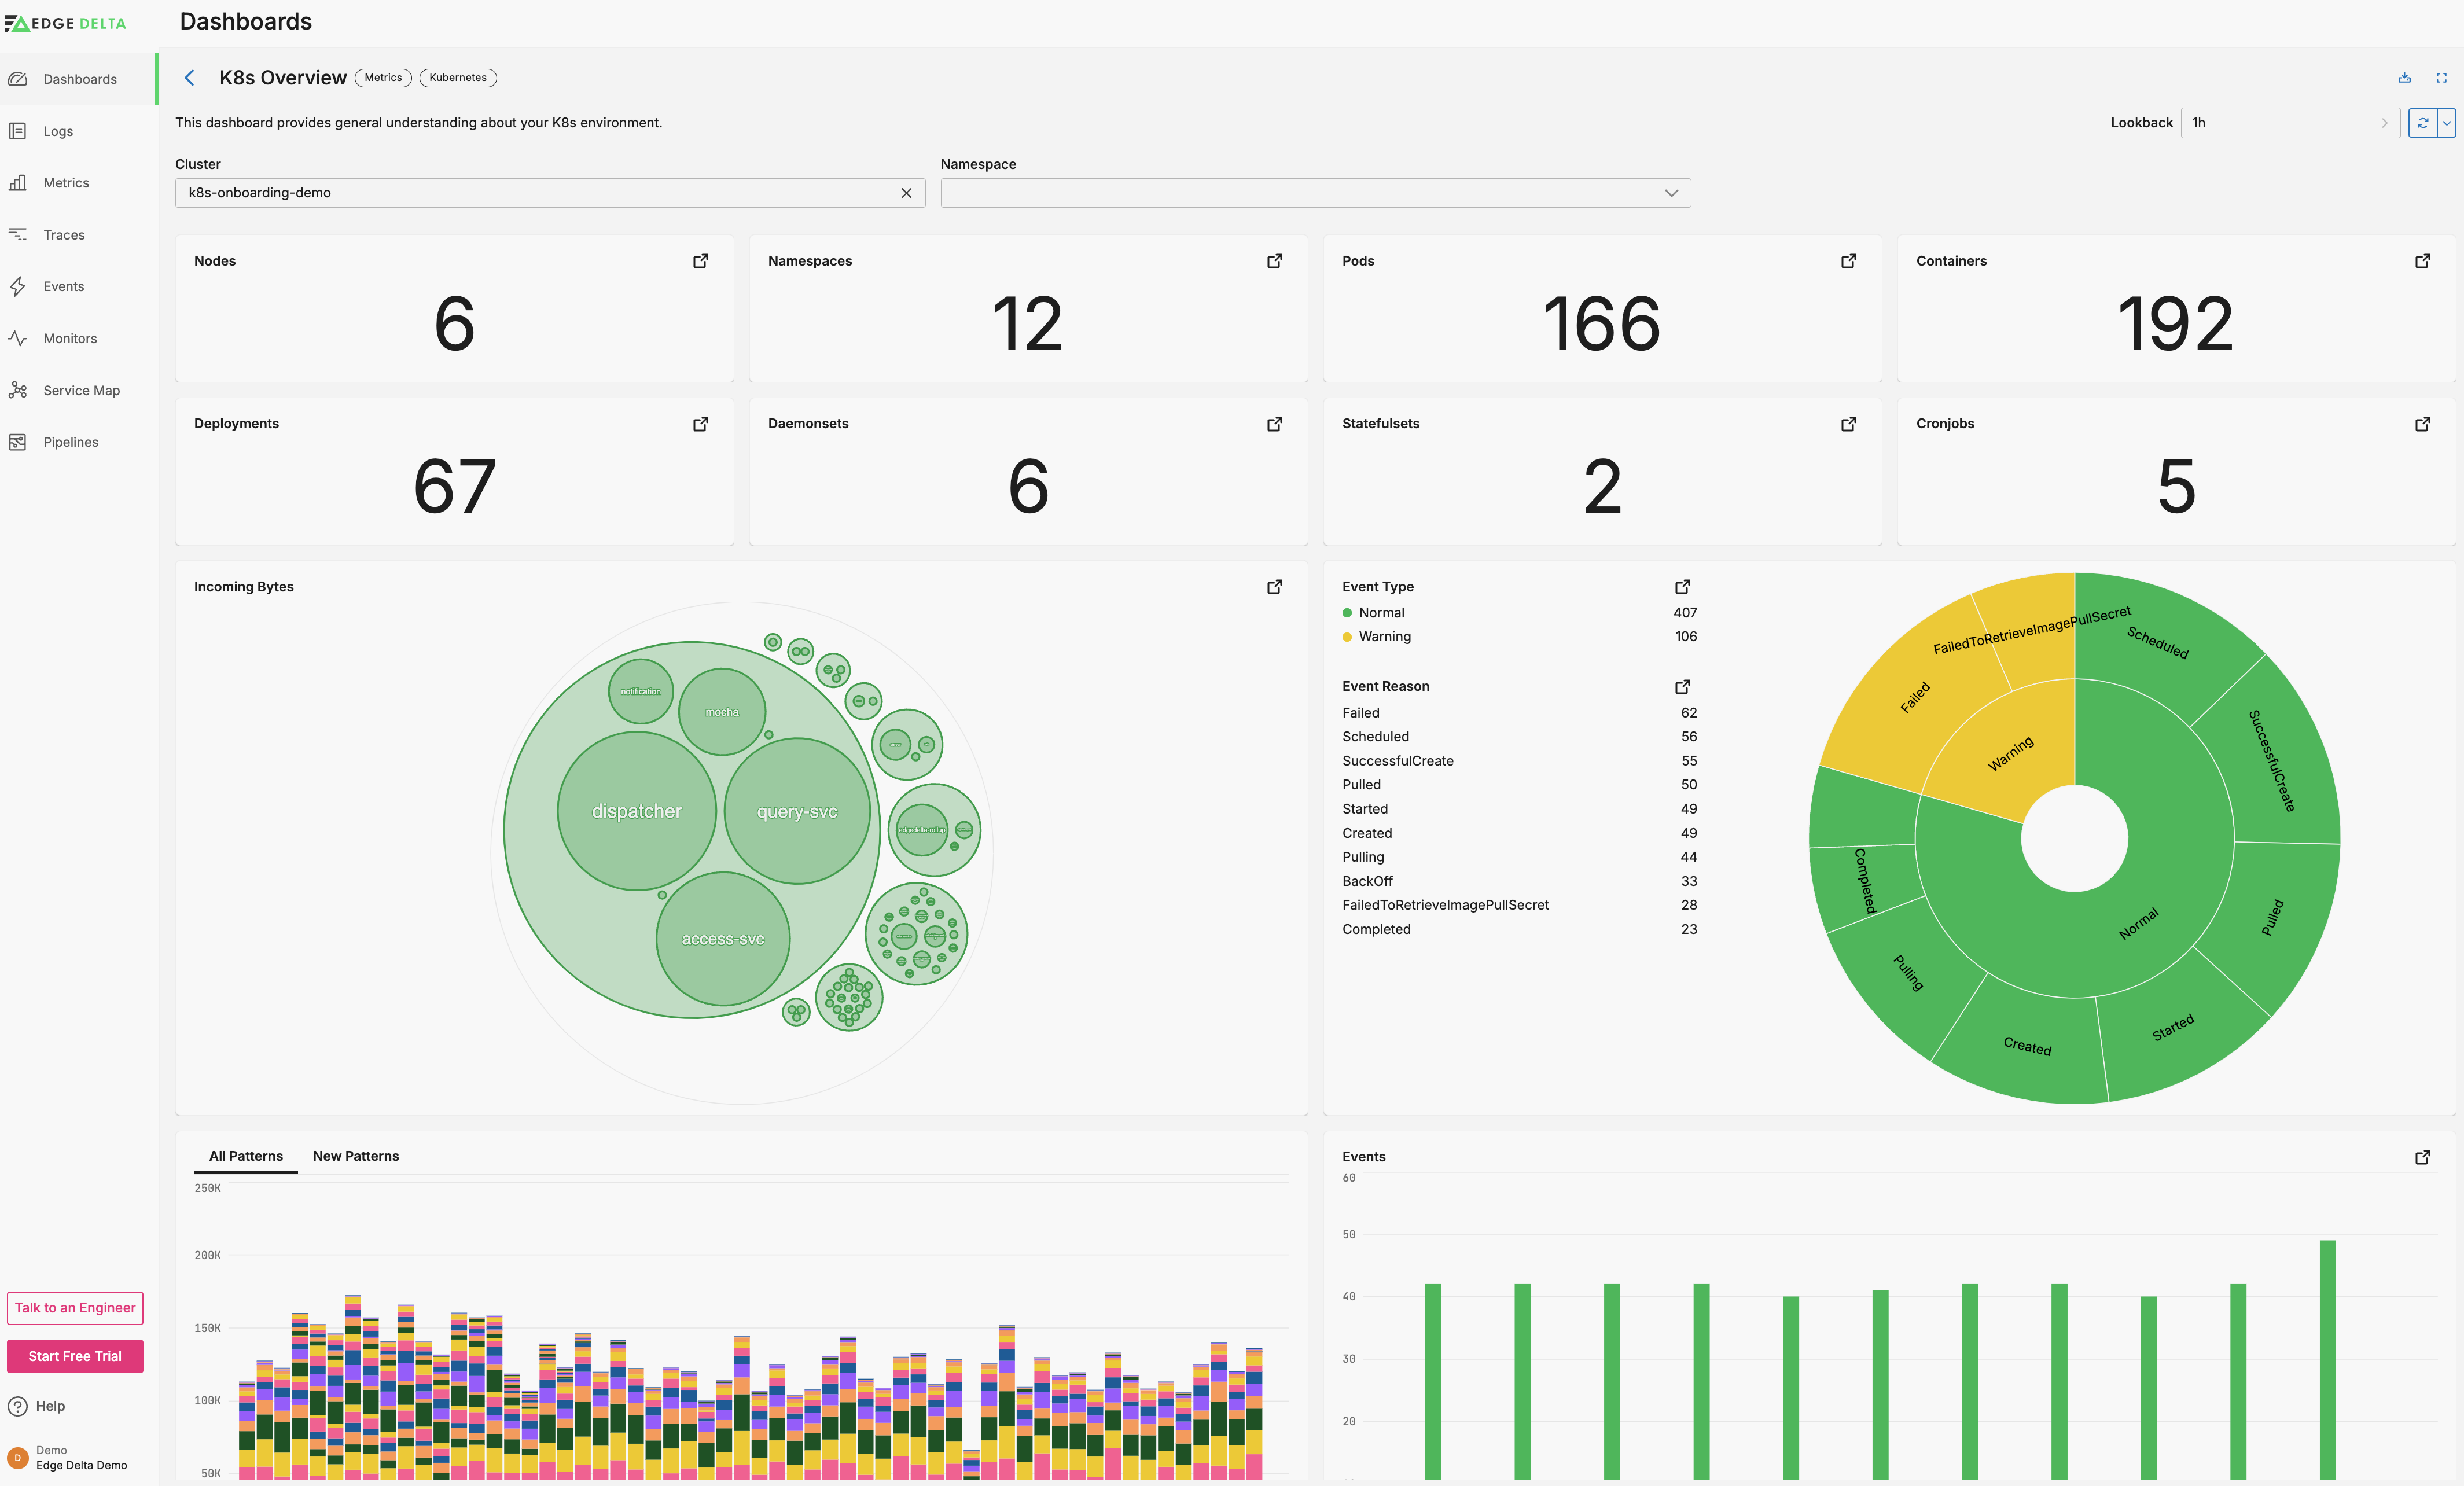
- Cluster is a variable to filter the visualizations by cluster (pipeline name).
- Total Nodes displays the total number of unique nodes (
count_uniqueofhost.name) within the selected cluster. - Total Namespaces shows the number of unique namespaces (
count_uniqueofk8s.namespace.name) within the selected cluster. - Total Pods presents the count of unique running pods (
count_uniqueofk8s.pod.name) within the selected cluster and namespace. - Total Containers illustrates the count of unique running containers (
count_uniqueofk8s.container.name) within the selected cluster and namespace. - Total Deployments displays the number of unique deployments (
count_uniqueofk8s.deployment.name) within the selected cluster and namespace. - Total Daemonsets shows the count of unique daemonsets (
count_uniqueofk8s.daemonset.name) within the selected cluster and namespace. - Total Statefulsets presents the number of unique statefulsets (
count_uniqueofk8s.statefulset.name) within the selected cluster and namespace. - Total Cronjobs illustrates the count of unique cronjobs (
count_uniqueofk8s.cronjob.name) within the selected cluster and namespace. - Events by Severity visualizes the distribution of events by severity (
severity_text) within the selected cluster and namespace. - Patterns by Type displays a breakdown of pattern occurrences by type (
event.type) within the selected cluster and namespace. - All/New Patterns provides tabs to view all patterns or only new patterns within the selected cluster and namespace.
- Events shows a bar chart of events over time within the selected cluster and namespace.
Note: This dashboard requires KSM and Node Exporter installed in the same cluster as your pipeline. In addition, you must have a Kubernetes Metrics source node connected to the Edge Delta Destination node to collect the required metrics and deliver them to the Edge Delta back end. See Ingest Kubernetes Metrics. Finally, agent version 1.24.0 is required to enable this dashboard.
Observability Posture
The Observability Posture dashboard looks back 1 hour by default.
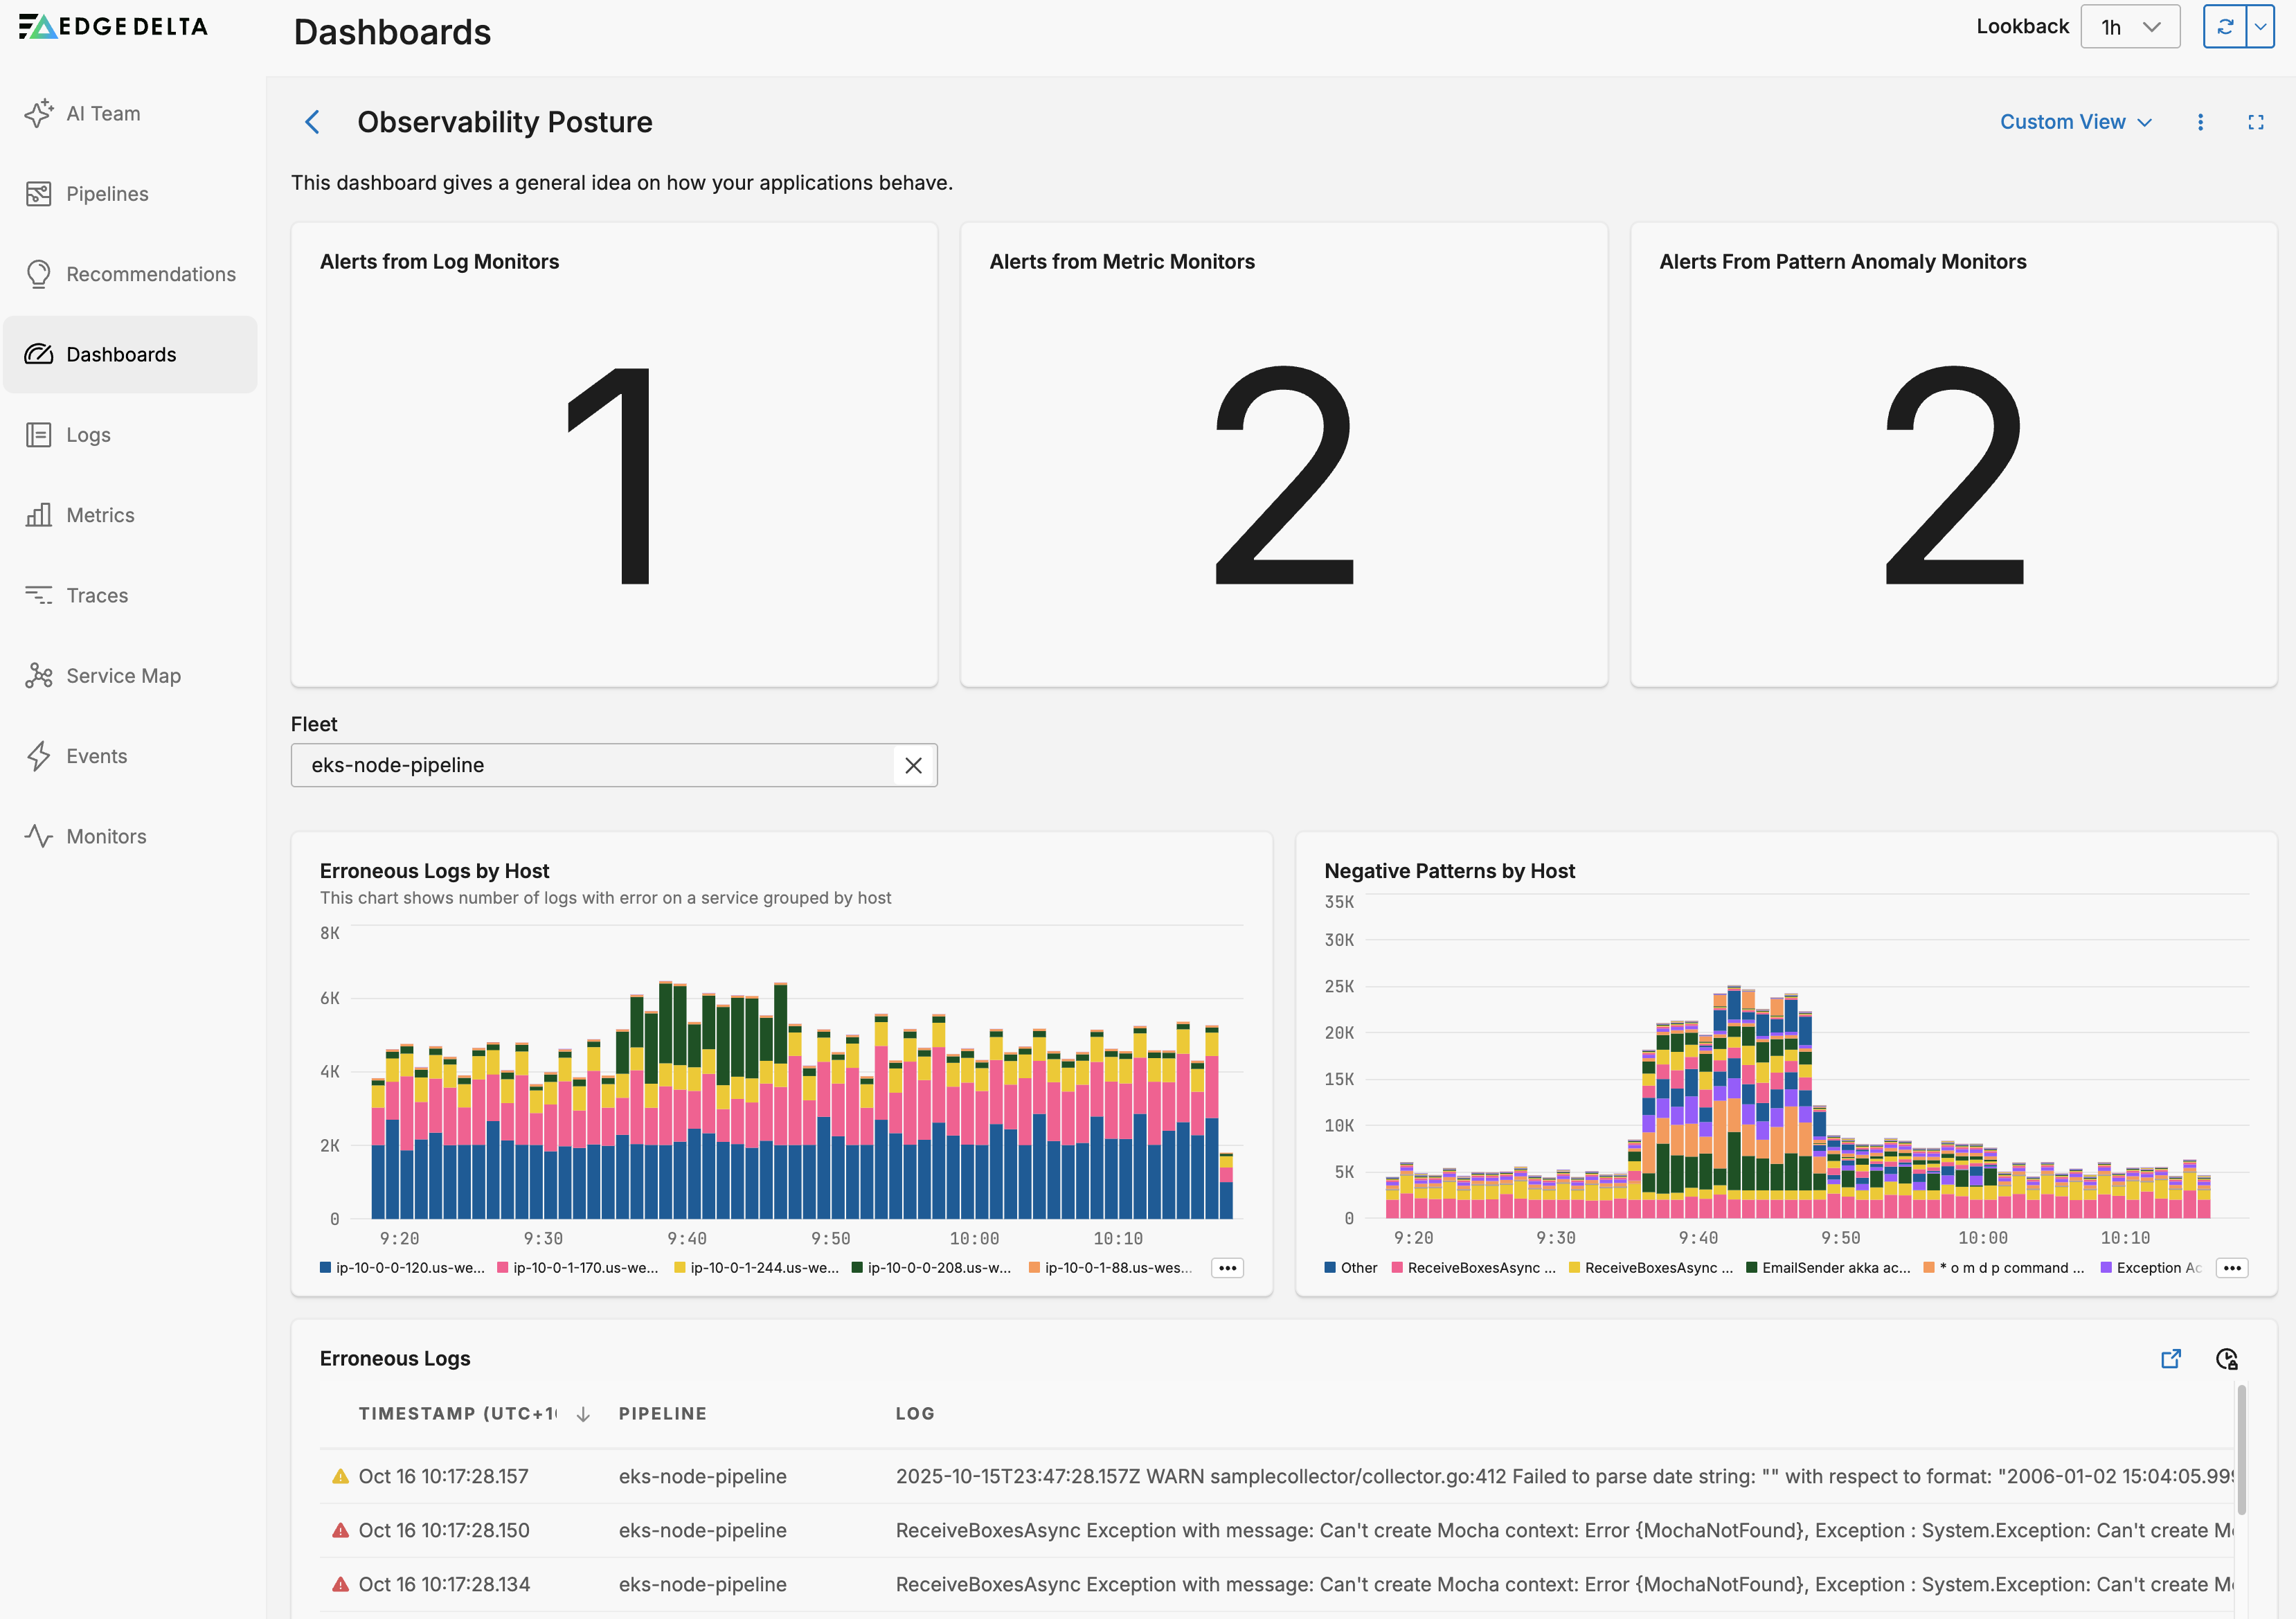
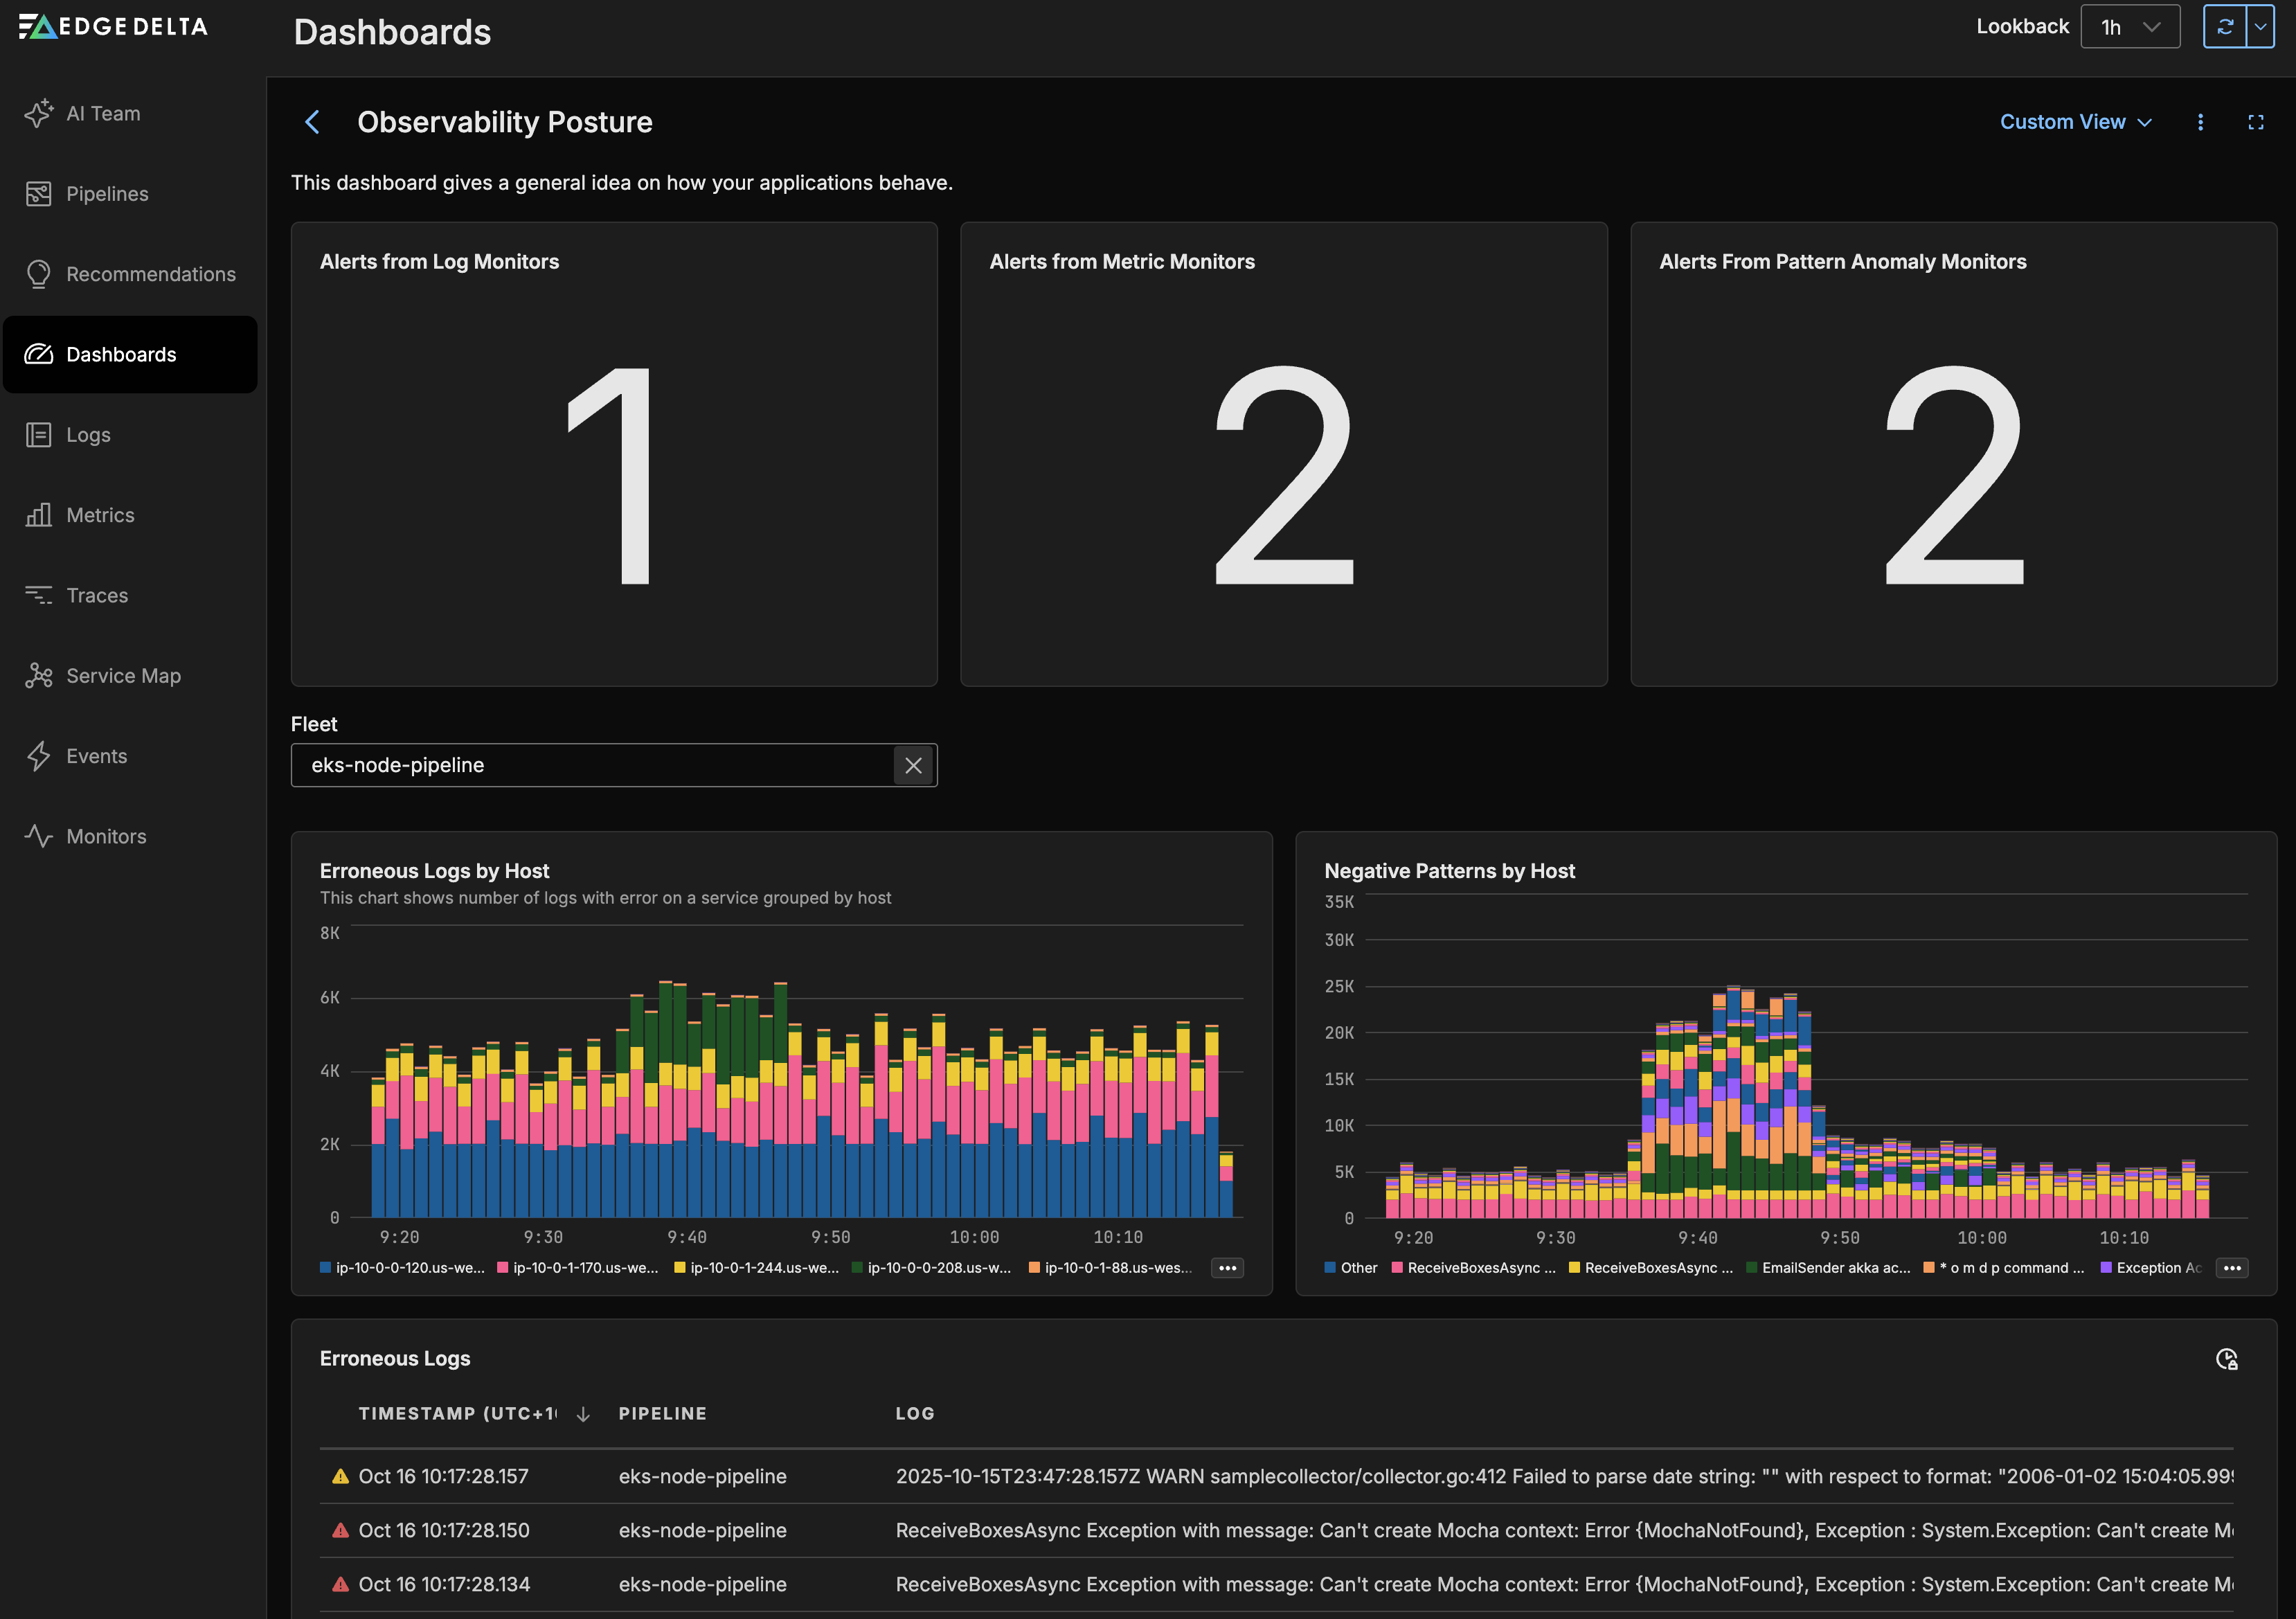
- Alerts from Log Monitors shows a count of
severity_text:ALERTwithevent.type:log_thresholddata items for the lookback period. This counts the number of alerts issued by a log monitor. - Alerts from Metric Monitors shows a count of
severity_text:ALERTwithevent.type:metric_thresholddata items for the lookback period. This counts the number of alerts issued by a metric monitor. - Alerts From Pattern Anomaly Monitors shows a count of
severity_text:ALERTwithevent.type:pattern_anomalydata items for the lookback period. This counts the number of alerts issued by a Pattern monitor. - Pipeline is a variable that you can select to filter the following widgets by pipeline. The Alerts from Monitors widgets are not affected by this selection.
- Erroneous Logs by Host shows a graph of the count of logs containing the word
error, grouped by host for the selected pipeline. - Negative Patterns by Host shows the pattern graph for the selected pipeline, grouped by host.
- Erroneous Logs shows the table of logs containing the word
errorfor the lookback period. You can also adjust the lookback period for this widget independently.
Top Talkers
This dashboard provides comprehensive visibility into traffic patterns, identifying main data “talkers” whether by byte volume or lines of communication.
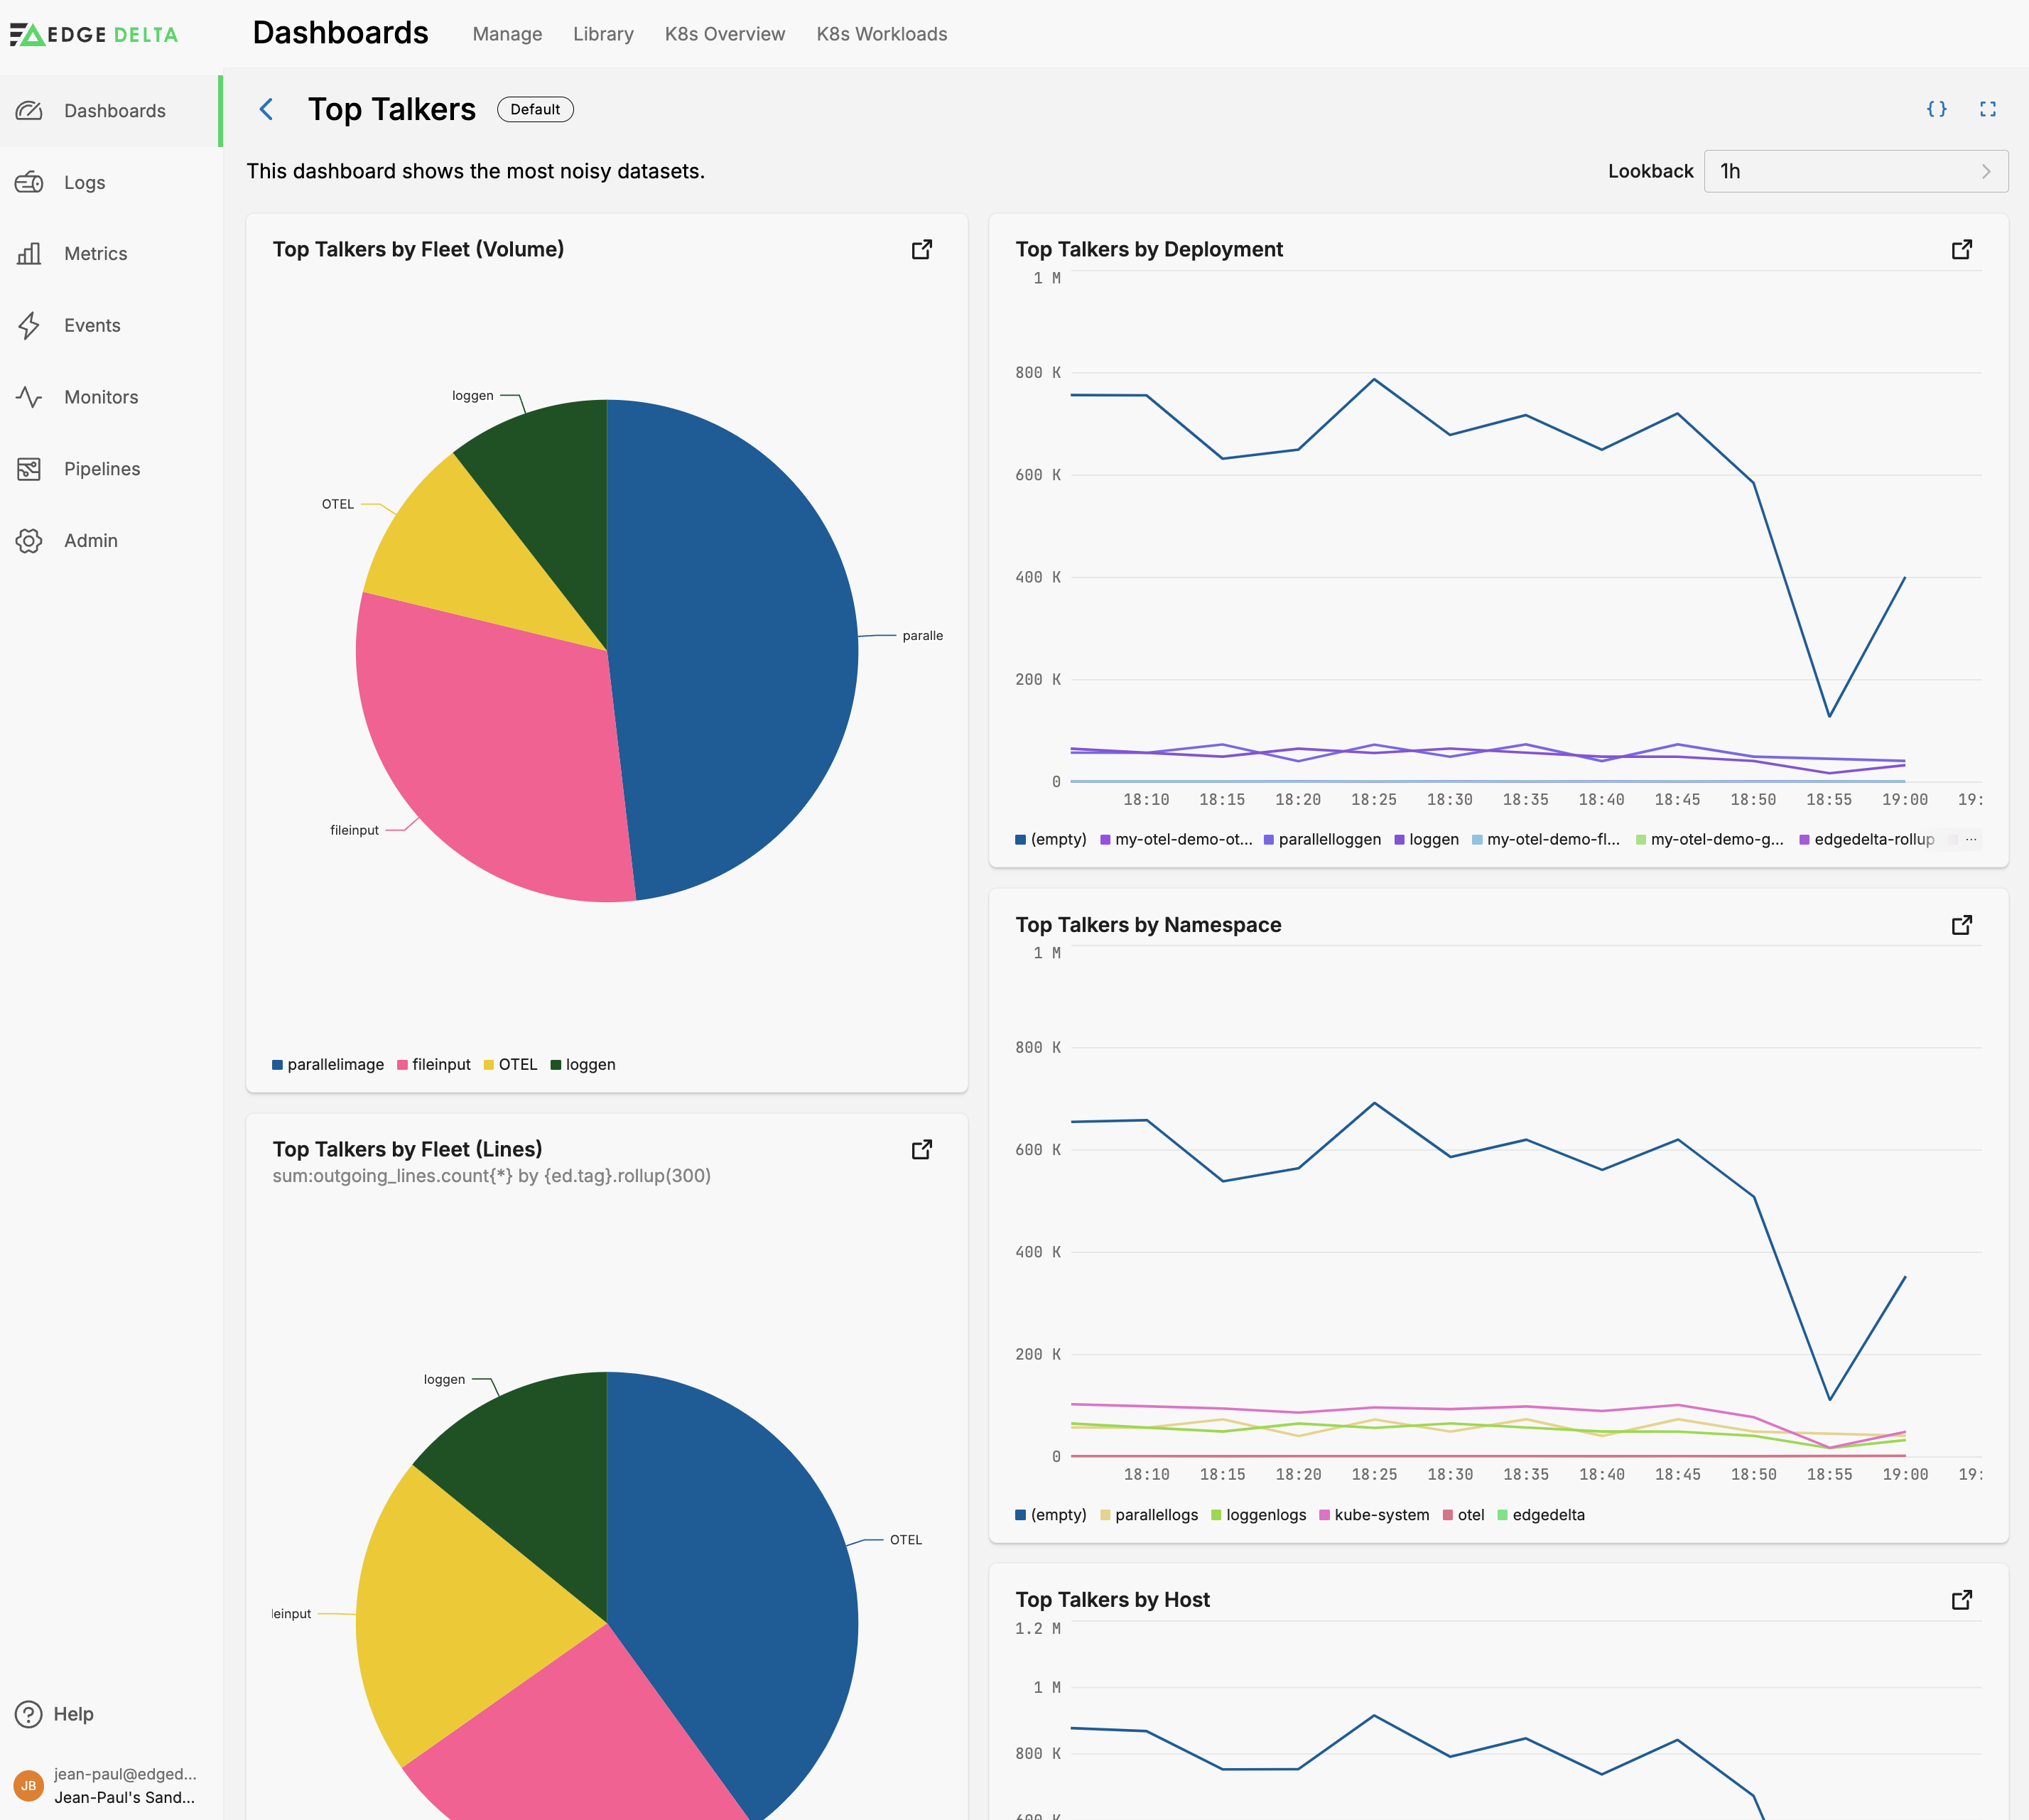
- Top Talkers by Pipeline (Volume) displays a breakdown of total incoming traffic volume (
ed.pipeline.read_bytes) by pipeline. - Top Talkers by Deployment visualizes the sum of incoming traffic (
ed.pipeline.read_bytes) grouped byk8s.deployment.nameover time. - Top Talkers by Namespace showcases the sum of incoming traffic (
ed.pipeline.read_bytes) grouped byk8s.namespace.name, providing insights into which namespaces have the most traffic. - Top Talkers by Host displays the
ed.pipeline.read_bytesmetric as a time series grouped byhost.name, identifying key hosts with significant traffic. - Top Talkers by Pipeline (Lines) illustrates the distribution of outgoing communication lines count (the
ed.pipeline.write_itemsmetric) grouped by pipeline (ed.tag), offering a volume perspective.
Pipeline Resource Usage
The Pipeline Resource Usage dashboard provides insights into pipeline resource utilization metrics across hosts.
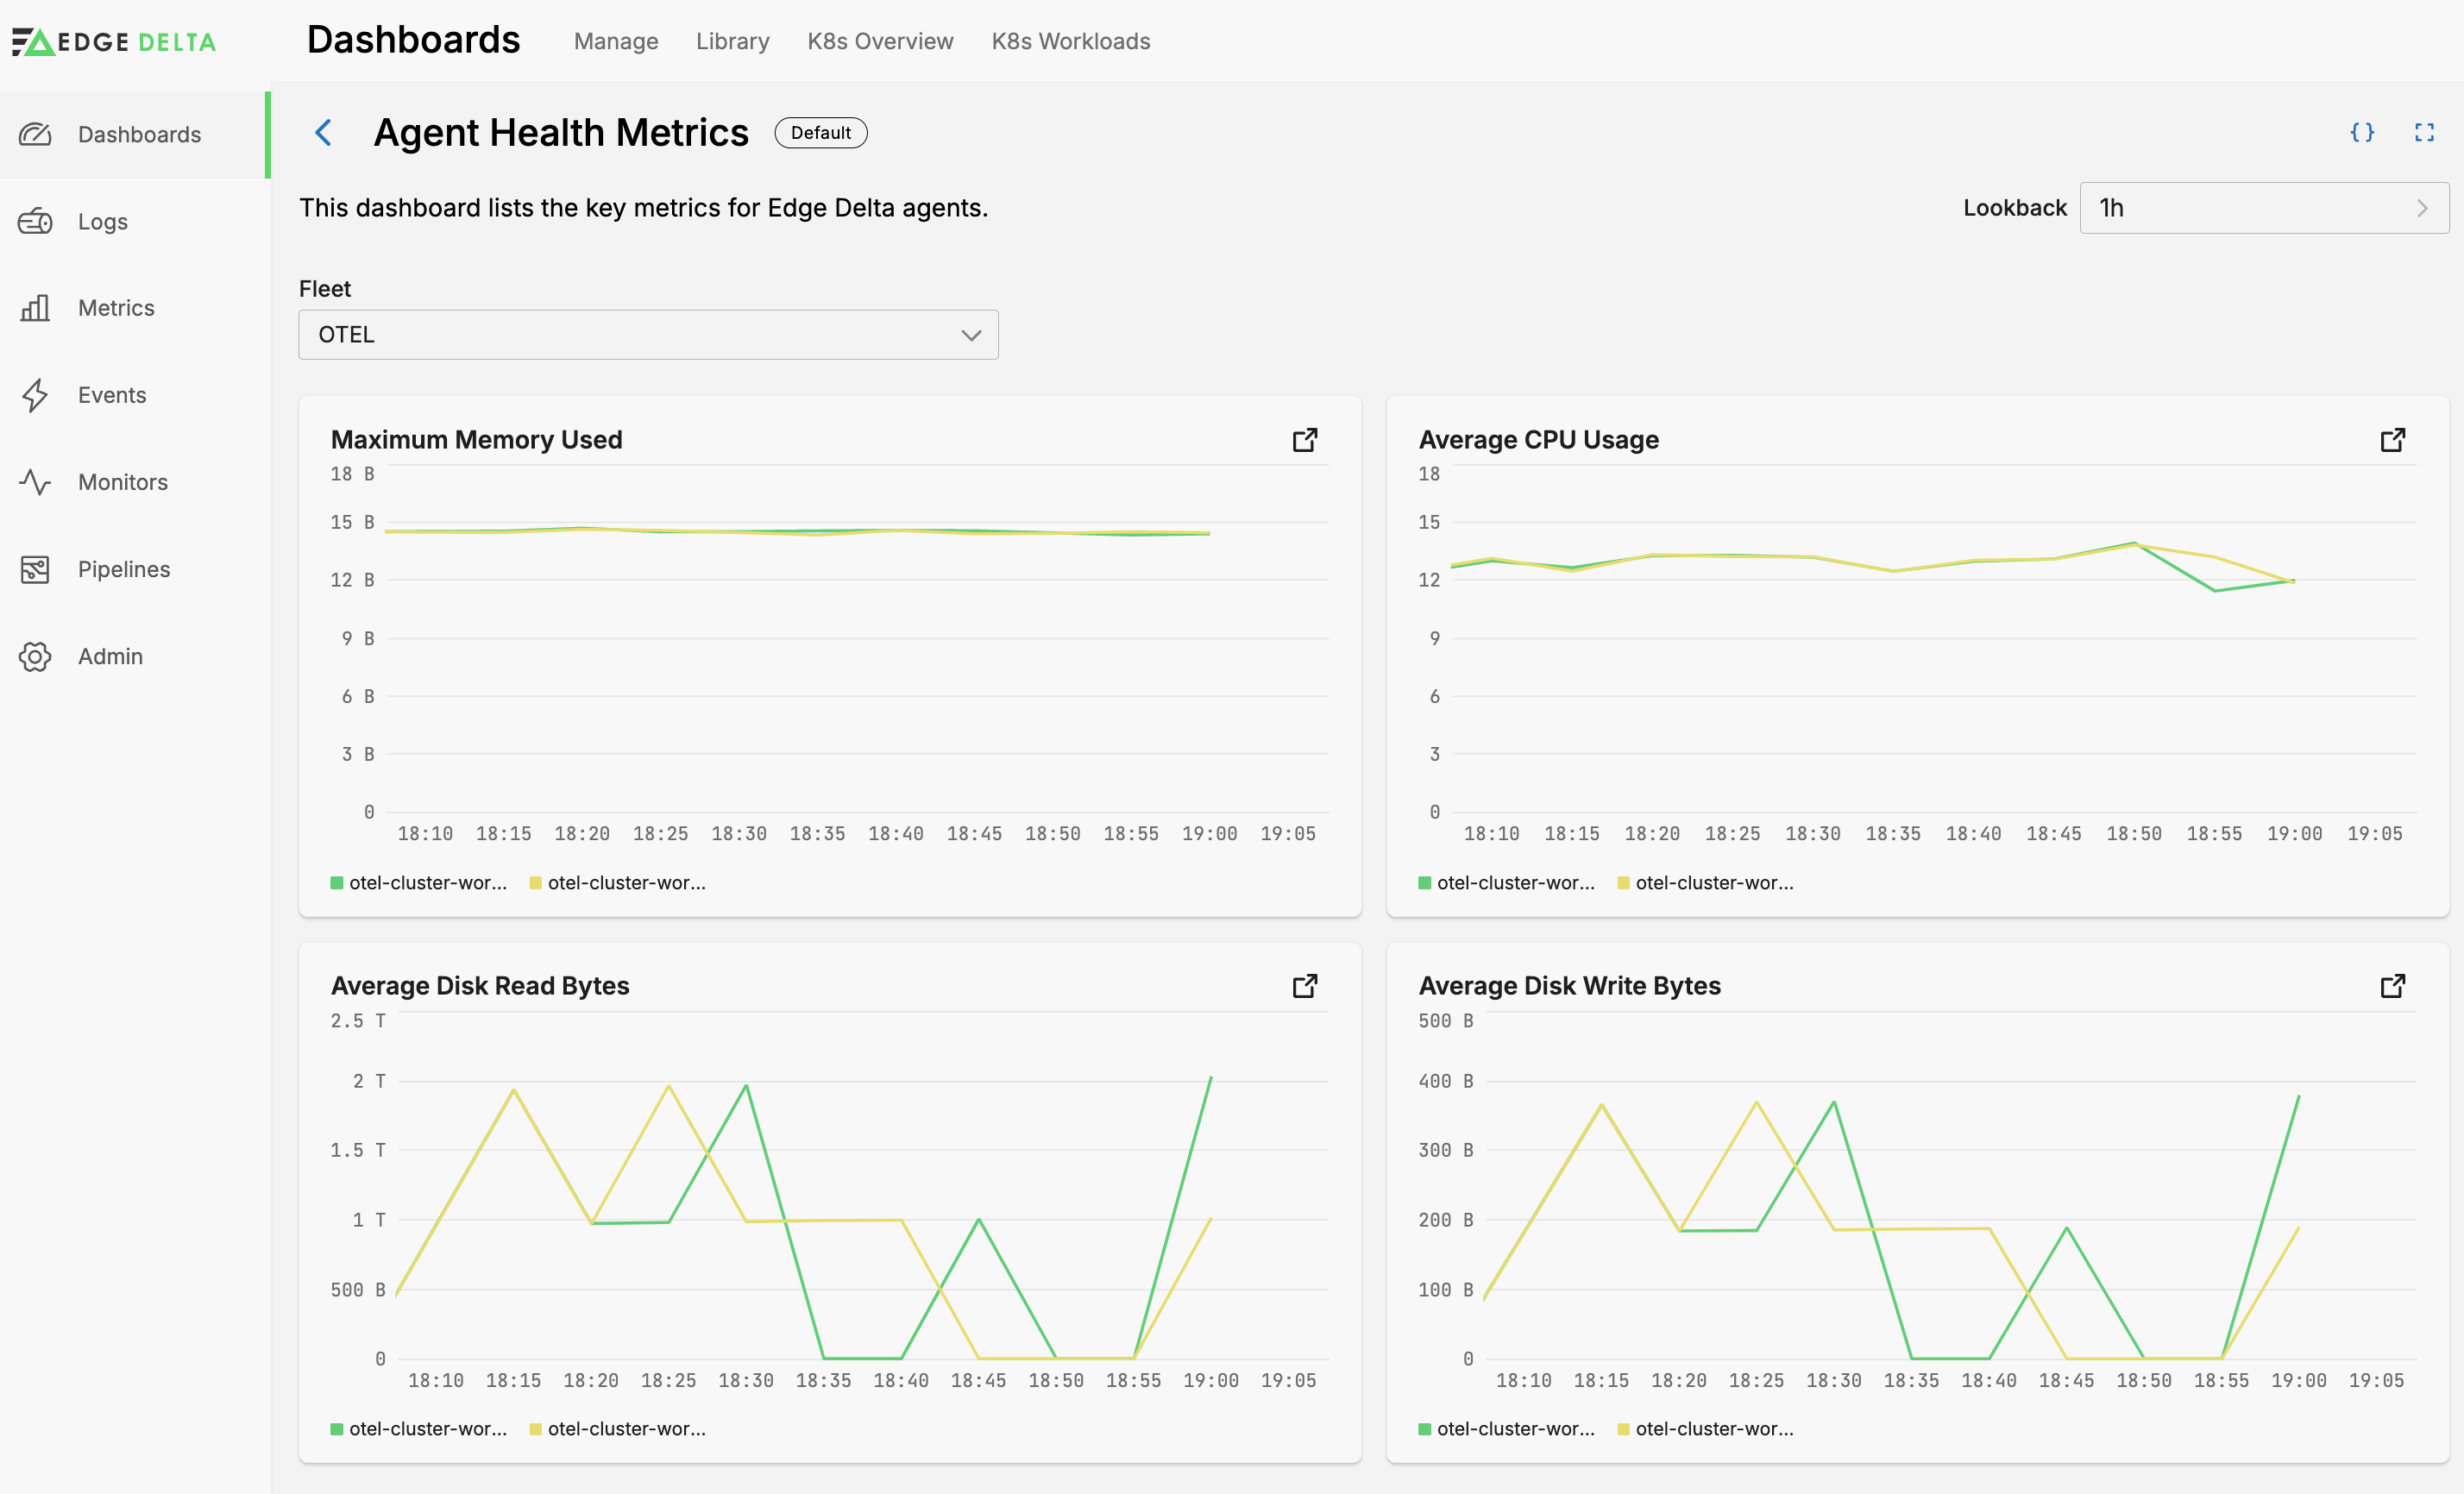
- Pipeline is a variable to filter the visualizations by pipeline.
- Average CPU Usage displays the average CPU system usage (the
ed.host.cpu.system.averagemetric) grouped byhost.namefor each host within the selected pipeline, giving an overview of processing load over time. - Maximum Memory Used shows the peak memory consumption per host (the maximum of
ed.host.memory.used.valueover a 5 minute rollup window grouped byhost.name), helping identify hosts that might be constrained by memory usage.