Quickstart: Extract and Aggregate Metrics with Edge Delta
4 minute read
Overview
Data items such as logs and traces often contain useful metric data. You generate a metric item for this data with an extract metric processor. This might generate a high volume of metric items so you can perform aggregation logic within the pipeline to reduce data volume even further.
You may need to convert the metric when you extract it.
Source Data Item
Consider this log data item:
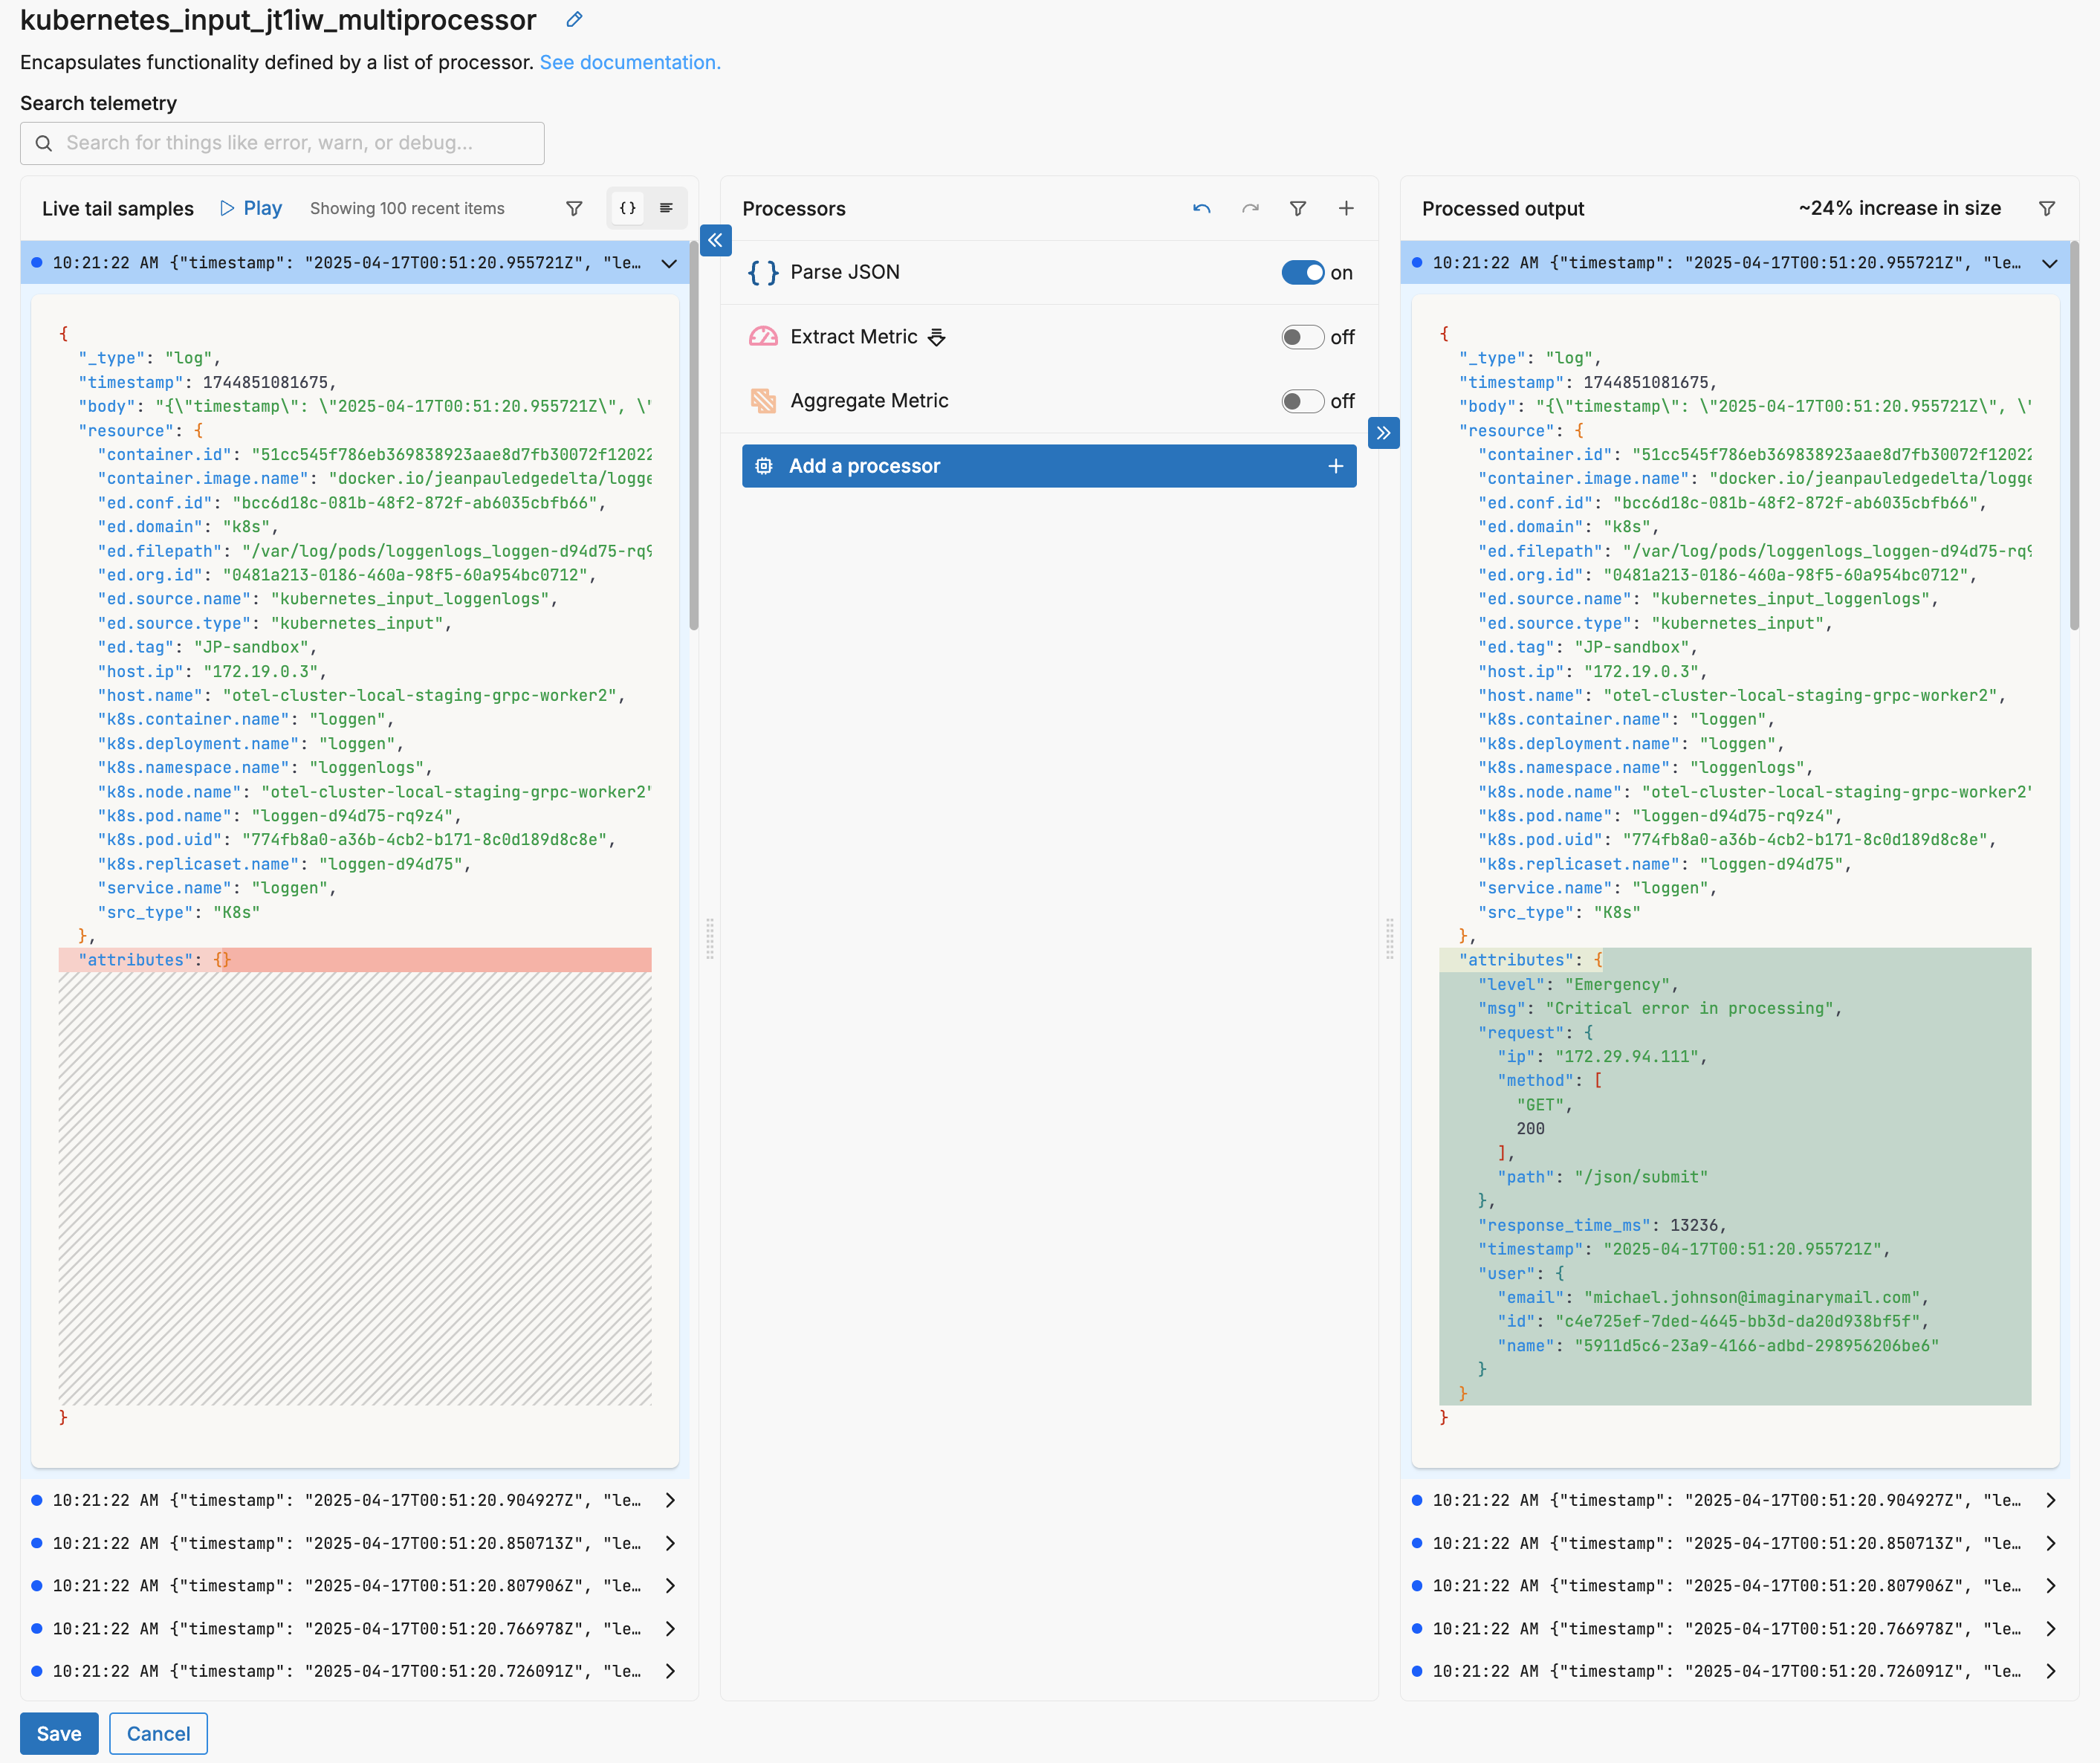
After parsing the JSON body, it contains a useful metric in the attributes["response_time_ms"] field.
Extract the Metric
AI Team: You can ask an AI teammate to configure the extract metric processor for you by describing what metric you want to extract from your logs.
You can configure an extract metric processor to generate a metric item based on the log. In this example, all incoming data item types are processed without any conditions. A metric is generated with the name response_time_ms and a description. It is capturing a unit of measure other than Bytes so Count is selected. Latency is an indicator that can go up or down so it is a gauge type metric. The target field attributes["response_time_ms"] is specified.
Note: The extract metric processor can consume doubles or integers.
In this field you have the opportunity to convert the data type. For example, if the input field was a string you could specify the target field with the OTTL Double convertor: Double(attributes["response_time_ms"]).
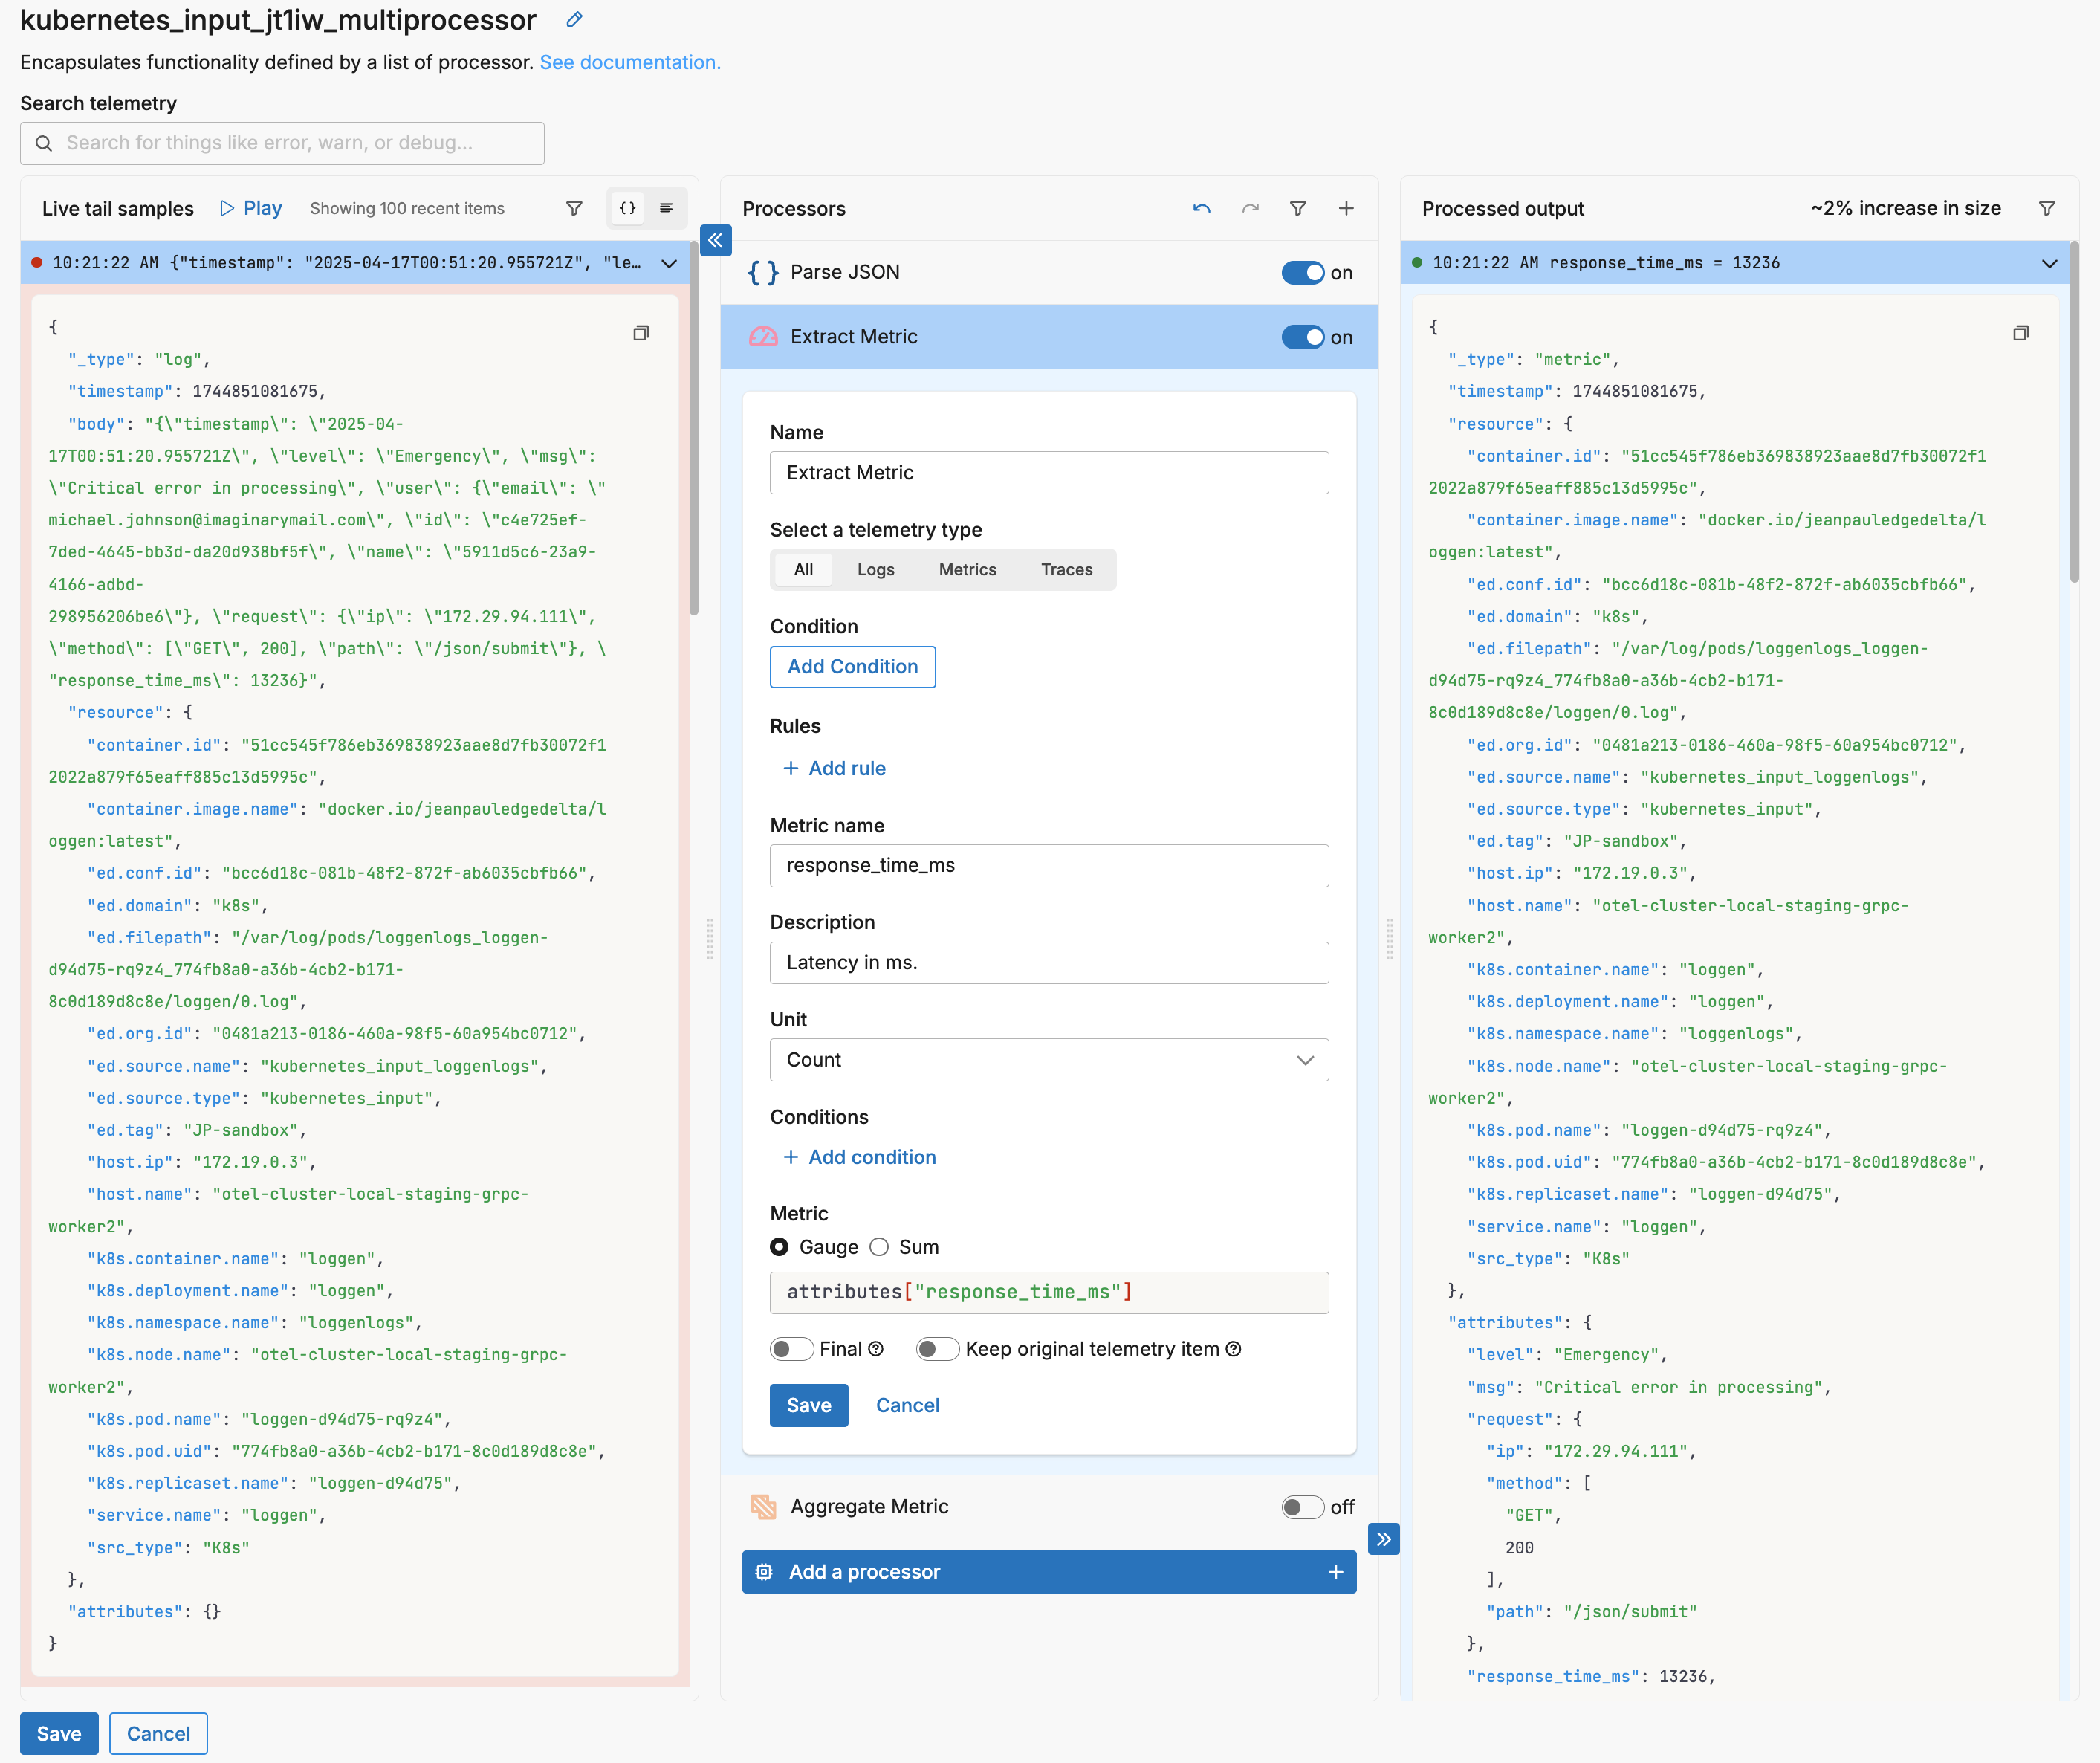
Note how all the source item attributes are now attributes of the metric item. This has two implications: the decrease in size is only about 2 percent across the 100 live capture samples, and there is probably no need to turn on the Keep original telemetry item switch.
{
  "_type": "metric",
  "timestamp": 1744851081675,
  "resource": {
...
  },
  "attributes": {
    "level": "Emergency",
    "msg": "Critical error in processing",
    "request": {
      "ip": "172.29.94.111",
      "method": [
        "GET",
        200
      ],
      "path": "/json/submit"
    },
    "response_time_ms": 13236,
    "timestamp": "2025-04-17T00:51:20.955721Z",
    "user": {
      "email": "michael.johnson@imaginarymail.com",
      "id": "c4e725ef-7ded-4645-bb3d-da20d938bf5f",
      "name": "5911d5c6-23a9-4166-adbd-298956206be6"
    }
  },
  "description": "Latency in ms.",
  "gauge": {
    "value": 13236
  },
  "kind": "gauge",
  "name": "response_time_ms",
  "unit": "1",
  "_stat_type": "value"
}
The Final switch is left off because the generated metrics will be aggregated in the next processor.
Aggregate the Metrics
AI Team: You can ask an AI teammate to configure the aggregate metric processor for you by describing how you want to aggregate your metrics.
The initial Extract Metrics processor generated 100 metric items from 100 log items. While aggregation can be performed in the Metrics Explorer, you may decide to perform aggregation in the pipeline using the aggregate metric processor to reduce traffic volume. In this instance, two aggregated metrics are generated from the extracted metrics: A count of metrics per minute grouped by the level attribute, and a sum of metrics per minute grouped by the level attribute:
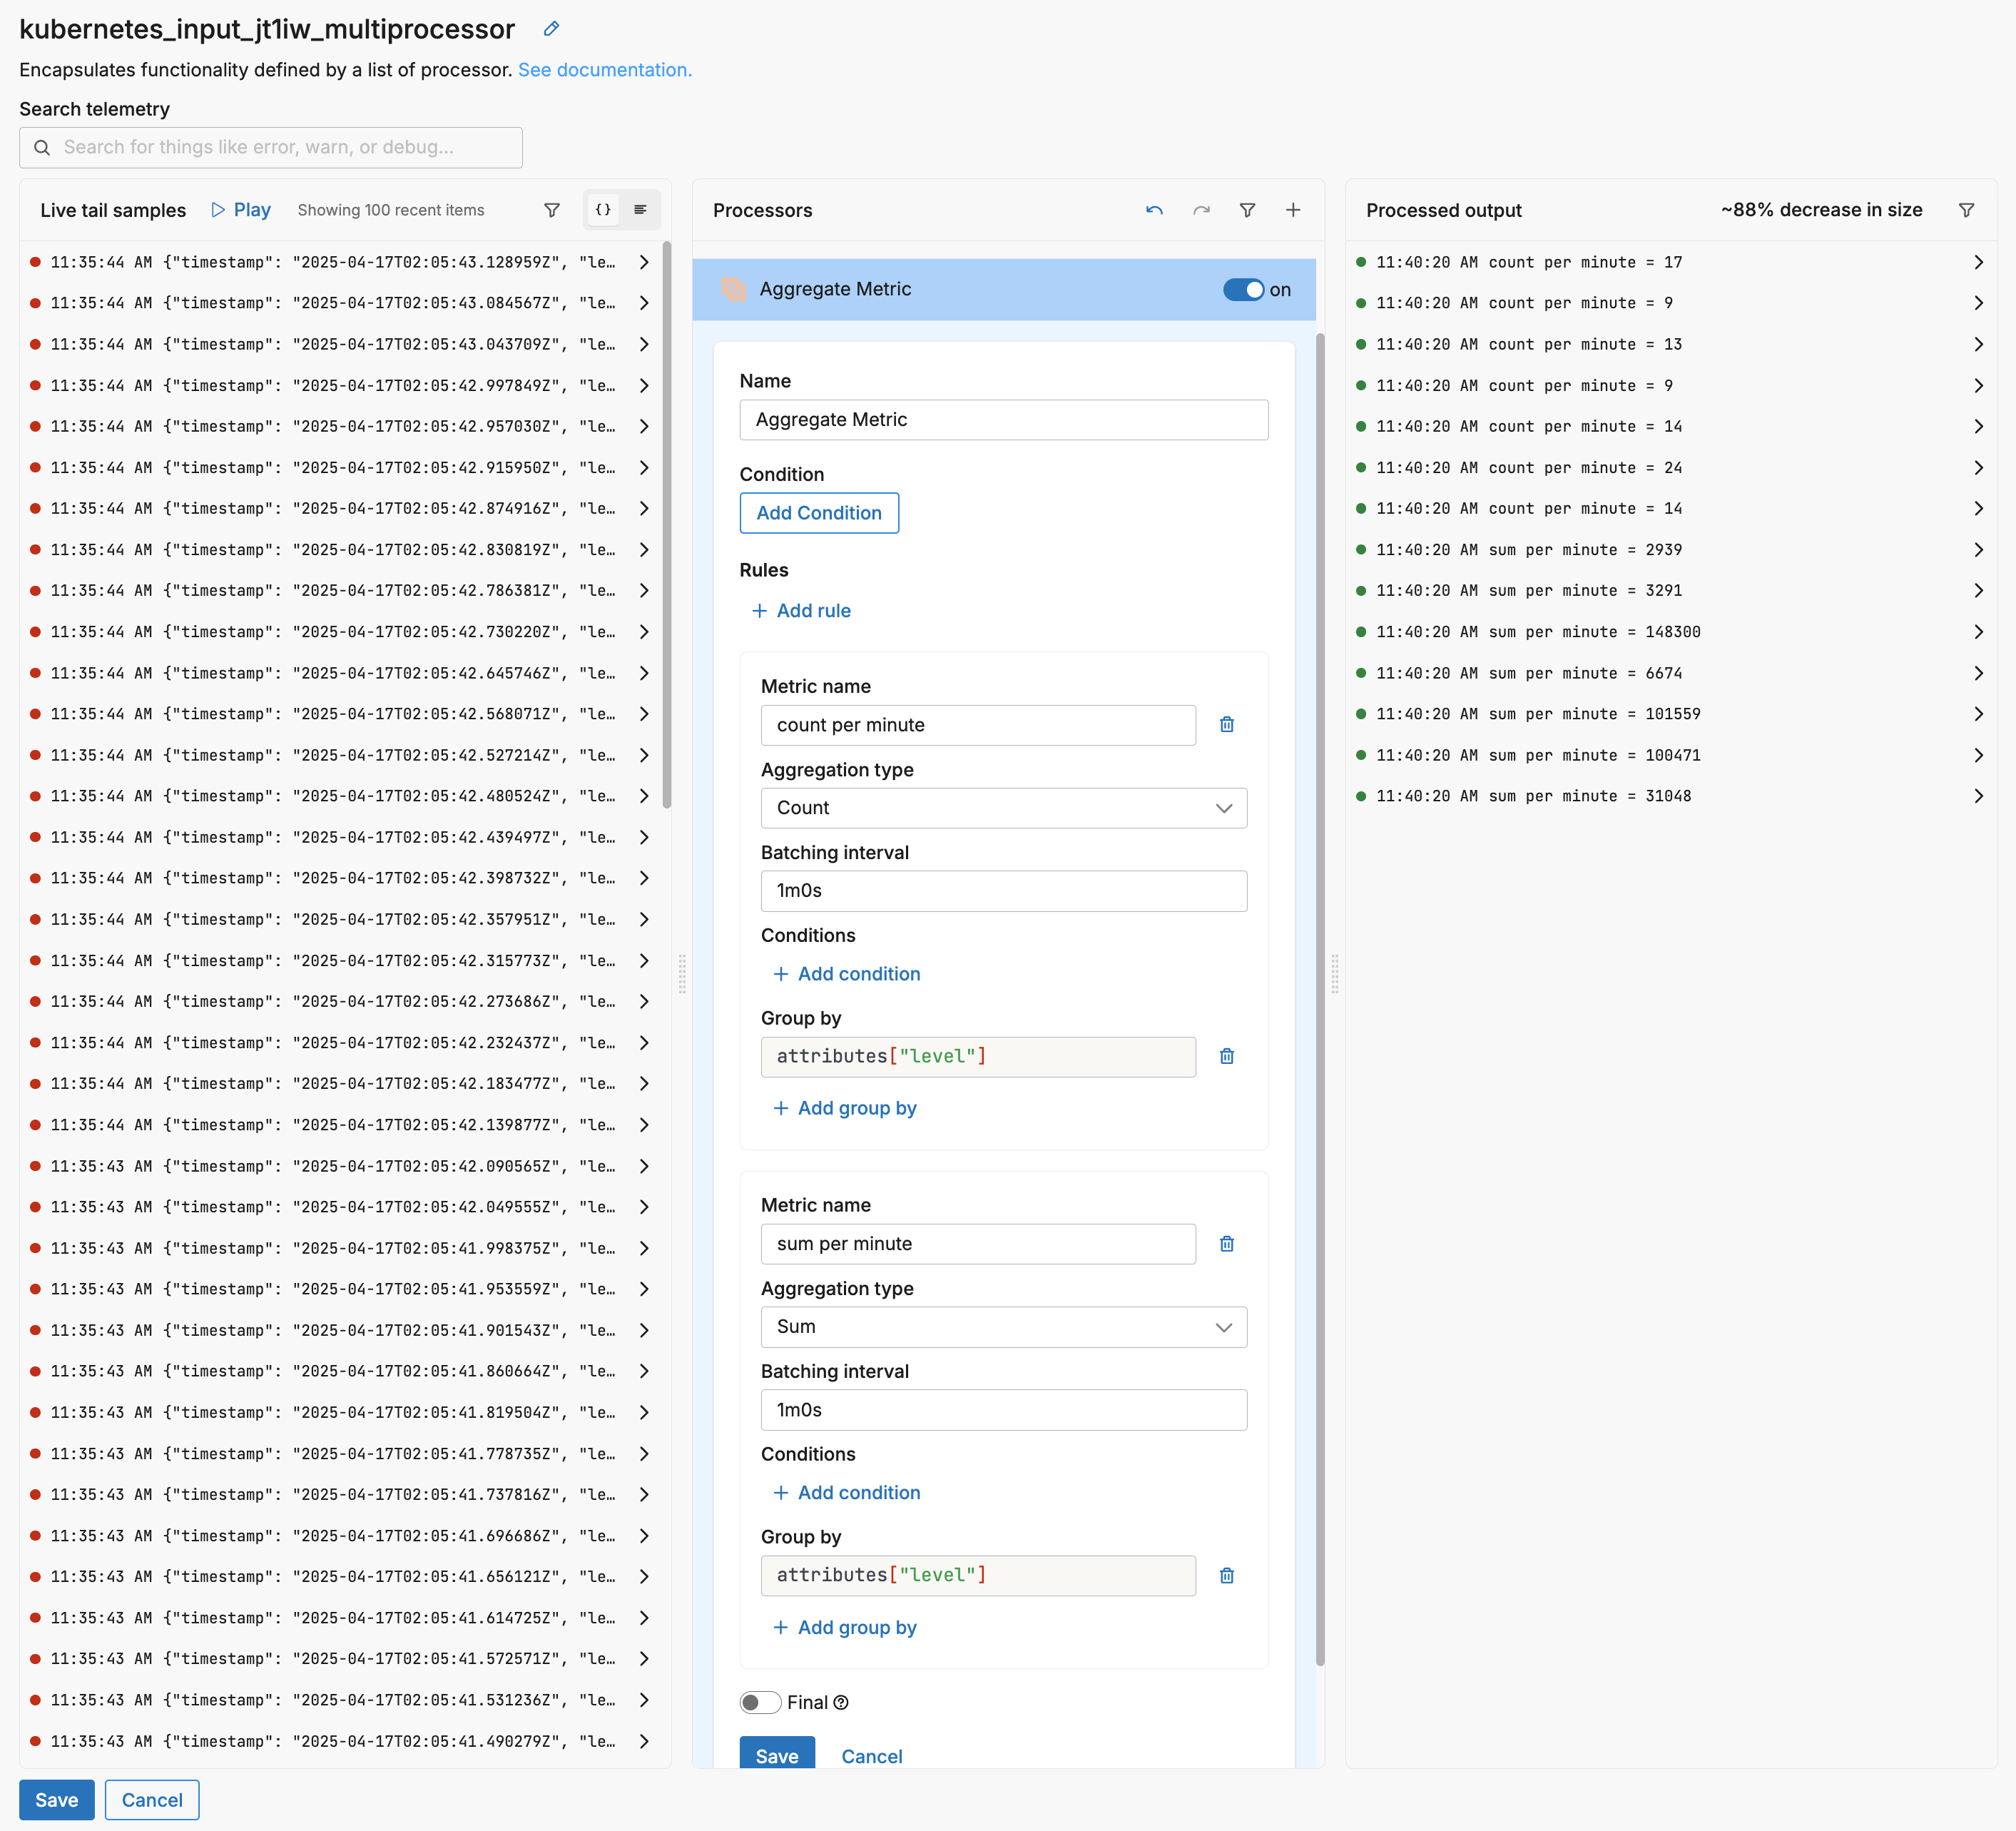
In the 100 live capture samples there are seven unique level values, therefore, seven of each metric are generated - one per group. If you expand an aggregated metric in the output pane, the level attribute can be seen with a count per minute value of 17.
{
  "_type": "metric",
  "timestamp": 1744855819539,
  "resource": {
...
  },
  "attributes": {
    "level": "Info",
    "msg": "processing succeeded",
    "request": {
      "method": [
        "GET",
        200
      ]
    },
    "user": {}
  },
  "description": "Latency in ms.",
  "gauge": {
    "value": 17
  },
  "kind": "gauge",
  "name": "count per minute",
  "start_timestamp": 1744855819479,
  "unit": "1",
  "_stat_type": "value"
}
Visualize Aggregated Metrics in the Metrics Explorer
Before visualizing these metrics in the Metric Explorer, you need to create a facet for the dimension group level created from attributes["level"].
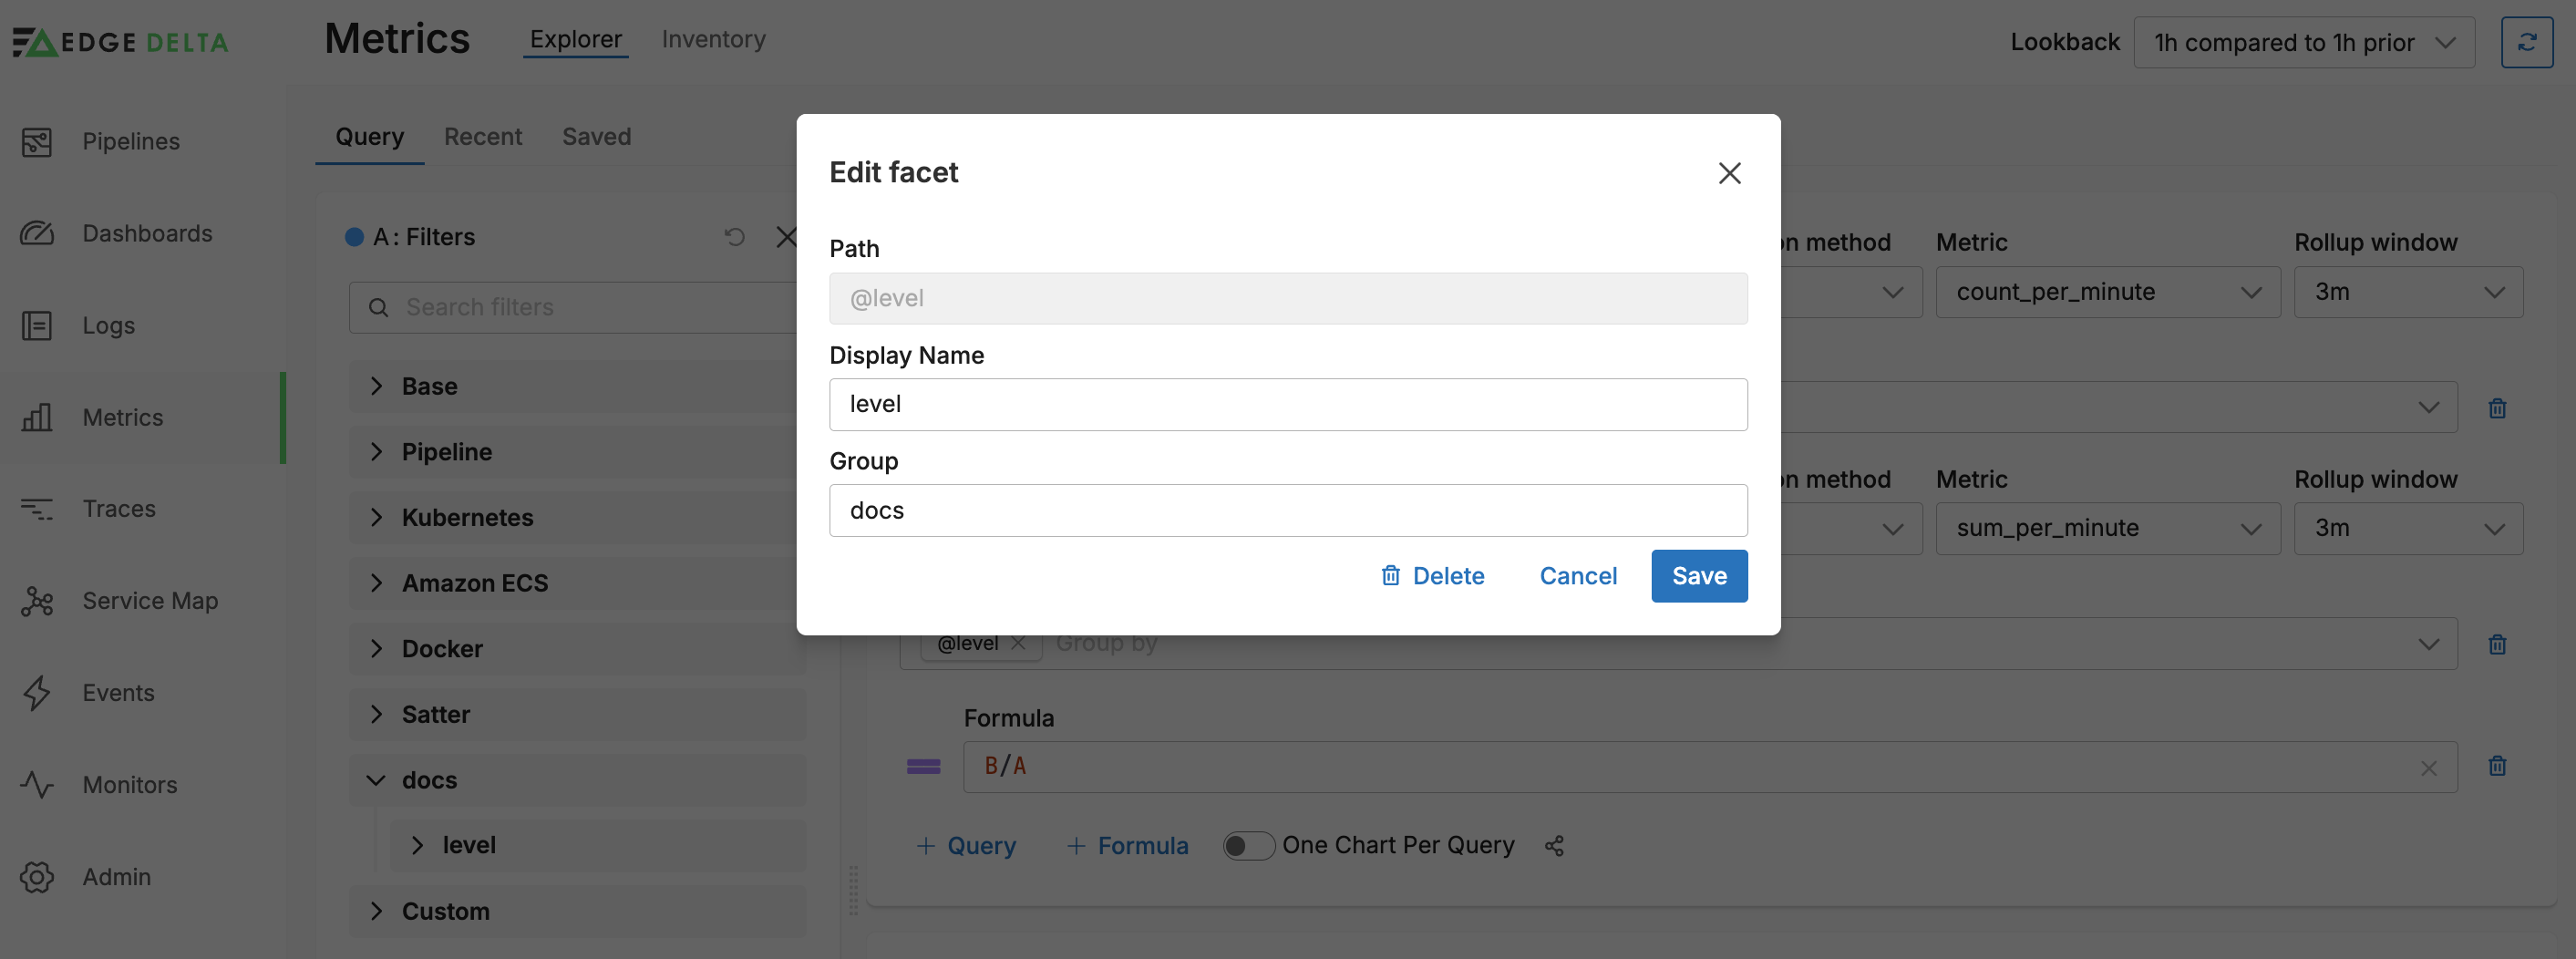
Next, you configure a view using both metrics count_per_minute and sum_per_minute in separate queries. Each of these is grouped by the level facet. A formula series shows the average for each level by calculating the total latency divided by the number of metric items.
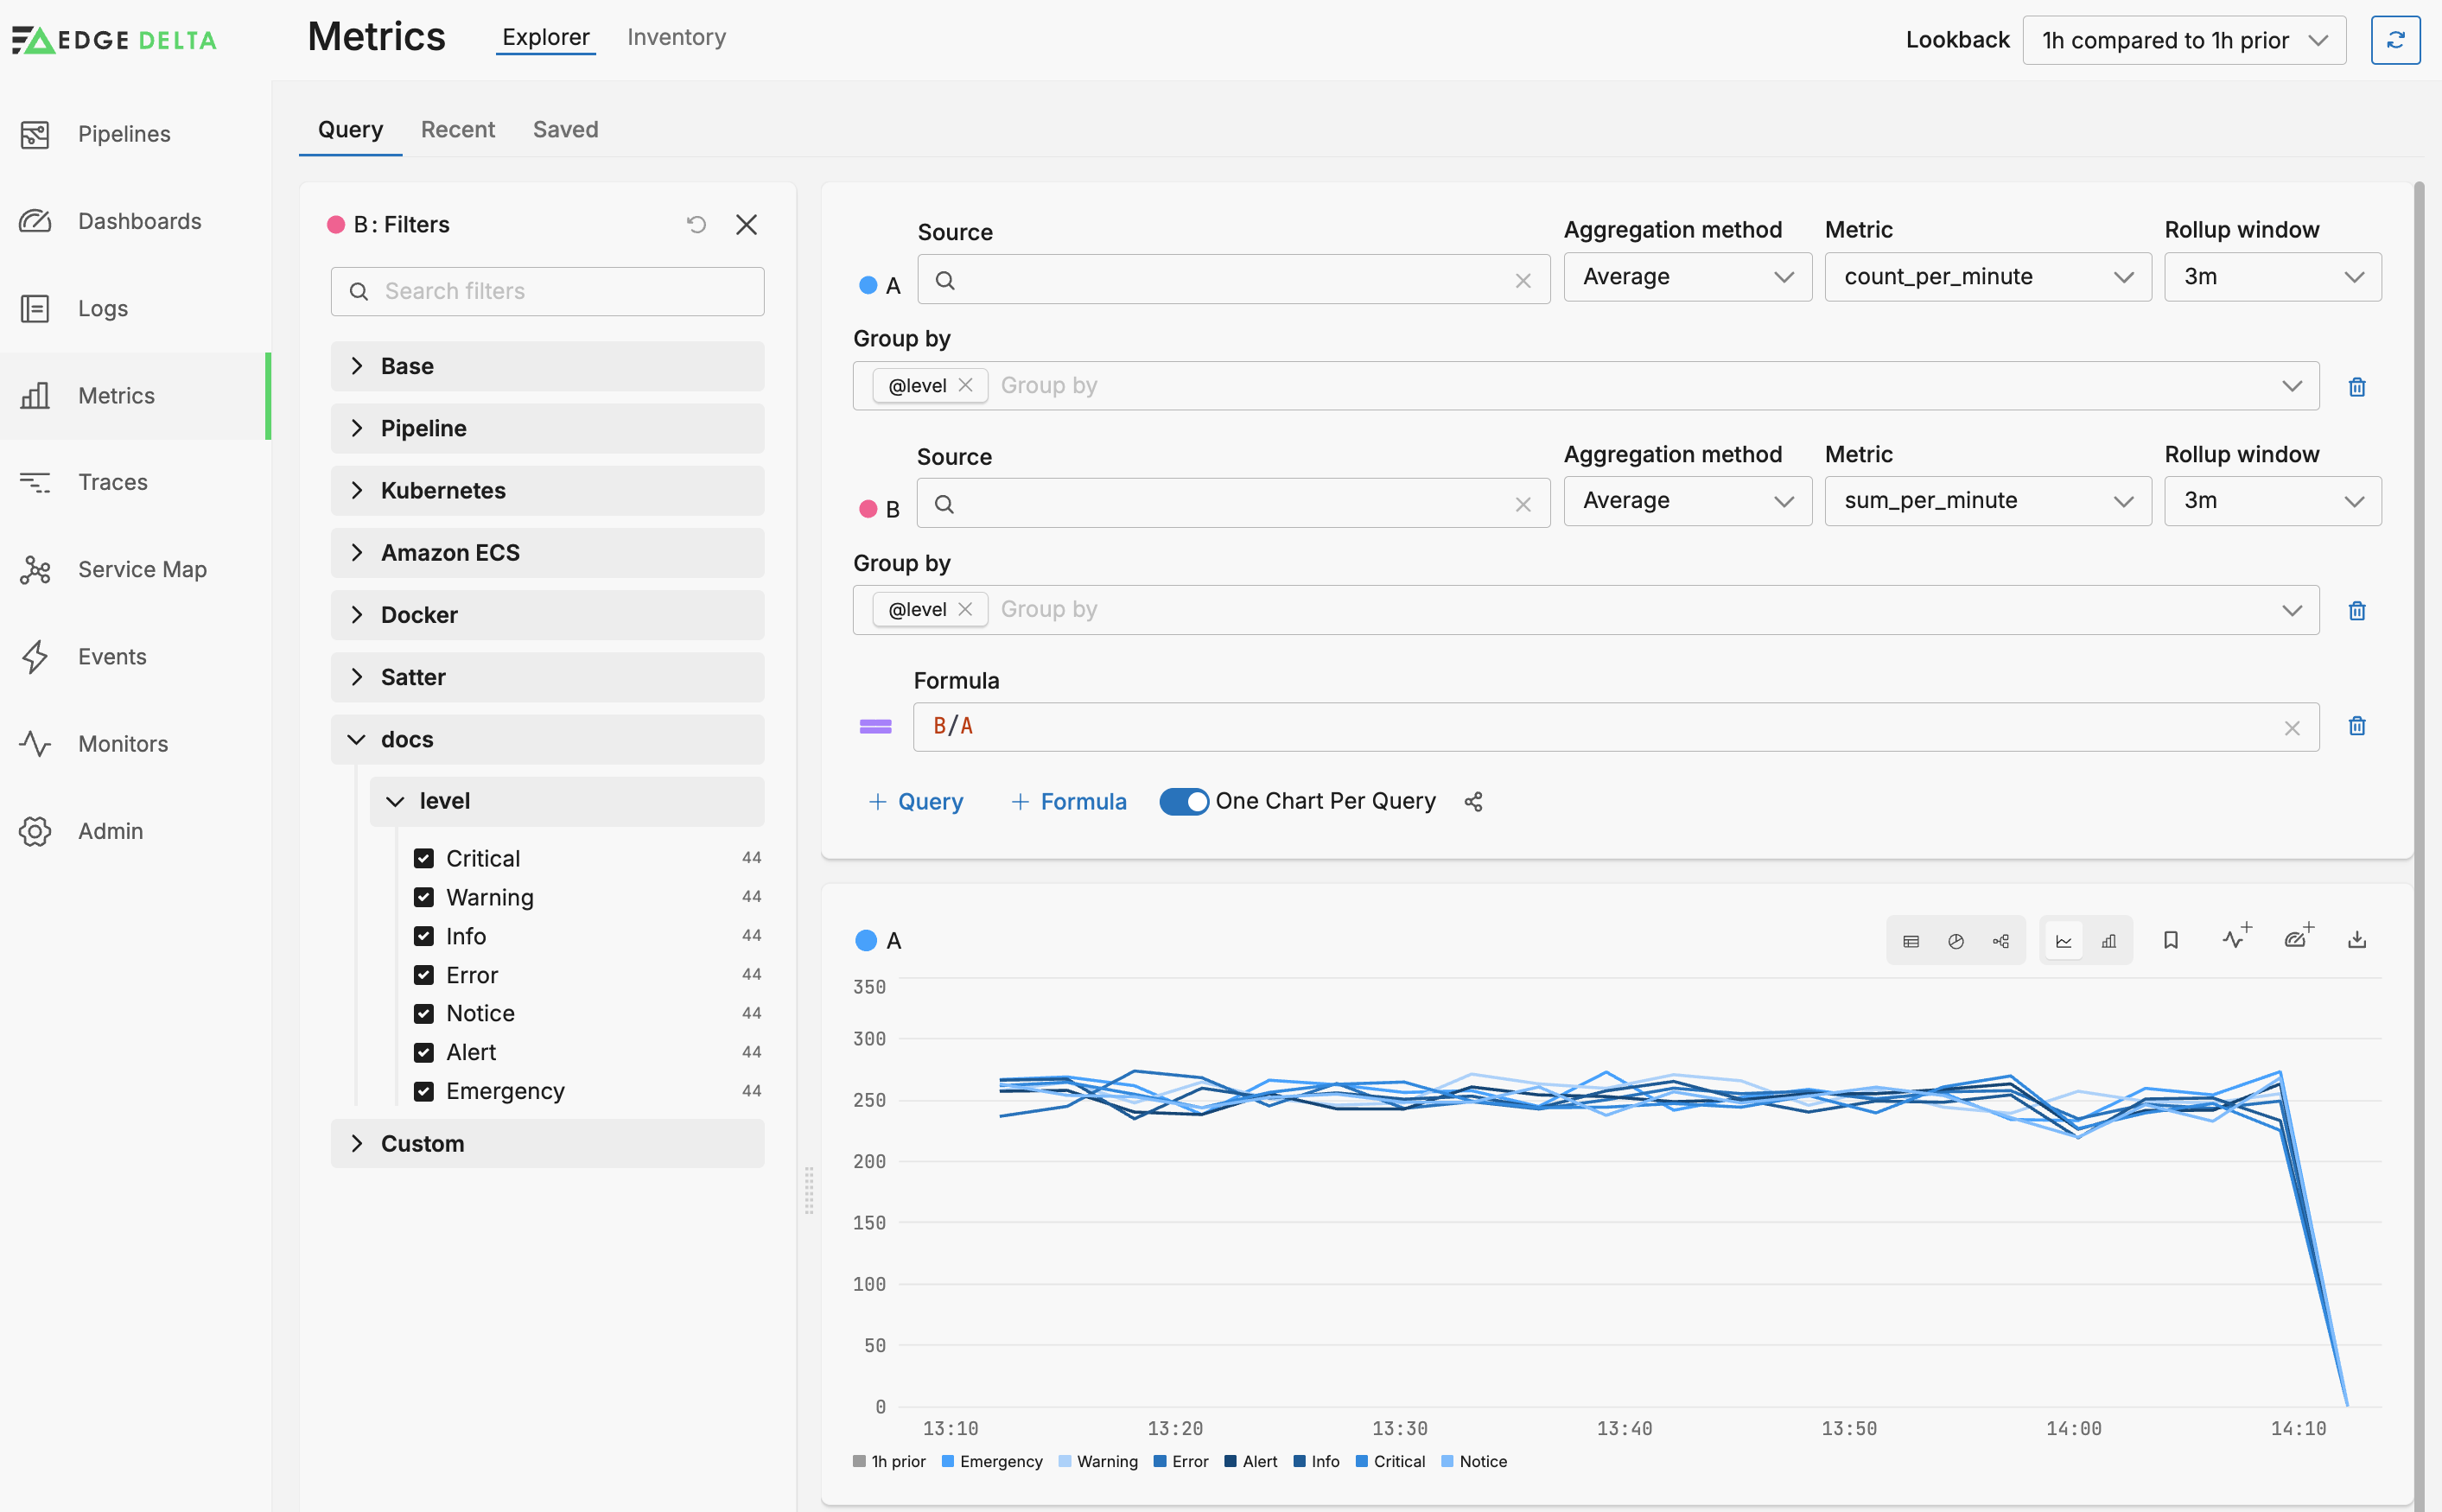
Consider the various time settings configured so far. The aggregated metrics are a sum executed every minute. In the Metrics Explorer, these metrics are rolled up into an average over 3 minutes. This means that each data point in the resulting graph is an average value of approximately three metric items. Having a larger rollup window than batching interval helps reduce jitter.
The graph generated by the formula B/A indicates the average latency grouped by log level. There is a visual correlation between log level and latency.
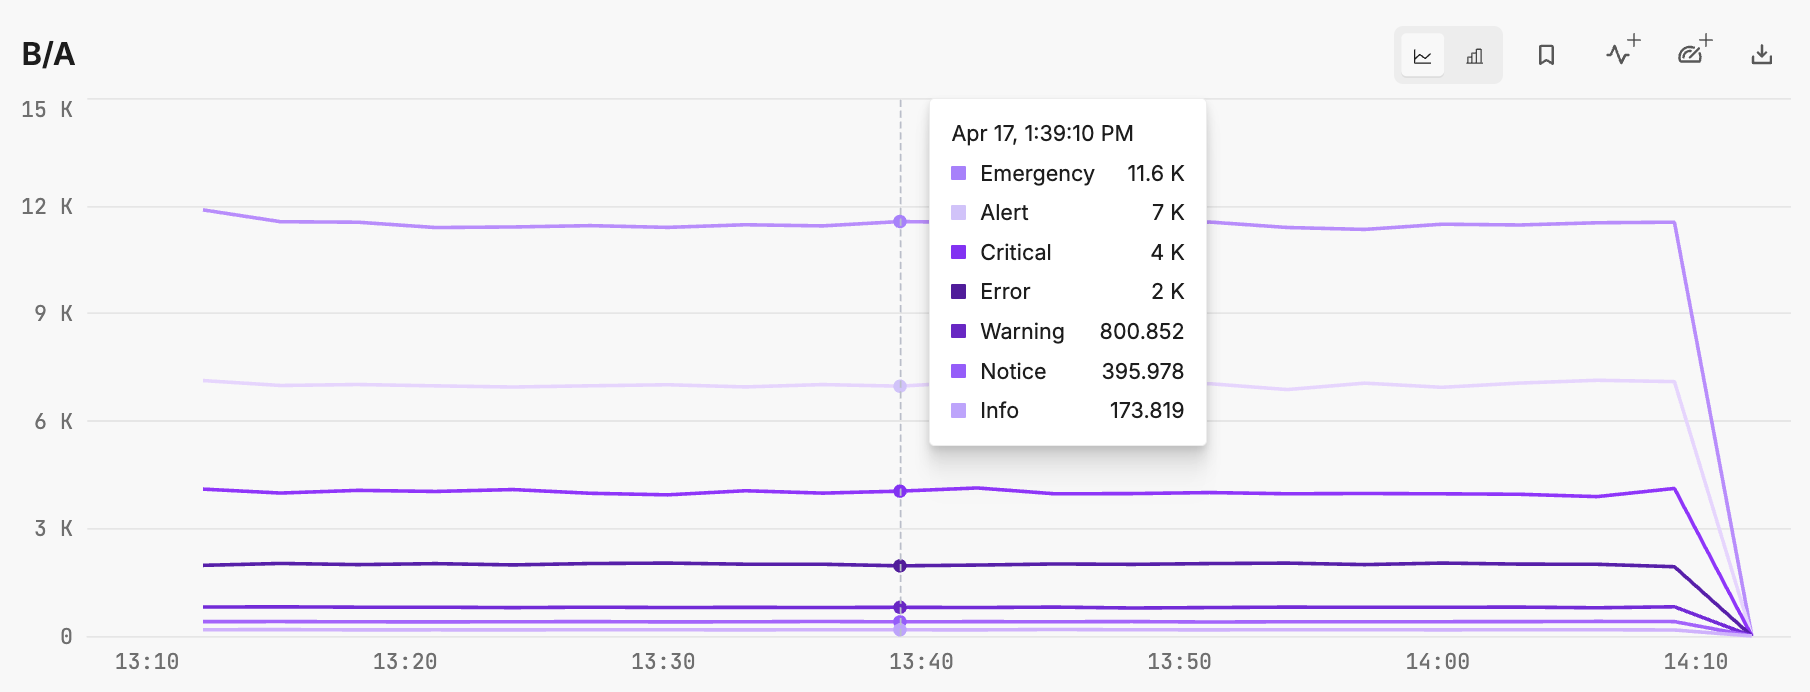
Note: This example is illustrative of a particular performance indicator design. If log level latency average were the only use case for these metrics, you might consider moving some logic to the edge processor. For example you can configure the aggregate processor to create an average latency grouped by level, however, this would lose insight into the the level count.