Log Threshold Monitor
3 minute read
Create a Log Threshold Monitor
To create a Log Threshold monitor,
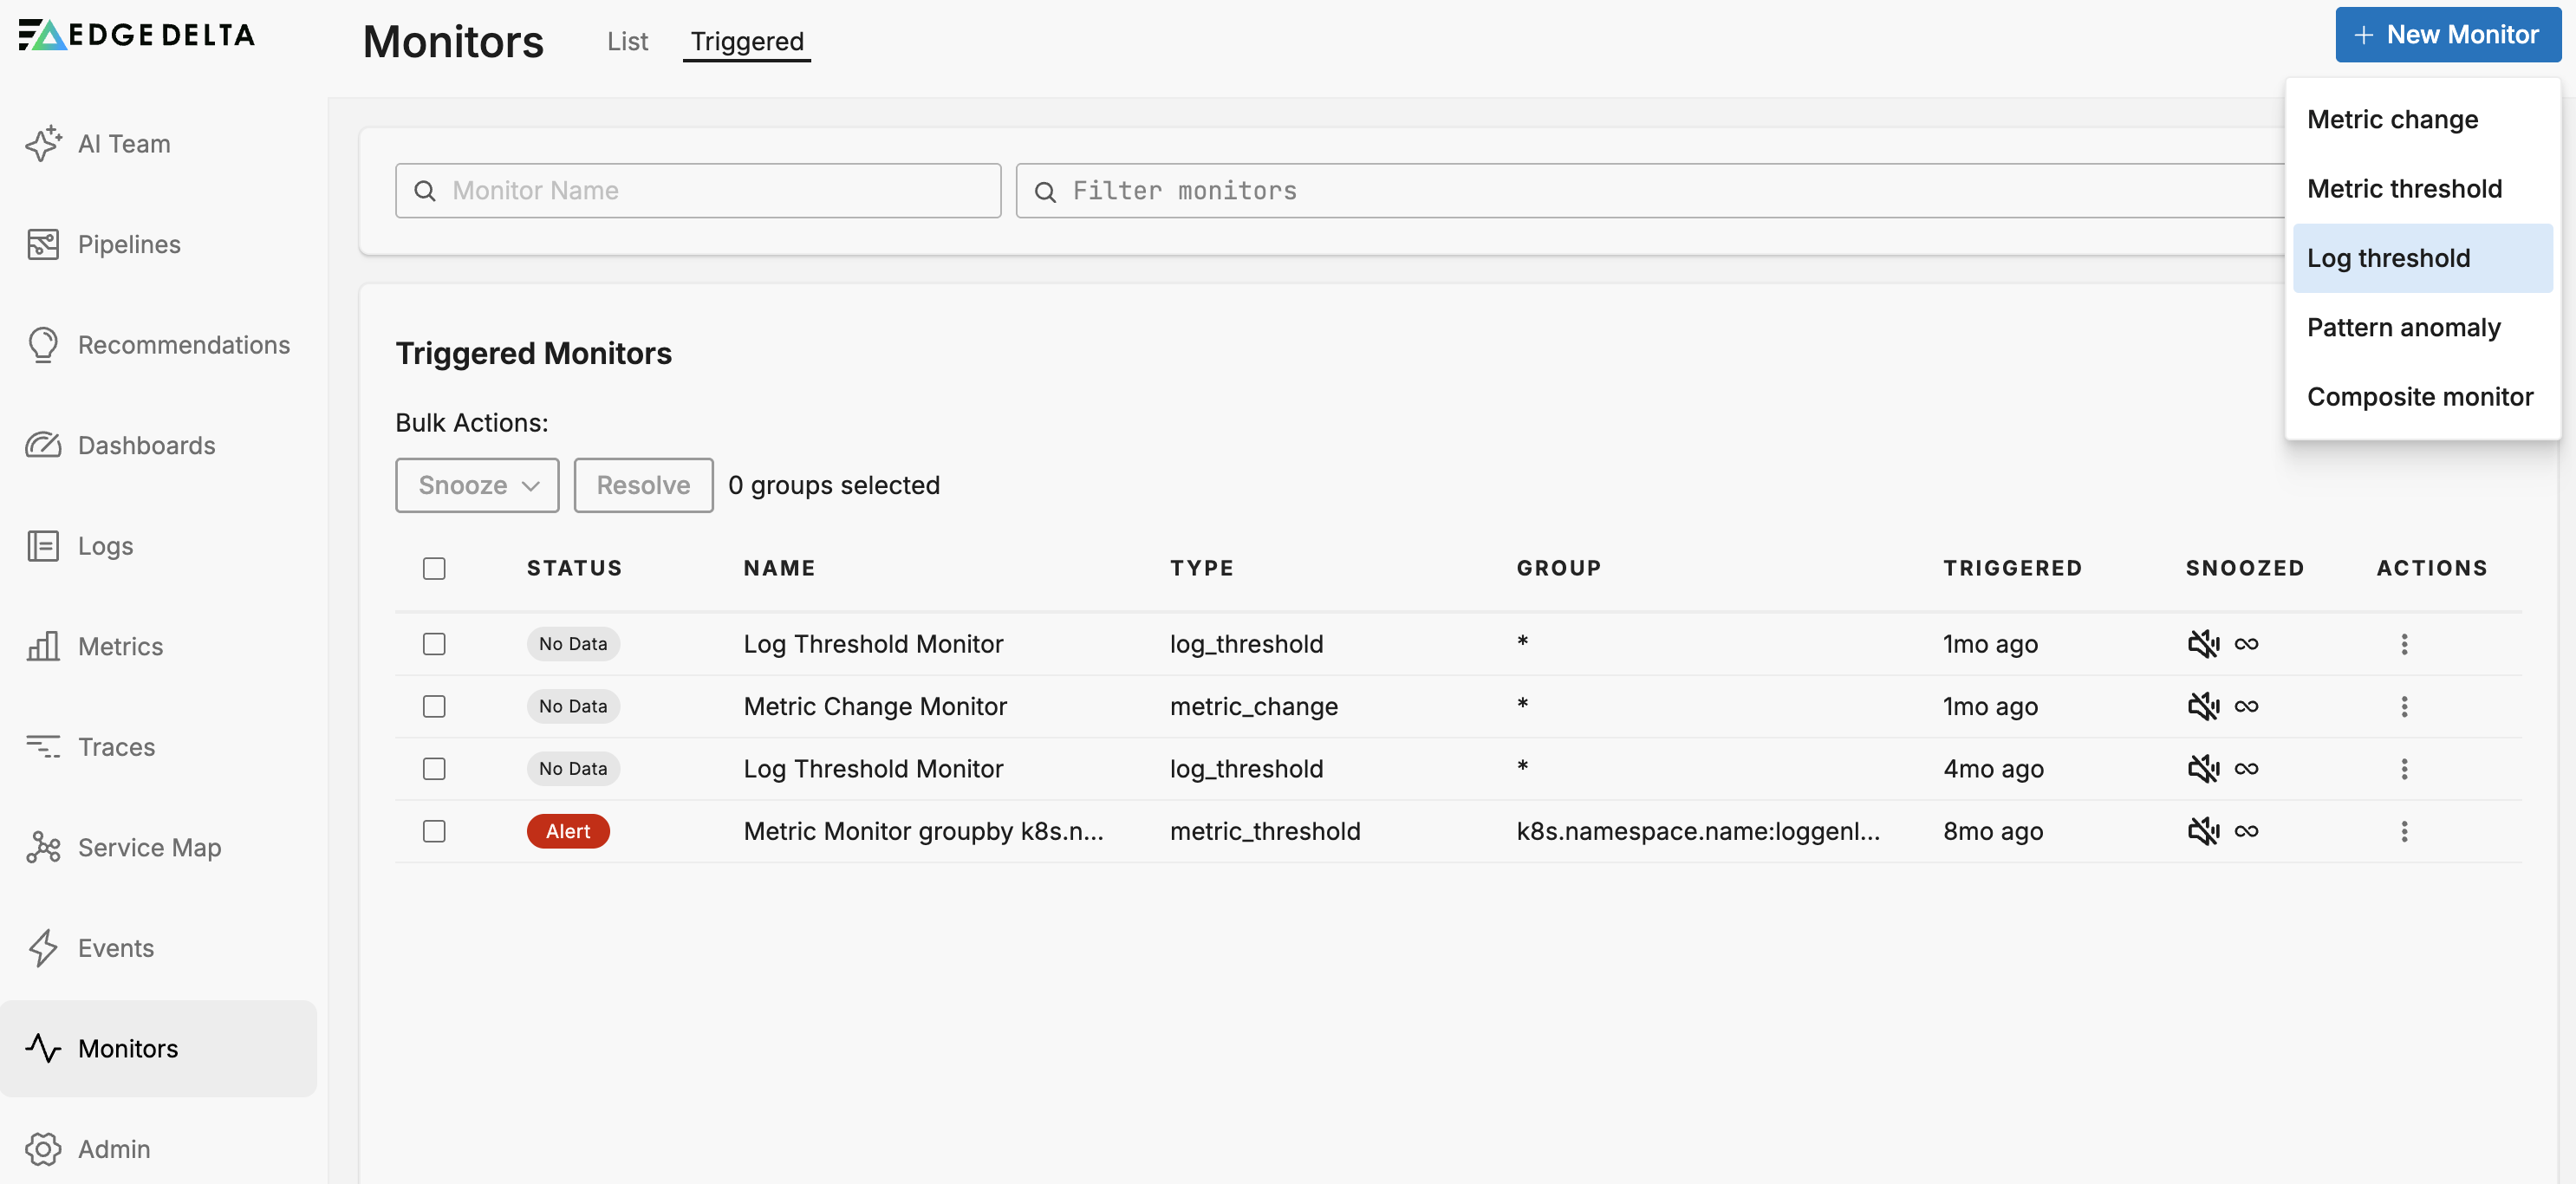
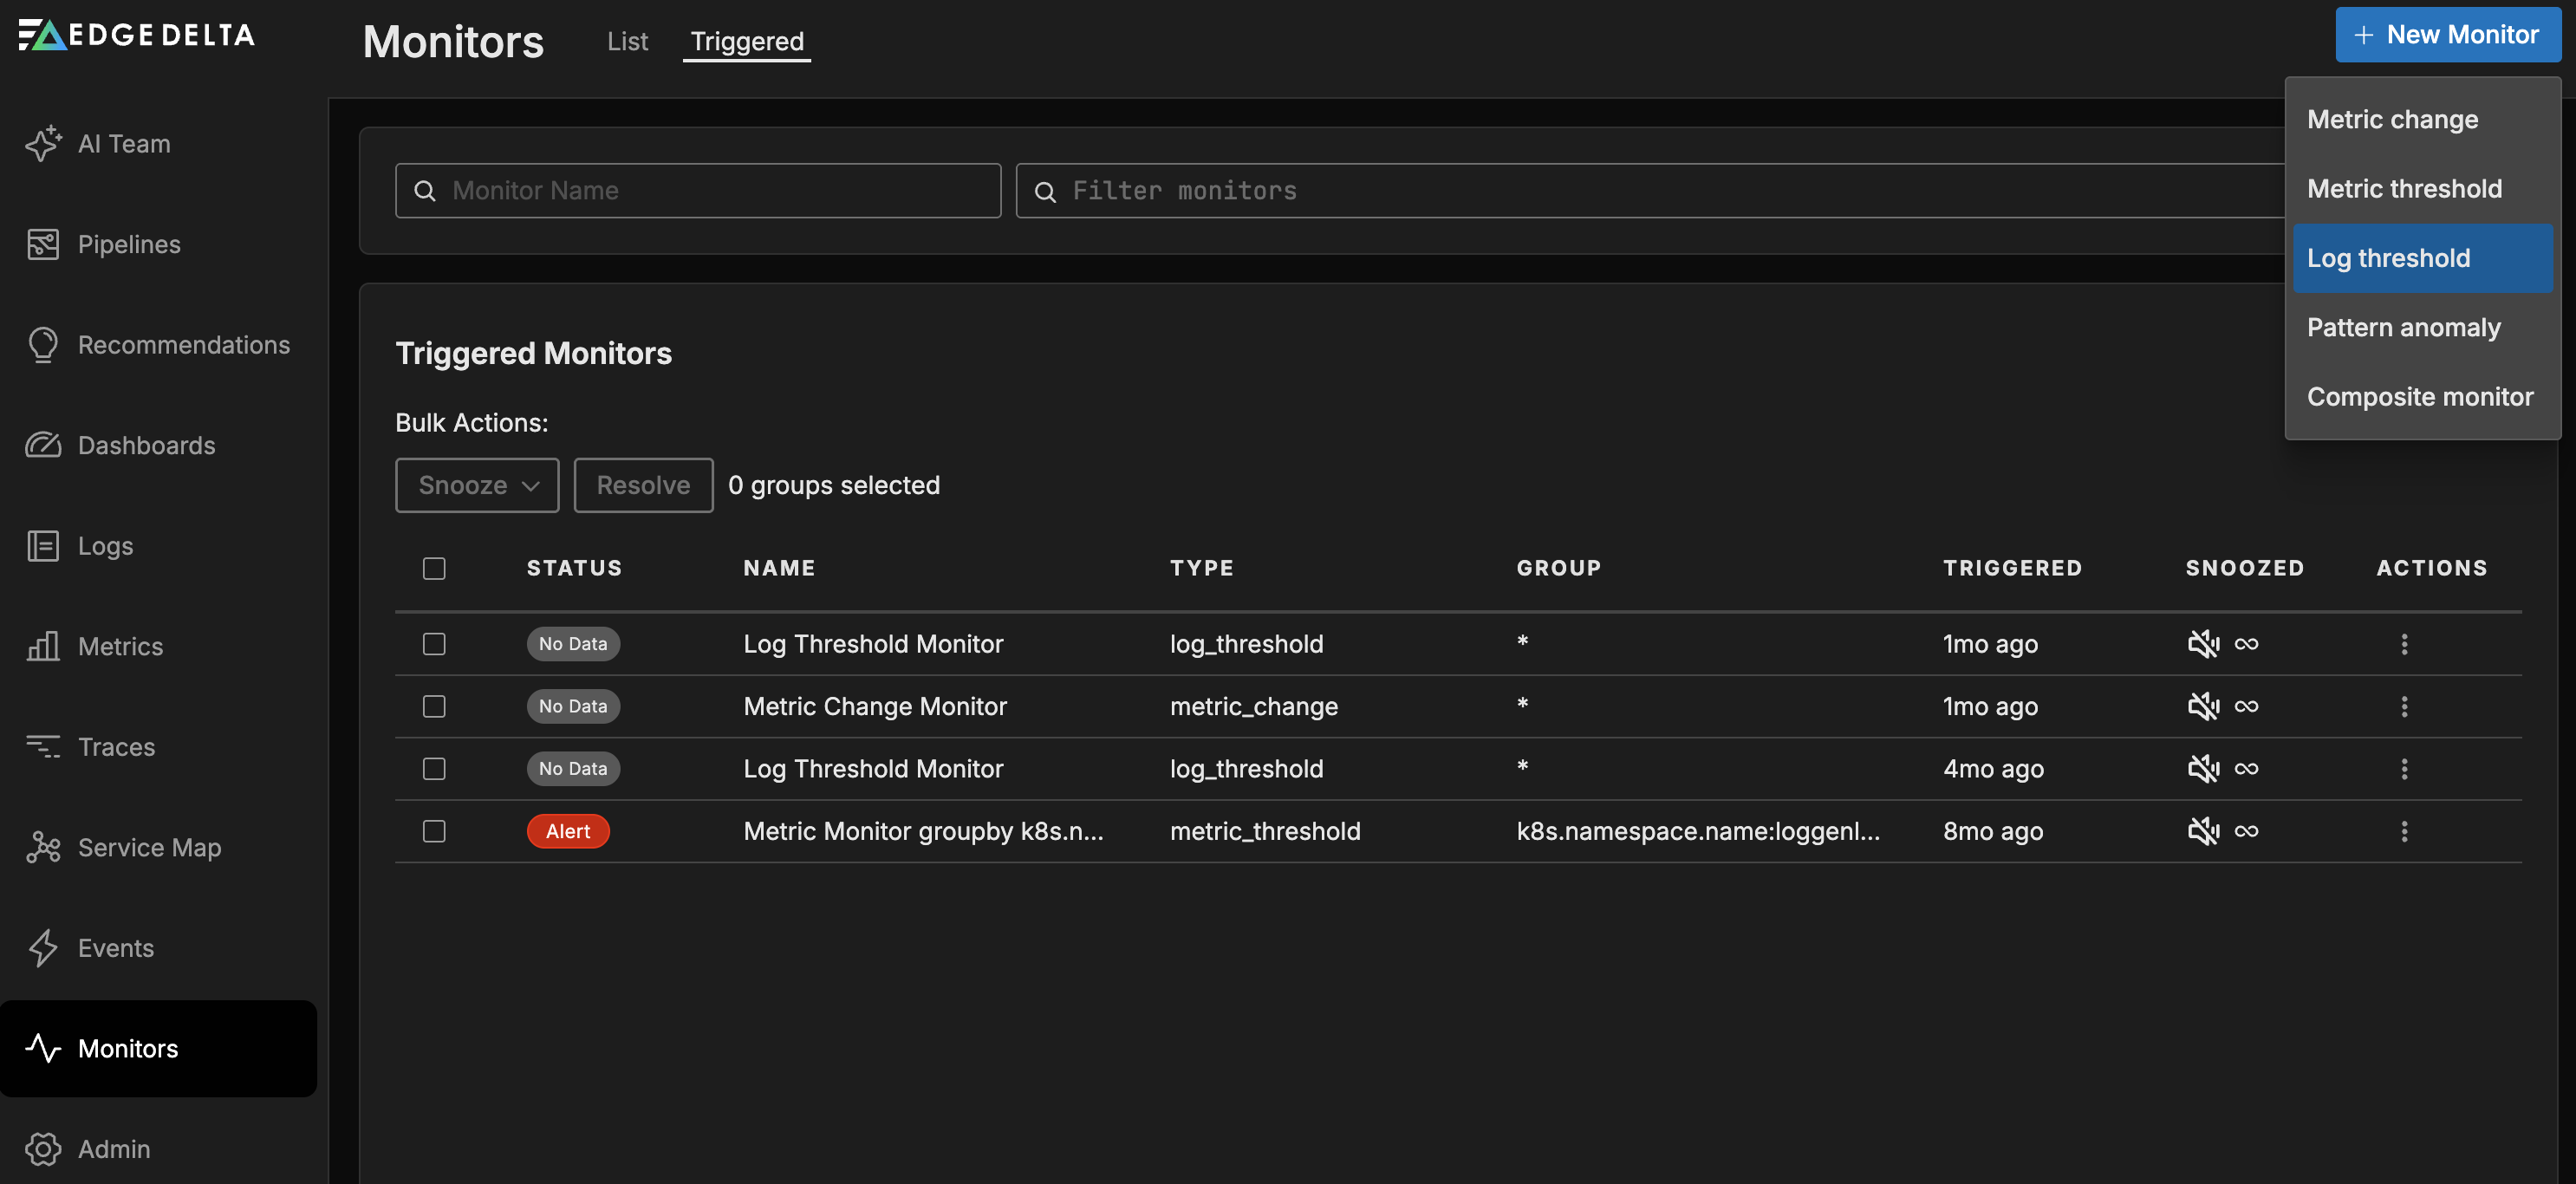
- Click Monitors and select the Triggered tab.
- Click + New Monitor and select Log Threshold.
Configure Log Threshold Monitor
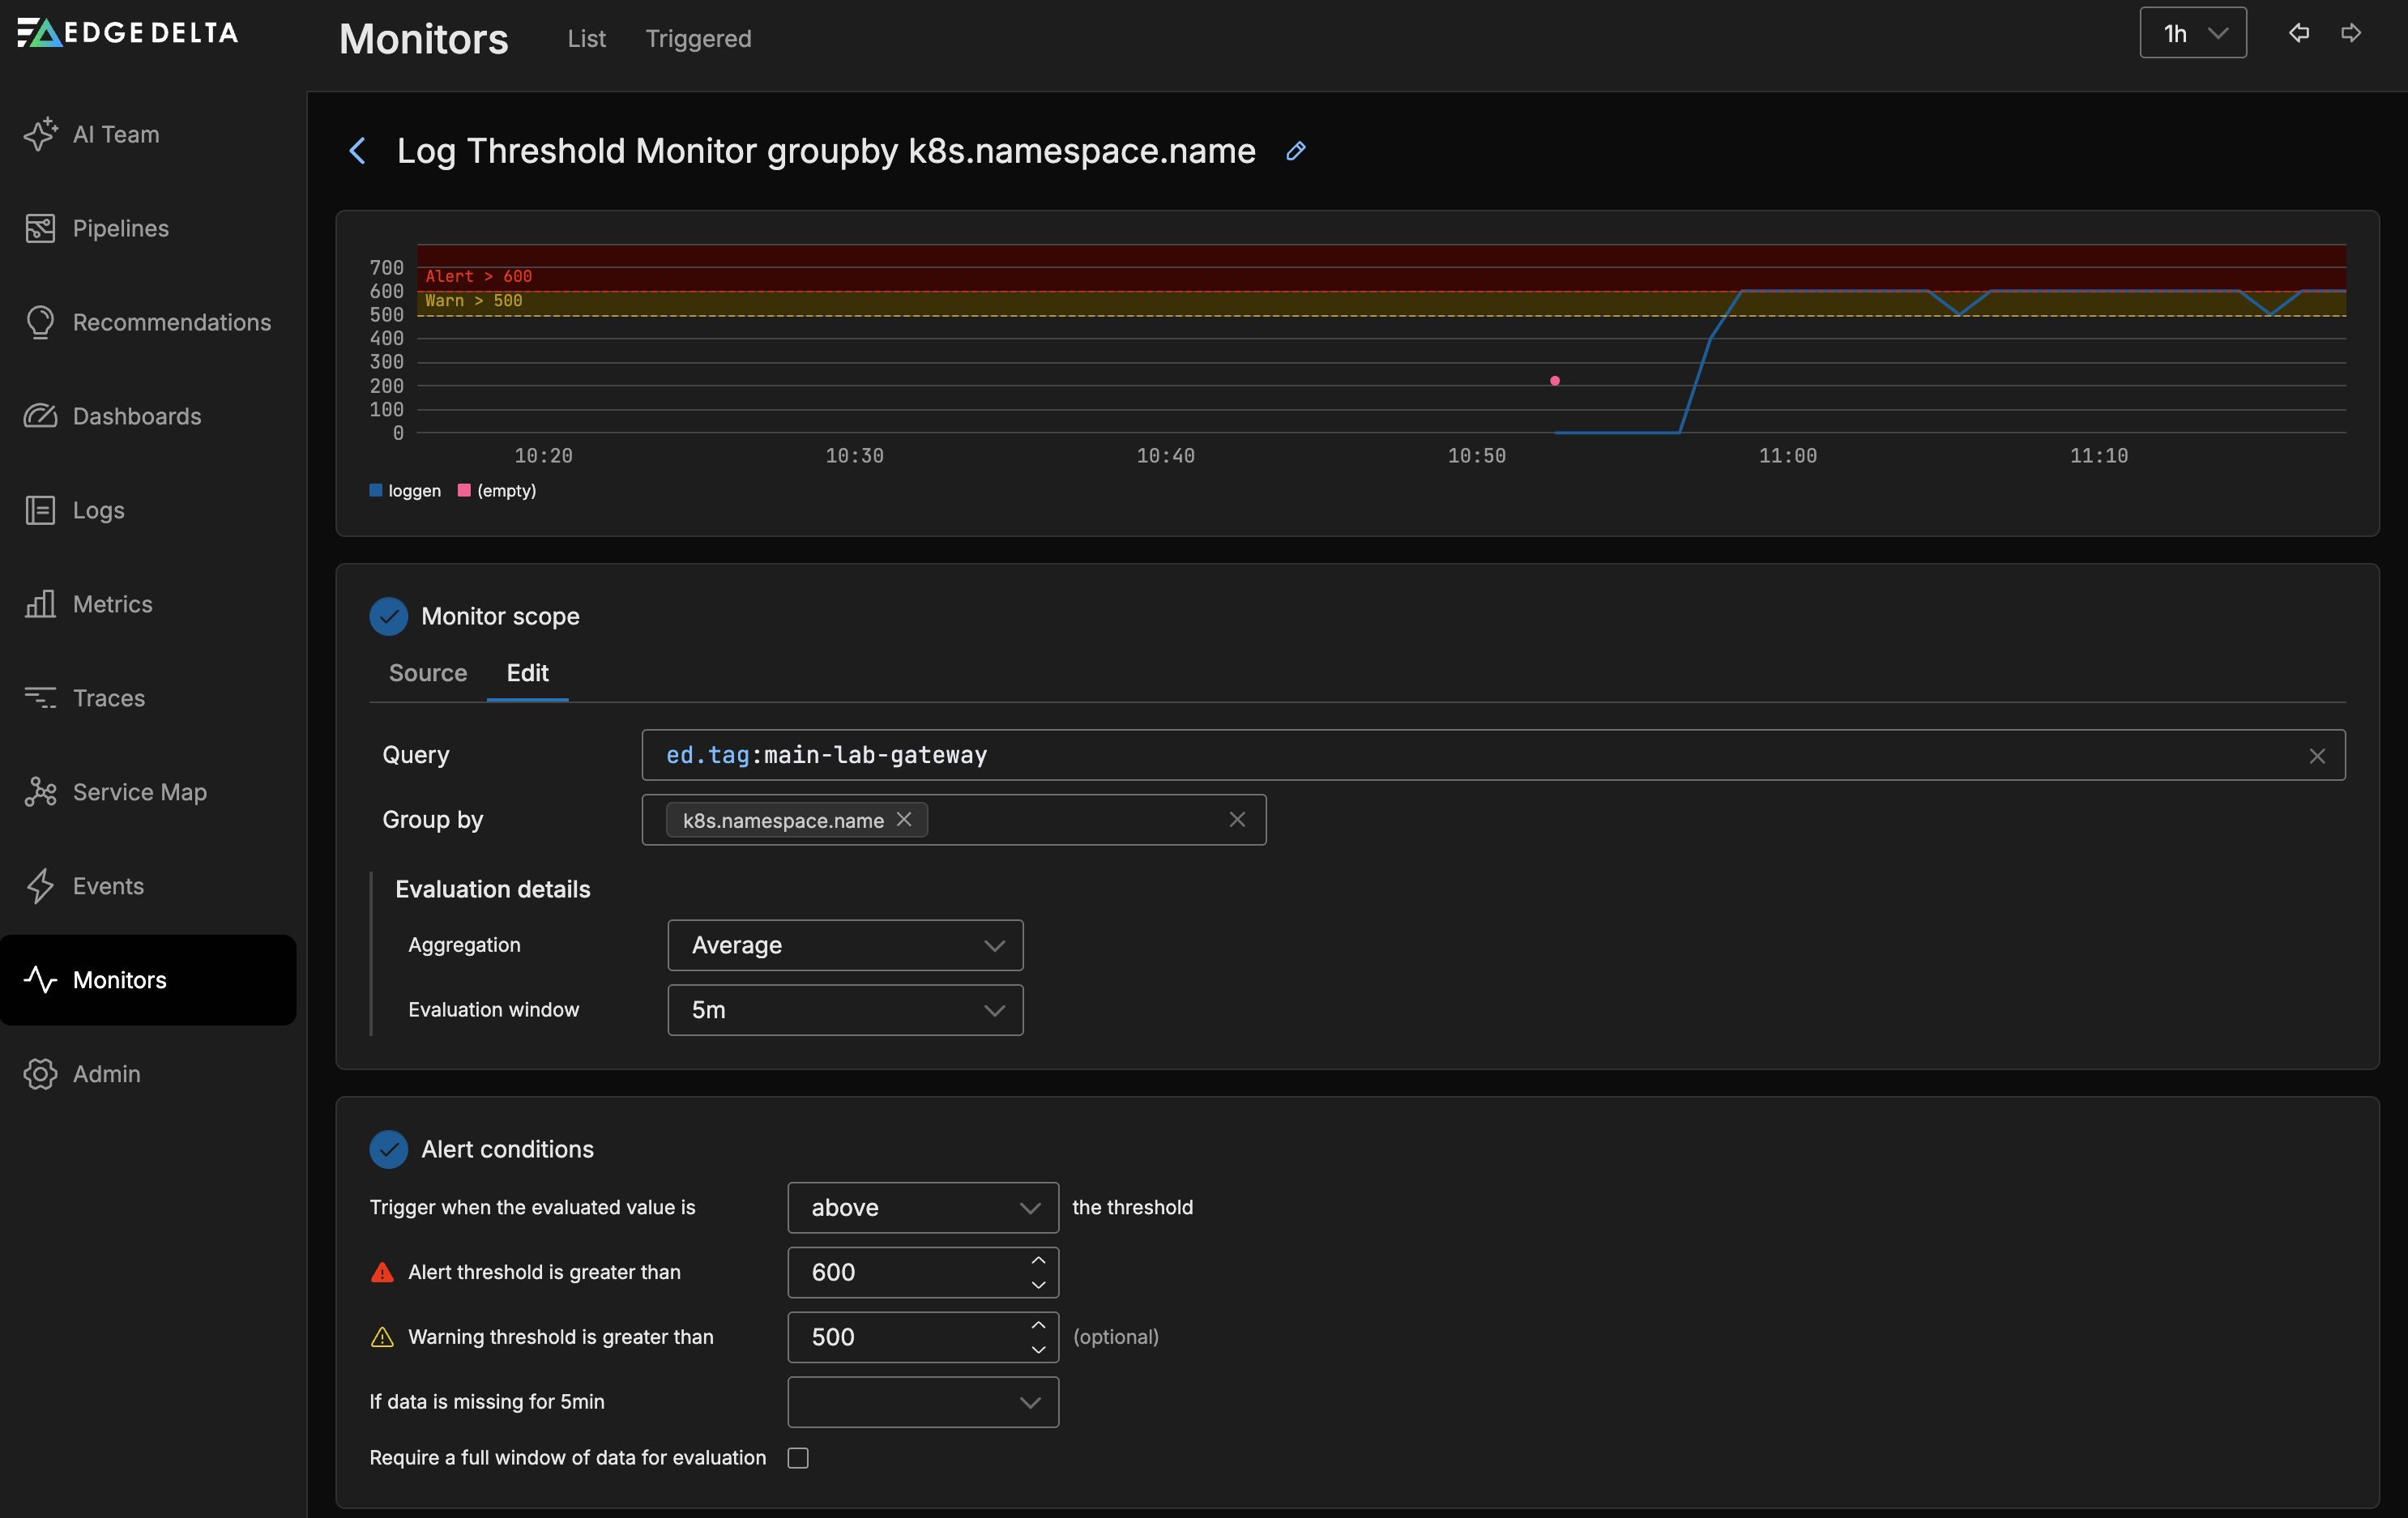
The Log Threshold Monitor evaluates the log count across all agents in the pipeline. In this example the count is grouped by namespace, a single pipeline is being monitored and both warning and alert thresholds have been set.
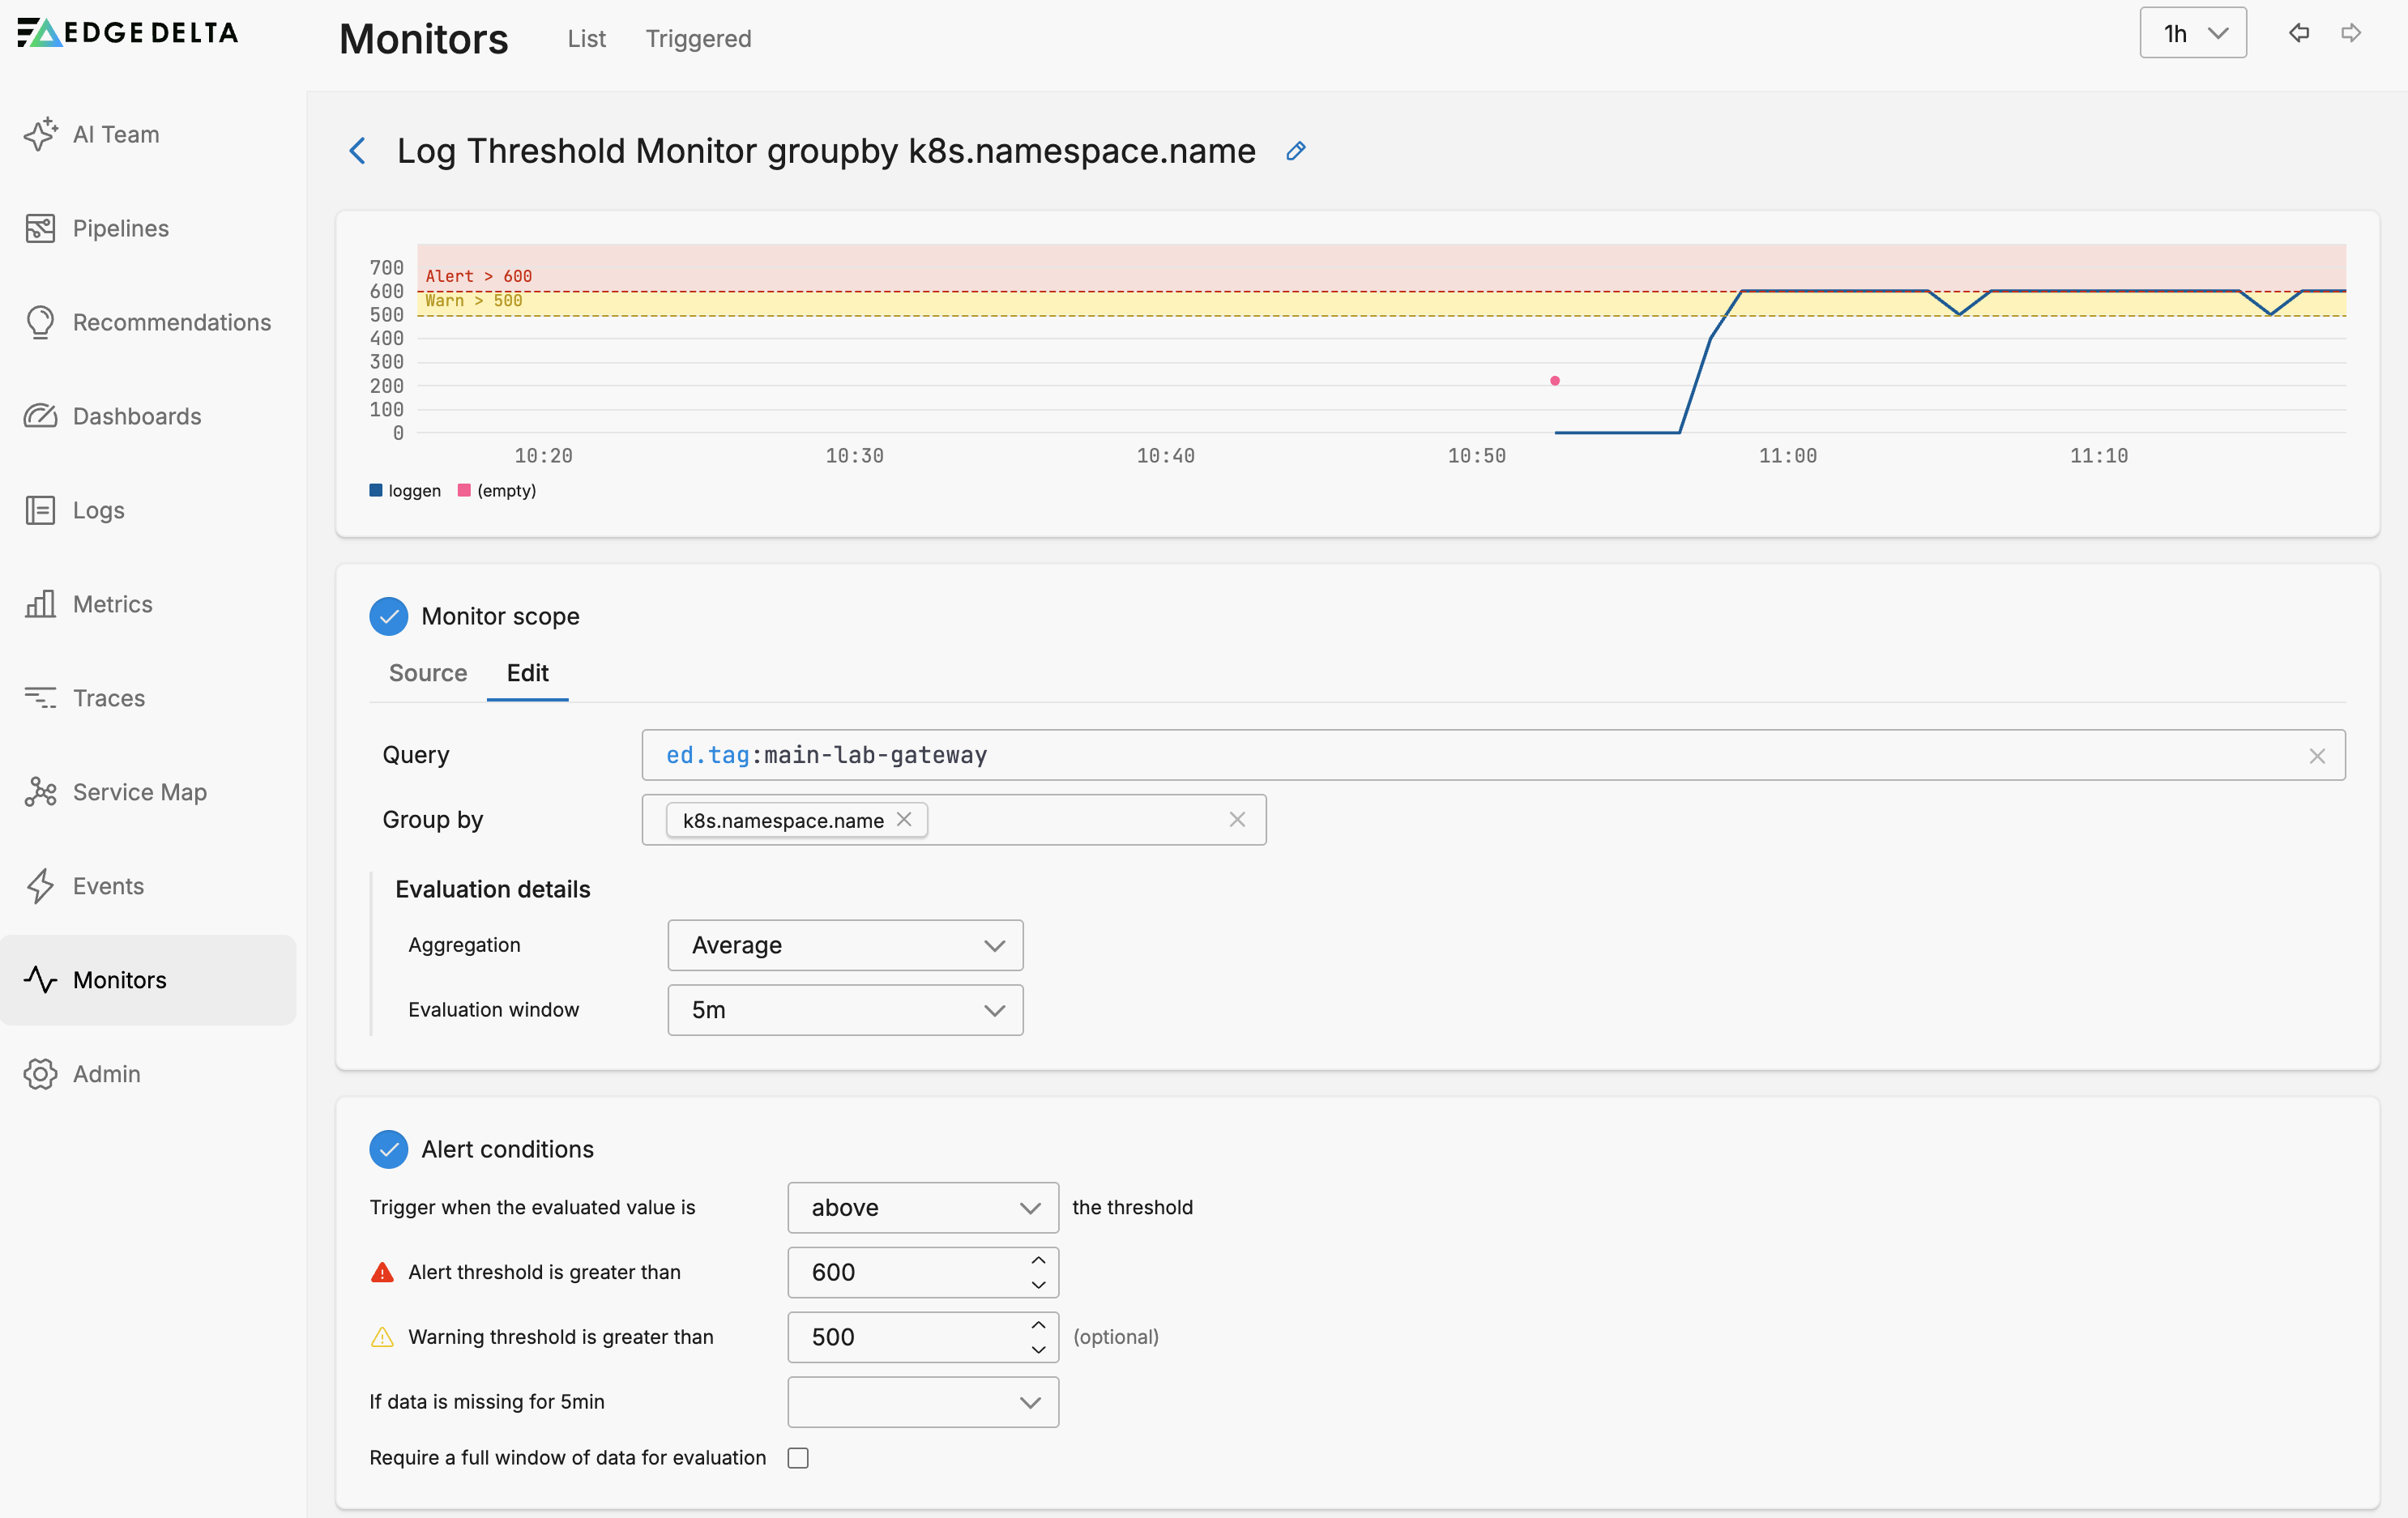
Monitor Scope
- Source: Use autocomplete to select the sources you want to monitor. For example you can specify a number of agent tags. If you leave this blank all sources will be monitored.
- Group by: You can group the monitored item by dimensions such as the agent tag, host, namespace etc. This option is required if you want to split notifications by group such as namespace. See Monitor Limits for group-by limits.
Evaluation Details
The Evaluation Details options evaluate the source data to determine a value.
- Aggregation: The function applied to the data to determine a value for evaluation against the thresholds.
- Evaluation Window: The duration at which to apply the Evaluation Details - Aggregation function.
Alert Conditions
Configure the thresholds that the monitored item should be evaluated against in this section. You can select a warning and an alert thresholds. As you add the thresholds they are displayed in the graph relative to the current source’s values. You can choose to trigger when the evaluated value is Above, Above or equal to, Below or Below or equal to the thresholds.
If Data is Missing
The If data is missing for <evaluation window> dropdown controls how the monitor behaves when no data points are available during the evaluation window. This setting determines whether missing data should be treated as a problem or simply ignored. The available options are:
- Evaluate as 0: Treats missing data points as zero values and proceeds with monitor evaluation. This can trigger alerts if your threshold is configured to detect low or zero values.
- Show No Data: Displays “No Data” status for the monitor but does not send notifications. Use this when you want visibility into data gaps without generating alerts.
- Show No Data and Notify: Displays “No Data” status and sends alert notifications. This is useful when missing data itself indicates a problem (e.g., a data pipeline failure).
- Show OK: Treats missing data as if everything is normal and displays an OK status. Use this for logs that may have legitimate gaps during off-hours or low-activity periods.
Require a Full Window of Data for Evaluation
The Require a full window of data for evaluation checkbox determines whether the monitor should wait for a complete evaluation window before making a decision. When enabled:
- The monitor will not evaluate until it has collected data for the entire evaluation window duration
- This prevents premature alerts during monitor startup or after data gaps
- Useful when you need high confidence that the evaluation is based on a complete dataset
When disabled, the monitor will evaluate based on whatever data is available, even if partial. This provides faster detection but may be less reliable during the initial evaluation period.
Notification
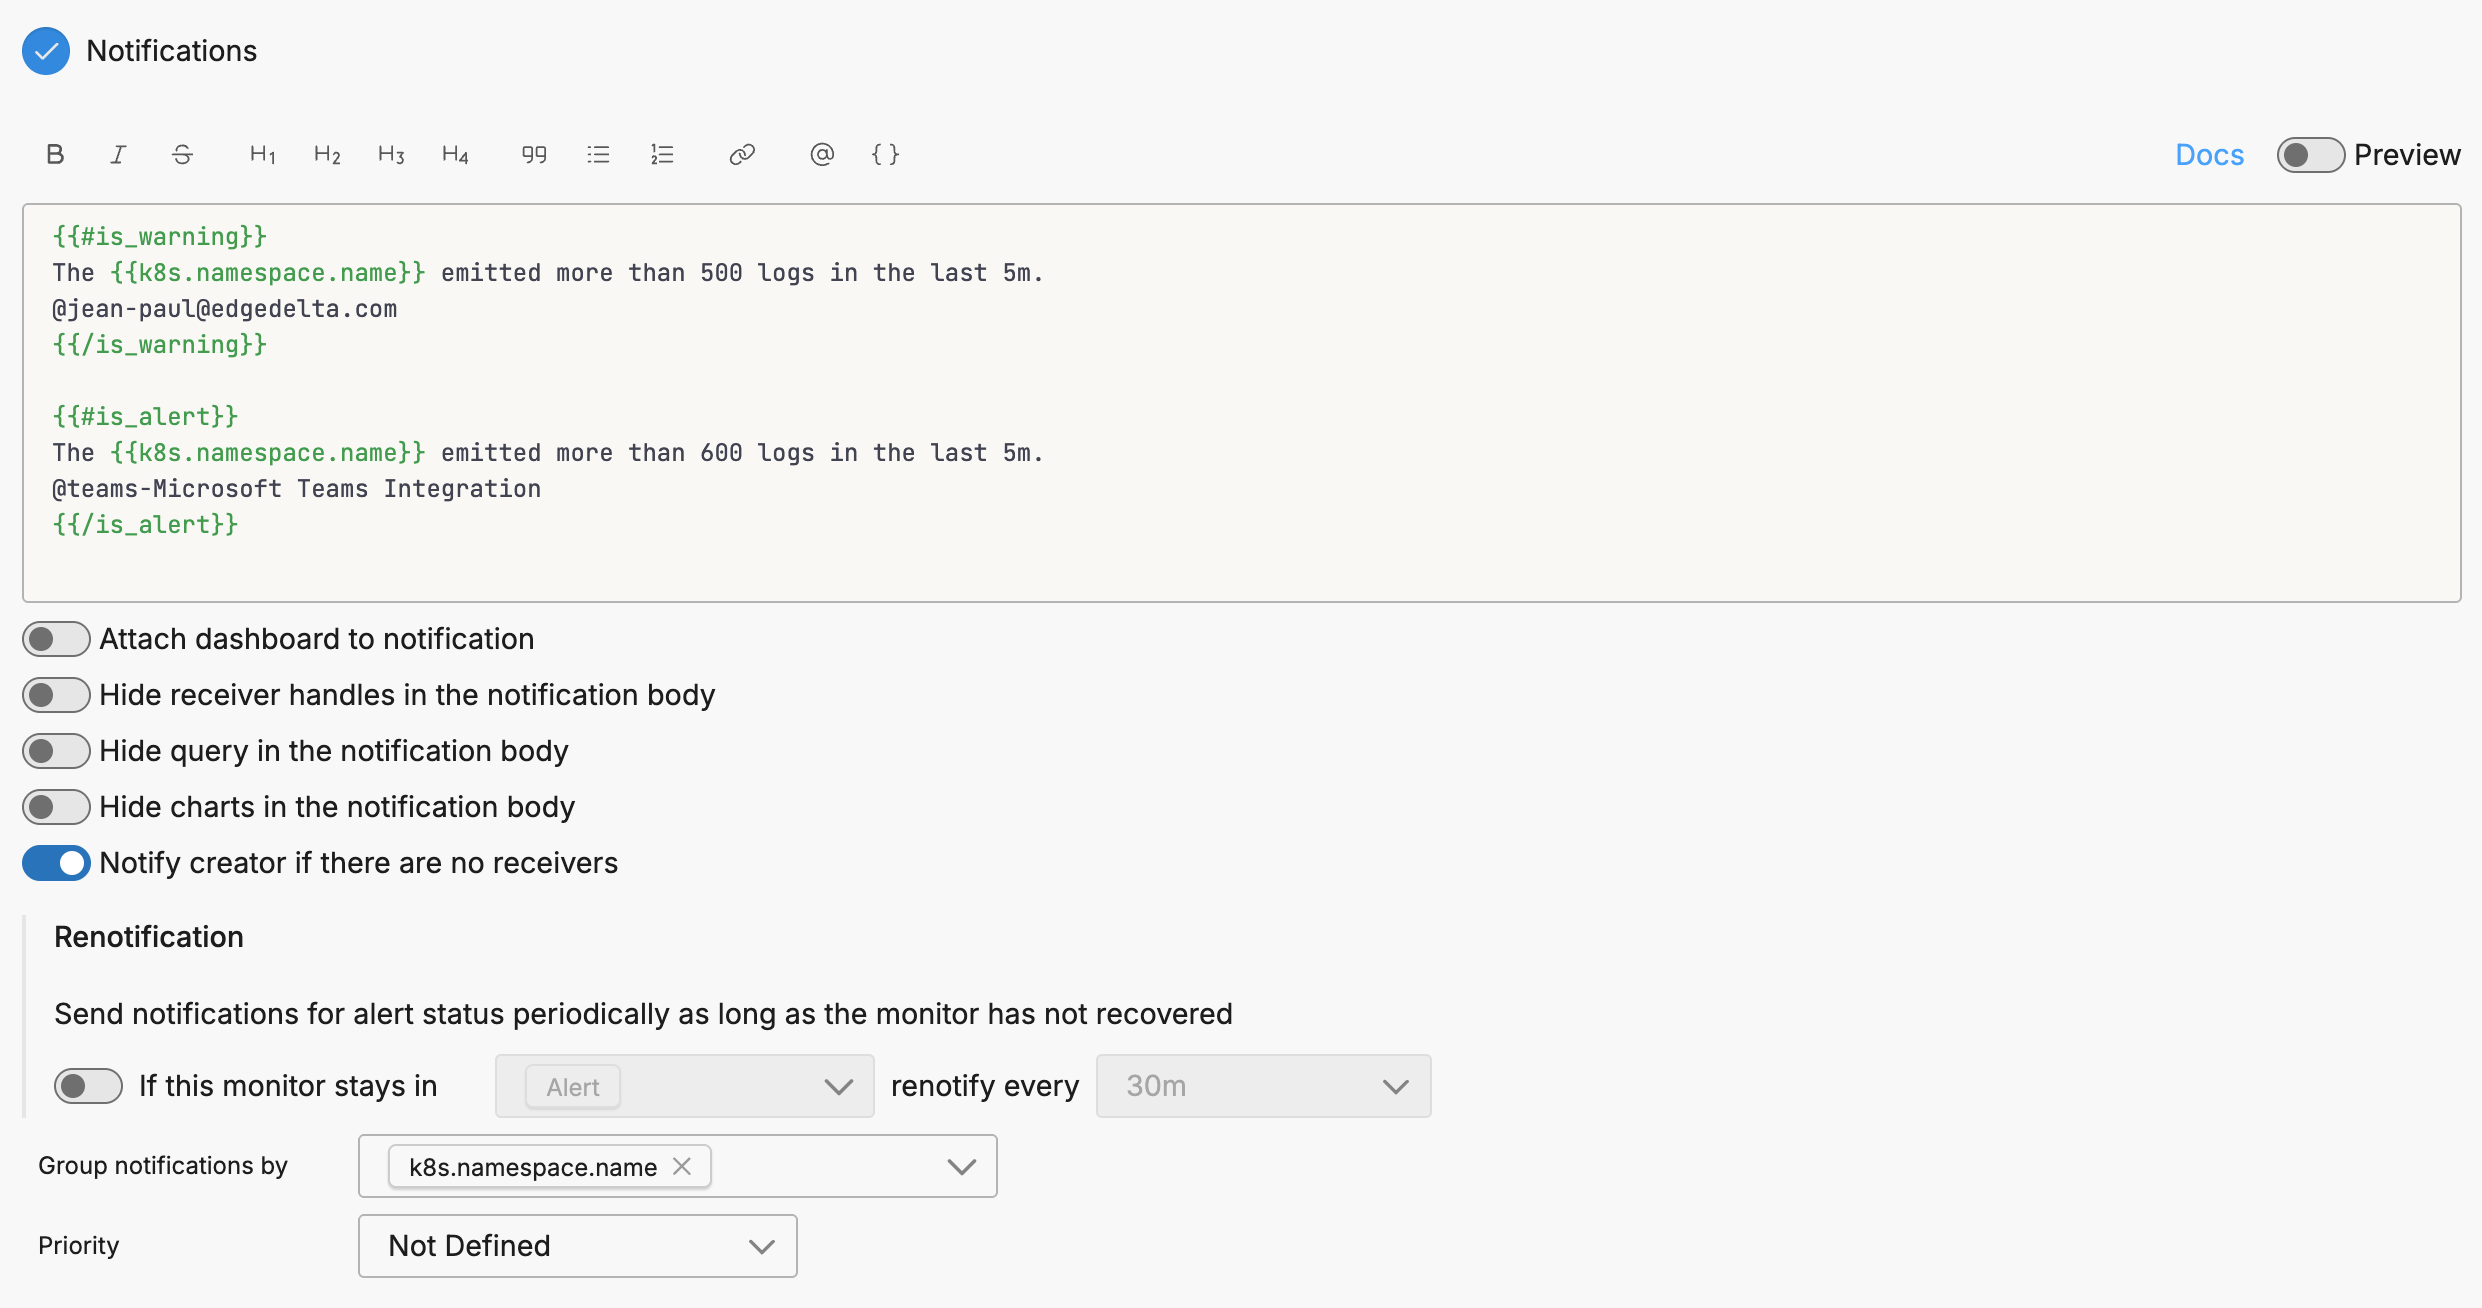
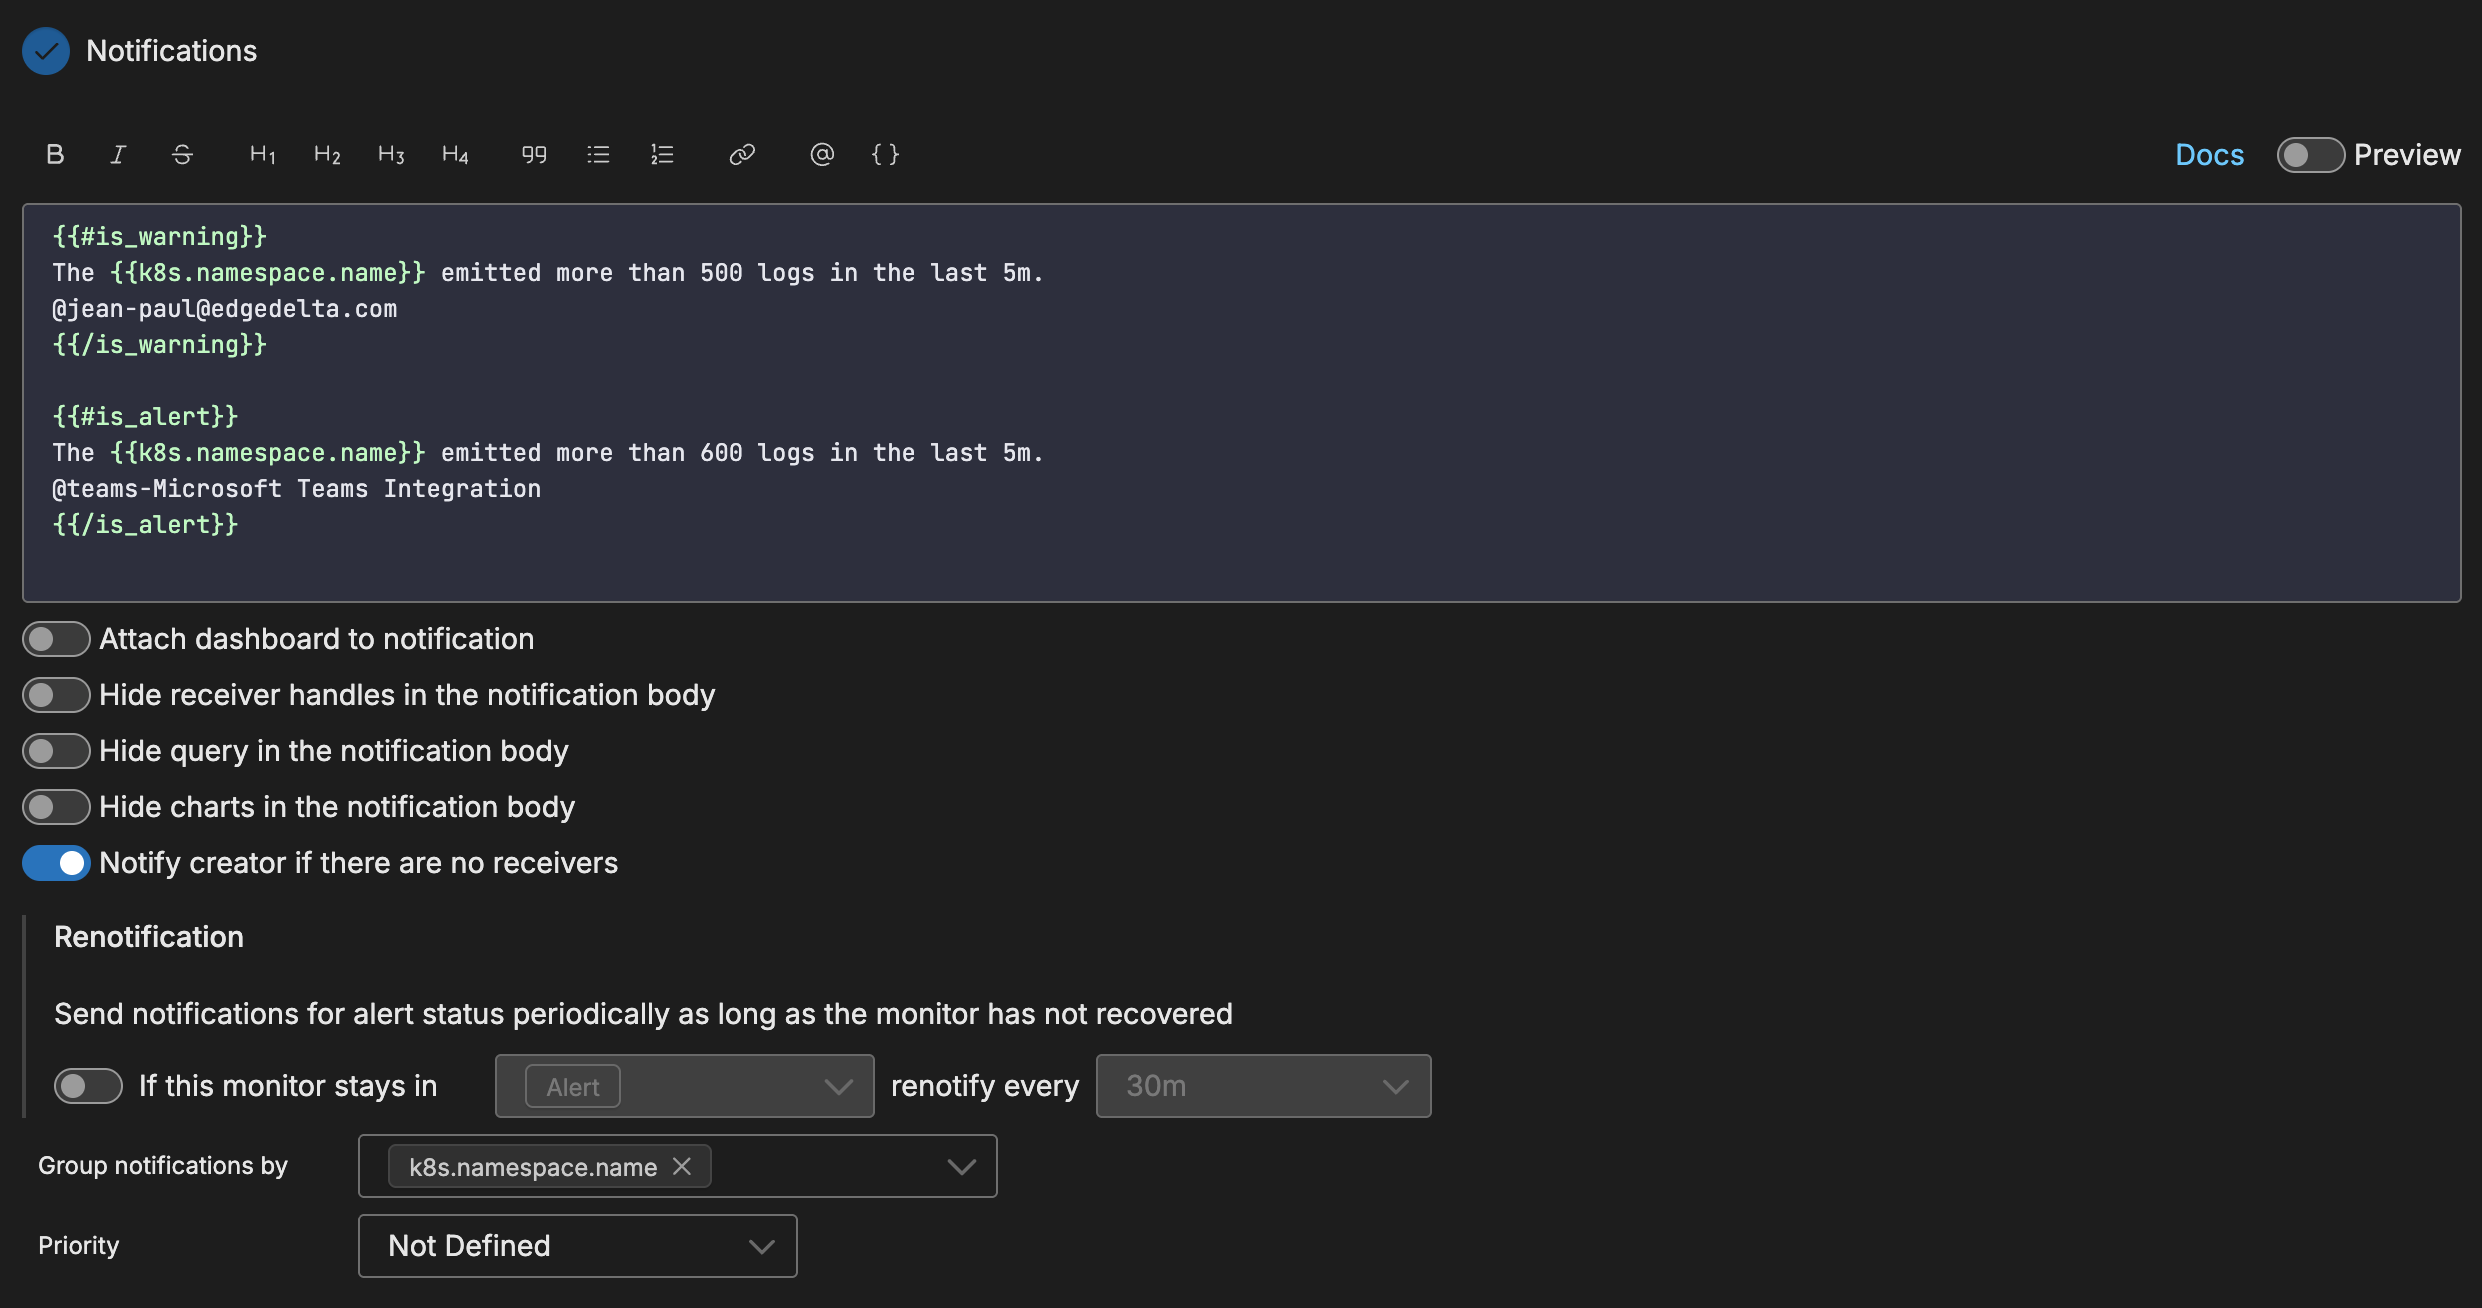
To use source fields in the notification you must specify them in the Group By field in the Monitor Scope section and in the Group notifications by field in the Notifications section.