Edge Delta Log to Pattern Metric Processor
9 minute read
Overview
The Log to Pattern Metric processor clusters log messages by structural similarity and generates metrics that summarize each identified pattern. This helps reduce log volume, improve observability hygiene, and power anomaly detection and pattern-based alerting workflows.
The processor applies a clustering algorithm based on Ragel and Drain Tree to group messages with similar structures. Metrics are emitted at a configurable interval and can be routed to any supported destination for analysis or monitoring.
This node replaces the legacy Log to Pattern node.
This node requires Edge Delta agent version v1.36.0 or higher.
Example Configuration
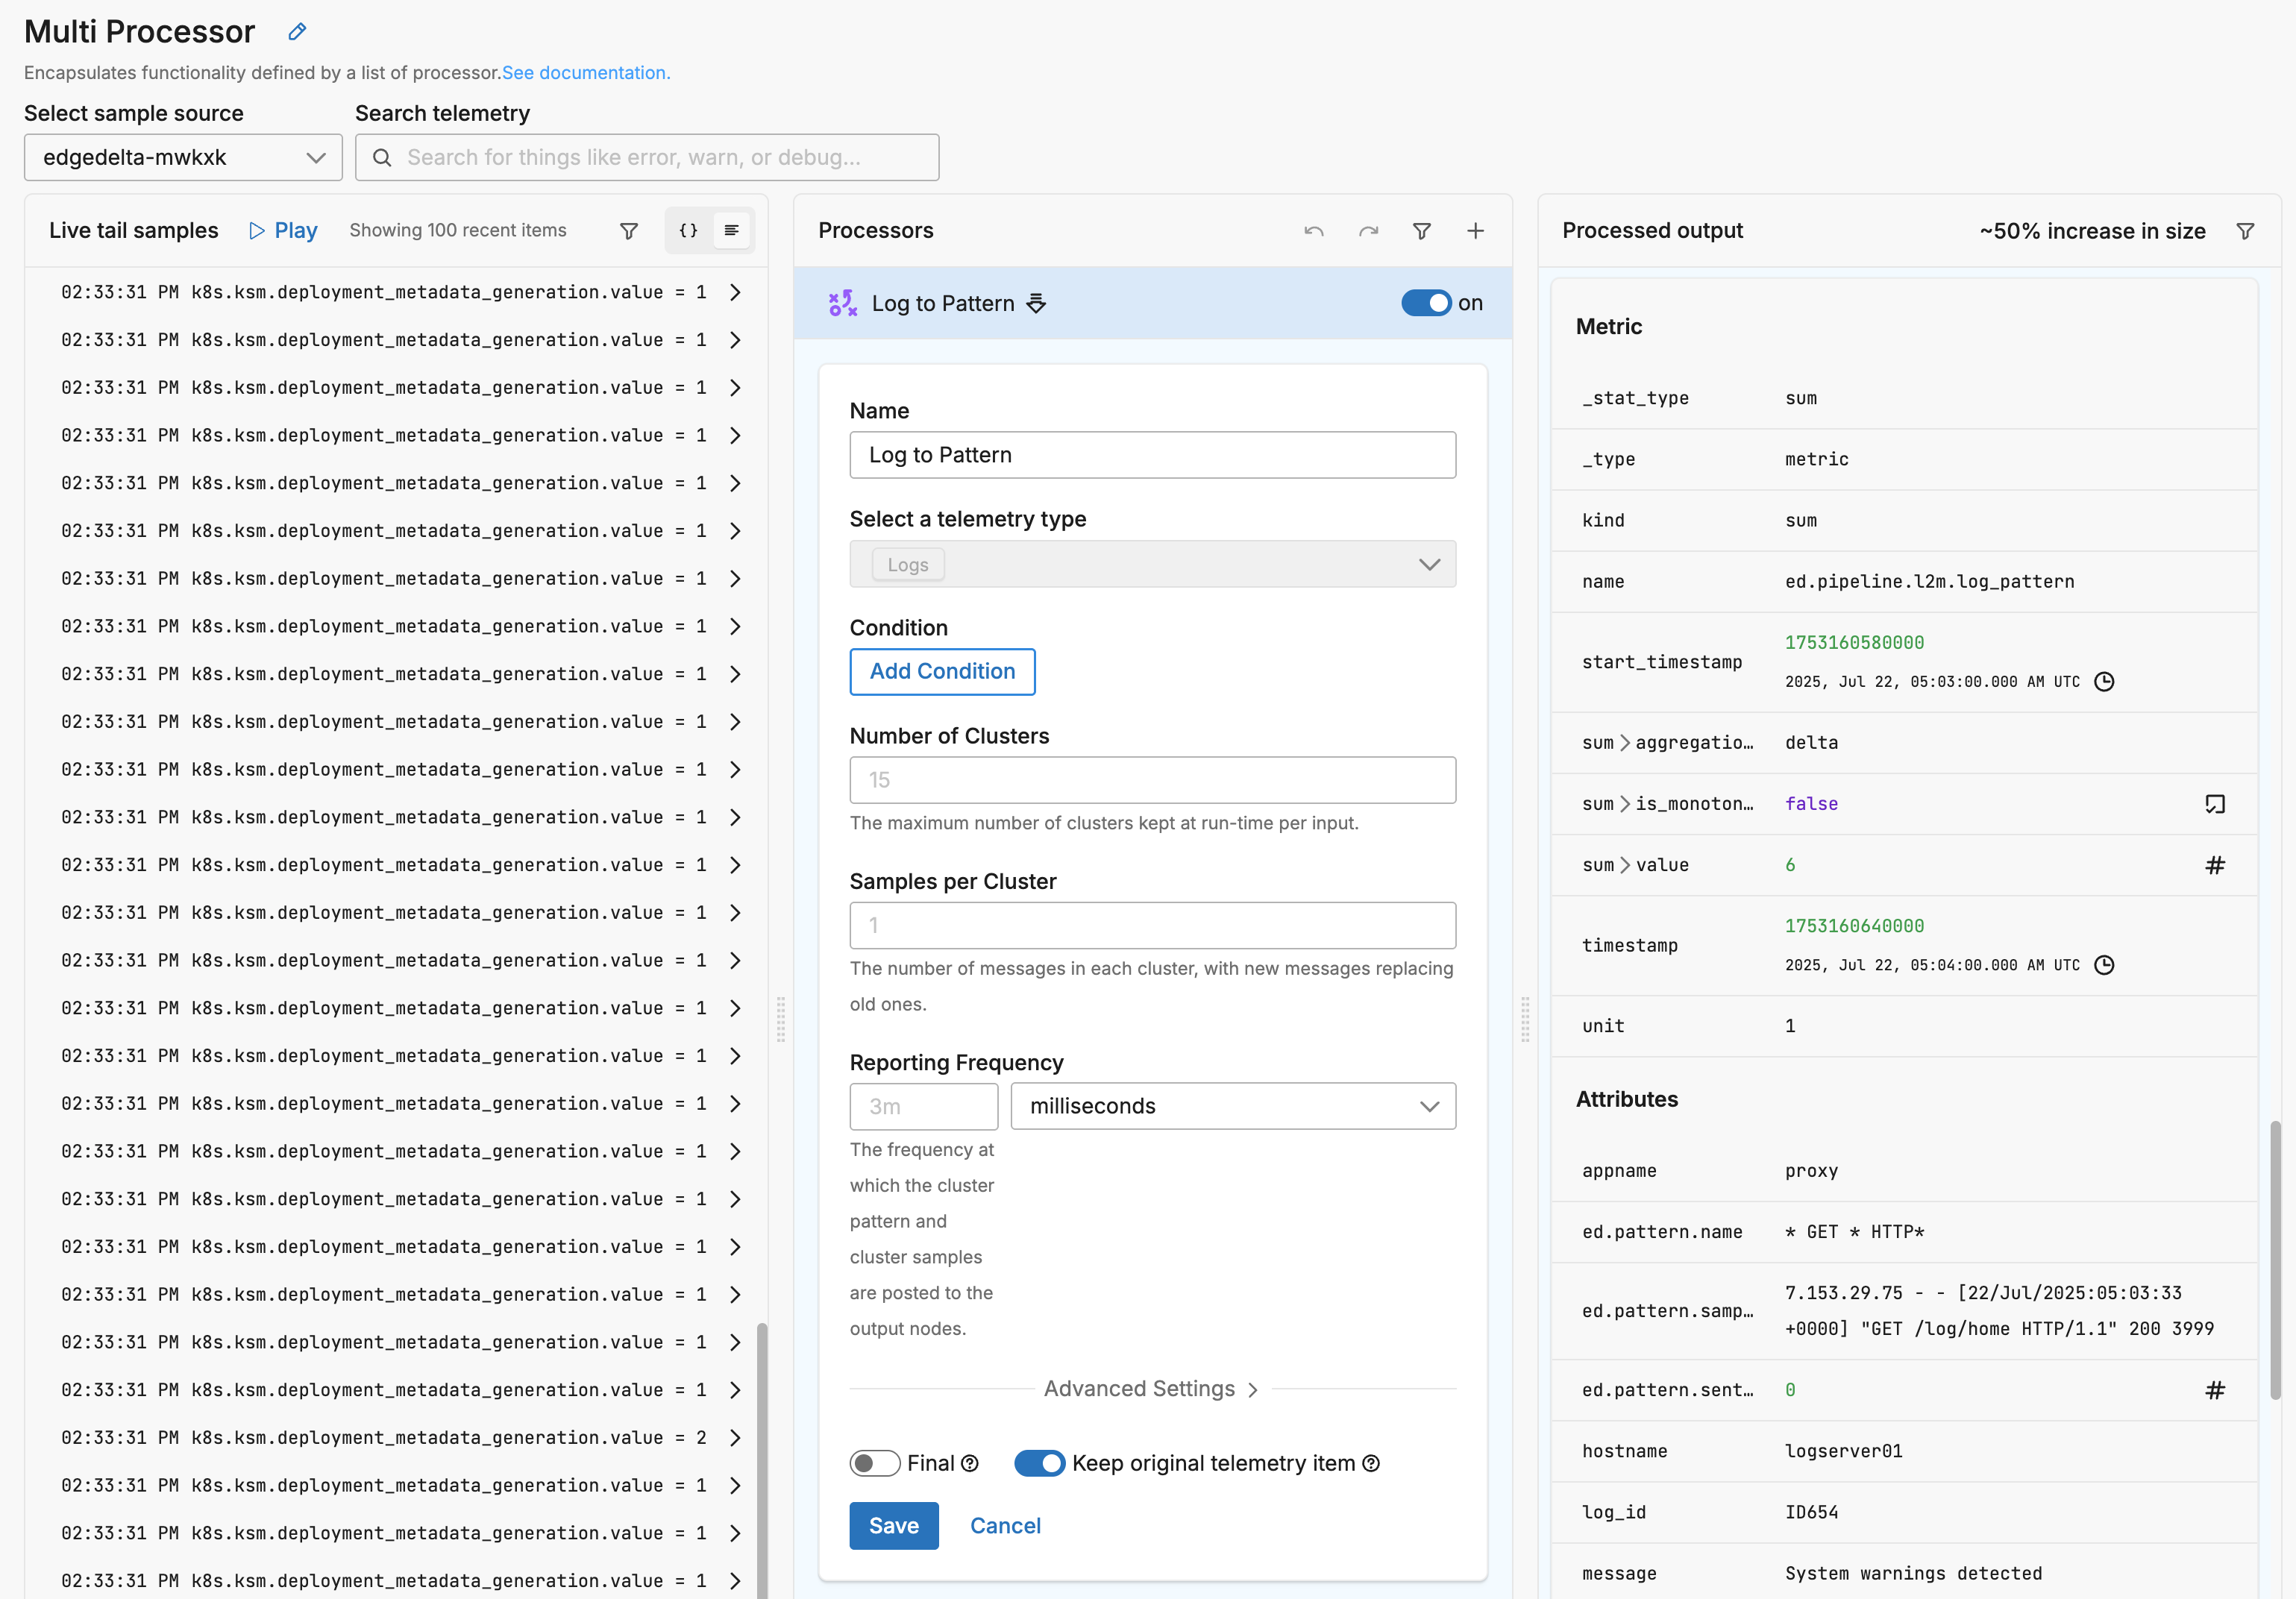
This configuration enables default log pattern detection for all logs sent to the Gateway pipeline. It applies a Log to Pattern Metric processor to all incoming telemetry, passively clustering similar logs and emitting metric-based summaries that describe the patterns observed. These metrics can then be visualized in the Patterns Explorer or used for downstream anomaly detection and alerting.
Because the configuration includes keep_item: true, it allows the original log data to continue downstream alongside the generated pattern metrics. This ensures that no data is lost or delayed, and that existing log delivery workflows remain unaffected.
nodes:
- name: ed_gateway_output_a3fa_multiprocessor
  type: sequence
  user_description: Multi Processor
  processors:
  - type: log_to_pattern_metric
    metadata: '{"id":"PFx6WVscVCyvar3NeKlFn","type":"log_to_pattern_metric","name":"Log
      to Pattern"}'
    keep_item: true
    data_types:
    - log
Example Input
7.153.29.75 - - [22/Jul/2025:05:03:33 +0000] "GET /log/home HTTP/1.1" 200 3999
Example Output Metric
{
  "_type": "metric",
  "timestamp": 1753160640000,
  "resource": {
    ...
  },
  "attributes": {
    "appname": "proxy",
    "ed.pattern.name": "* GET * HTTP*",
    "ed.pattern.samples": [
      "7.153.29.75 - - [22/Jul/2025:05:03:33 +0000] \"GET /log/home HTTP/1.1\" 200 3999"
    ],
    "ed.pattern.sentiment_score": 0,
    "hostname": "logserver01",
    "log_id": "ID654",
    "message": "System warnings detected",
    "pid": "28589",
    "syslog_priority": "11",
    "syslog_version": "1",
    "timestamp": "2025-07-22T05:03:33.442250Z"
  },
  "kind": "sum",
  "name": "ed.pipeline.l2m.log_pattern",
  "start_timestamp": 1753160580000,
  "sum": {
    "aggregation_temporality": "delta",
    "is_monotonic": false,
    "value": 6
  },
  "unit": "1",
  "_stat_type": "sum"
}
Options
condition
The condition parameter contains a conditional phrase of an OTTL statement. It restricts operation of the processor to only data items where the condition is met. Those data items that do not match the condition are passed without processing. You configure it in the interface and an OTTL condition is generated. It is optional.
Important: All conditions must be written on a single line in YAML. Multi-line conditions are not supported.
Comparison Operators
| Operator | Name | Description | Example |
|---|---|---|---|
== | Equal to | Returns true if both values are exactly the same | attributes["status"] == "OK" |
!= | Not equal to | Returns true if the values are not the same | attributes["level"] != "debug" |
> | Greater than | Returns true if the left value is greater than the right | attributes["duration_ms"] > 1000 |
>= | Greater than or equal | Returns true if the left value is greater than or equal to the right | attributes["score"] >= 90 |
< | Less than | Returns true if the left value is less than the right | attributes["load"] < 0.75 |
<= | Less than or equal | Returns true if the left value is less than or equal to the right | attributes["retries"] <= 3 |
matches | Regex match | Returns true if the string matches a regular expression (generates IsMatch function) | IsMatch(attributes["name"], ".*\\.log$") |
Logical Operators
Important: Use lowercase and, or, not - uppercase operators will cause errors!
| Operator | Description | Example |
|---|---|---|
and | Both conditions must be true | attributes["level"] == "ERROR" and attributes["status"] >= 500 |
or | At least one condition must be true | attributes["log_type"] == "TRAFFIC" or attributes["log_type"] == "THREAT" |
not | Negates the condition | not IsMatch(attributes["path"], "^/health") |
Functions
| Function | Description | Example |
|---|---|---|
IsMatch | Returns true if string matches the regex pattern | IsMatch(attributes["message"], "ERROR\|FATAL") |
Field Existence Checks
| Check | Description | Example |
|---|---|---|
!= nil | Field exists (not null) | attributes["user_id"] != nil |
== nil | Field doesn’t exist | attributes["optional_field"] == nil |
!= "" | Field is not empty string | attributes["message"] != "" |
Common Examples
- name: _multiprocessor
  type: sequence
  processors:
  - type: <processor type>
    # Simple equality check
    condition: attributes["request"]["path"] == "/json/view"

  - type: <processor type>
    # Multiple values with OR
    condition: attributes["log_type"] == "TRAFFIC" or attributes["log_type"] == "THREAT"

  - type: <processor type>
    # Excluding multiple values (NOT equal to multiple values)
    condition: attributes["log_type"] != "TRAFFIC" and attributes["log_type"] != "THREAT"

  - type: <processor type>
    # Complex condition with AND/OR/NOT
    condition: (attributes["level"] == "ERROR" or attributes["level"] == "FATAL") and attributes["env"] != "test"

  - type: <processor type>
    # Field existence and value check
    condition: attributes["user_id"] != nil and attributes["user_id"] != ""

  - type: <processor type>
    # Regex matching on attributes
    condition: IsMatch(attributes["path"], "^/api/") and not IsMatch(attributes["path"], "^/api/health")

  - type: <processor type>
    # Regex matching on body (case-insensitive)
    condition: IsMatch(body, "(?i)error")
Common Mistakes to Avoid
# WRONG - Cannot use OR/AND with values directly
condition: attributes["log_type"] != "TRAFFIC" OR "THREAT"

# CORRECT - Must repeat the full comparison
condition: attributes["log_type"] != "TRAFFIC" and attributes["log_type"] != "THREAT"

# WRONG - Uppercase operators
condition: attributes["status"] == "error" AND attributes["level"] == "critical"

# CORRECT - Lowercase operators
condition: attributes["status"] == "error" and attributes["level"] == "critical"

# WRONG - Multi-line conditions
condition: |
  attributes["level"] == "ERROR" and
  attributes["status"] >= 500

# CORRECT - Single line (even if long)
condition: attributes["level"] == "ERROR" and attributes["status"] >= 500
num_of_clusters
Defines the maximum number of clusters the processor will retain for each input group. Each cluster corresponds to a unique log pattern. The default is 15, and the value must be greater than zero.
nodes:
- name: gateway_output
  type: sequence
  processors:
  - type: log_to_pattern_metric
    num_of_clusters: 20
samples_per_cluster
Specifies how many sample log messages are stored for each cluster. As new matching logs are processed, older samples are replaced. The default is 1.
nodes:
- name: gateway_output
  type: sequence
  processors:
  - type: log_to_pattern_metric
    samples_per_cluster: 3
reporting_frequency
Sets how often the processor emits metrics for each pattern. The value is specified as a duration. By default, metrics are reported every 3m.
nodes:
- name: gateway_output
  type: sequence
  processors:
  - type: log_to_pattern_metric
    reporting_frequency: 1m
Patterns are visualized in the Patterns Explorer in time buckets. Consider setting this below 1 minute to increase resolution.
field_path
Indicates which field in the log message is used for clustering. If this parameter is not set, the body field is used by default. This allows pattern detection to focus on specific message content when desired.
Sentiment analysis runs against the field specified by
field_path. Iffield_pathis not set (the default), sentiment keywords from Global Data Settings are matched against thebodyfield only. Keywords that appear in log attributes but not in the body are not detected. Tokenization is whitespace-based: a keyword likeunauthorizeddoes not match a compound token such asUnauthorizedOperation. To include attribute content in sentiment analysis, setfield_pathto the relevant attribute.
nodes:
- name: gateway_output
  type: sequence
  processors:
  - type: log_to_pattern_metric
    field_path: item["attributes"]["payload"]
group_by
Defines one or more expressions used to partition logs into separate clustering groups. If not specified, logs are grouped using an internal default (typically based on source metadata). This parameter is hidden but can be customized for advanced use cases.
nodes:
- name: gateway_output
  type: sequence
  processors:
  - type: log_to_pattern_metric
    group_by:
    - item["resource"]["service.name"]
retire_period
Sets the inactivity timeout for a pattern. If a pattern does not appear for the specified duration, it is retired and removed from memory. The default value is 10m.
nodes:
- name: gateway_output
  type: sequence
  processors:
  - type: log_to_pattern_metric
    retire_period: 15m
throttle_limit_per_sec
Limits the number of logs the processor will evaluate for clustering per second, per source. This helps control CPU and memory usage. The default is 200.
nodes:
- name: gateway_output
  type: sequence
  processors:
  - type: log_to_pattern_metric
    throttle_limit_per_sec: 300
drain_tree_depth
Controls the depth of the Drain Tree used in the pattern clustering algorithm. A deeper tree enables finer-grained pattern matching but consumes more memory. The default is 7, and valid values range from 4 to 15.
nodes:
- name: gateway_output
  type: sequence
  processors:
  - type: log_to_pattern_metric
    drain_tree_depth: 10
drain_tree_max_child
Defines the maximum number of child nodes each Drain Tree level can have. Larger values allow more specific clustering but increase memory use. The default is 100, and acceptable values range from 50 to 200.
nodes:
- name: gateway_output
  type: sequence
  processors:
  - type: log_to_pattern_metric
    drain_tree_max_child: 150
similarity_threshold
Specifies how similar a log must be to an existing pattern to be grouped with it. This value ranges from 0.0 to 1.0. Higher values produce more granular patterns by requiring stronger similarity. The default is 0.5.
nodes:
- name: gateway_output
  type: sequence
  processors:
  - type: log_to_pattern_metric
    similarity_threshold: 0.7
disable_clustering_by_severity_level
By default, the processor clusters logs separately based on severity level (e.g., INFO, WARN, ERROR). Setting this to true disables that behavior, allowing clustering across severity levels.
nodes:
- name: gateway_output
  type: sequence
  processors:
  - type: log_to_pattern_metric
    disable_clustering_by_severity_level: true
Final
Determines whether successfully processed data items should continue through the remaining processors in the same processor stack. If final is set to true, data items output by this processor are not passed to subsequent processors within the node—they are instead emitted to downstream nodes in the pipeline (e.g., a destination). Failed items are always passed to the next processor, regardless of this setting.
The UI provides a slider to configure this setting. The default is false. It is defined in YAML as follows:
- name: multiprocessor
  type: sequence
  processors:
    - type: <processor type>
    final: true
Keep original telemetry item
Controls whether the original, unmodified telemetry item is preserved after processing. If keep_item is set to true, the processor emits both:
- The original telemetry item (e.g., a log), and
- Any new item generated by the processor (e.g., a metric extracted from the log)
Both items are passed to the next processor in the stack unless final is also set.
Interaction with final
If final: true is enabled, any successfully processed data items, whether original, newly created, or both, exit the processor stack or node immediately. No subsequent processors within the same node are evaluated, although downstream processing elsewhere in the pipeline continues. This means:
- If
keep_item: trueandfinal: true, both the original and processed items bypass the remaining processors in the current node and are forwarded to downstream nodes (such as destinations). - If
keep_item: falseandfinal: true, only the processed item continues beyond this processor, skipping subsequent processors in the stack, and the original item is discarded.
Note: If the data item fails to be processed, final has no effect, the item continues through the remaining processors in the node regardless of the keep_item setting.
The app provides a slider to configure keep_item. The default is false.
- name: ed_gateway_output_a3fa_multiprocessor
  type: sequence
  processors:
    - type: <processor_type>
      keep_item: true
      final: true
Visualization and Alerting
When sent to the Edge Delta destination, pattern metrics generated by this processor appear in:
- The Patterns Explorer, grouped by pattern, sentiment, and lifecycle
- The Anomaly Detection system, which evaluates pattern metrics for spikes, new pattern emergence, or volatility
Alternatively they can be sent to supported metric destination (e.g., Prometheus, Datadog, etc.)
You can also use this processor in conjunction with the Log to Metric node to enrich metrics with additional attributes or create advanced alerting criteria.
Learn More about Patterns
See Also
- For an overview and to understand processor sequence flow, see Processors Overview
- To learn how to configure a processor, see Configure a Processor.
- For optimization strategies, see Best Practices for Edge Delta Processors.
- If you’re new to pipelines, start with the Pipeline Quickstart Overview or learn how to Configure a Pipeline.
- Looking to understand how processors interact with sources and destinations? Visit the Pipeline Overview.