Troubleshooting Log Timestamps
5 minute read
Background
Log timestamps are generated by workloads at the moment the log is emitted. This timestamp is generally reflected in the item["body"] of the log when it is ingested by the Edge Delta agent.
The item["timestamp"] attribute is created as Unix time in milliseconds at the moment the log is ingested by the Edge Delta agents on the edge. The log search page renders this timestamp in your local timezone.
Overview
Sometimes there is a delay between when the log is created and when it is ingested by the pipeline. This can lead to a slight difference between the two timestamps.
There are many factors that might affect the difference between the emitted and the ingested timestamps. Here are just two examples:
Network Latency and Log Batching Strategies: When logs are transported across a network, especially in distributed systems, network latency can play a significant role. Moreover, if log batching is employed to reduce the number of network requests, this may introduce additional wait times before logs are sent to the Edge Delta pipeline.
Serverless Architectures like AWS Lambda: When using serverless functions such as AWS Lambda, logs may not be emitted immediately. Instead, they are typically batched and processed at the end of the function execution, which can cause a delay in ingestion by the Edge Delta pipeline.
See Troubleshoot Latency for more information.
Consider the following log:
{2024-09-16T02:28:52.094Z} [ {1234} ] {{298312818-600780716}} <{WARN}> ({server}({demo-application})?|clickhouse-server): {User input validation failed}
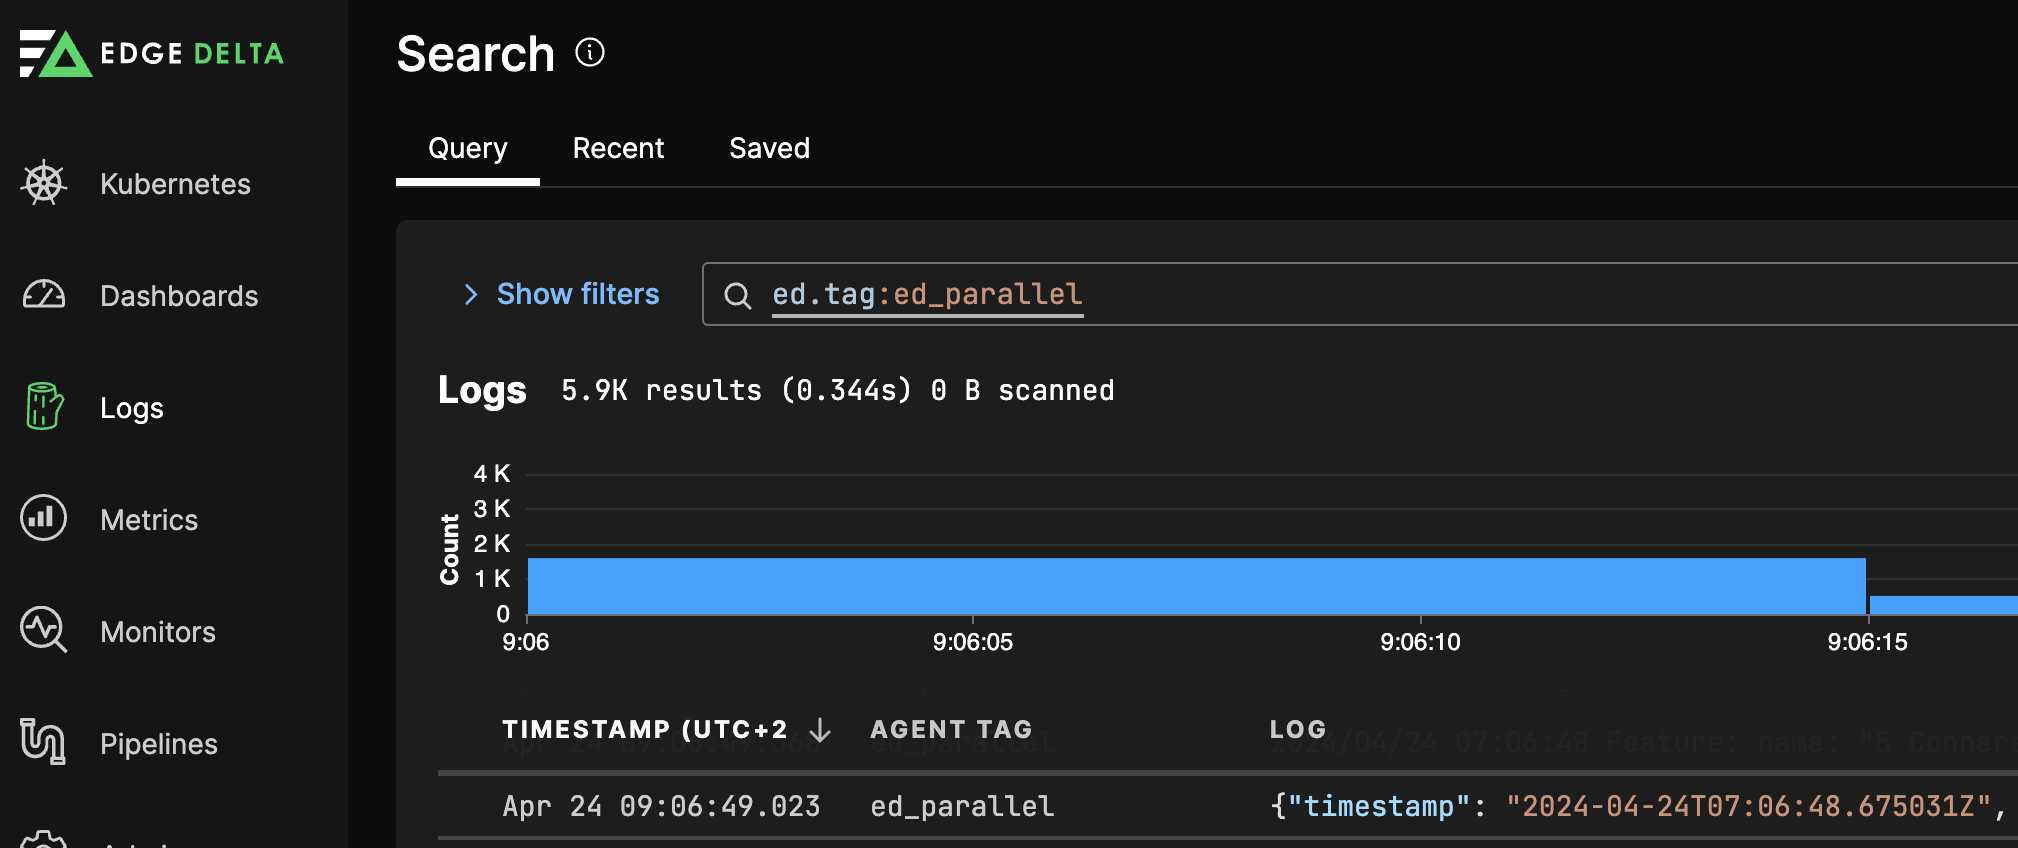
This log was created by the workload at 02:28:52.094 UTC (or 11:58:02.094 UTC+9.5). However, when viewing the same log in Log Search, the timestamp shows a time of 11:59:02.127 (UTC+9.5):

When corrected for timezone, the timestamps shows a time difference of 10.33 seconds. While this may seem like a trivial difference, it could result in logs being viewed out of order in Log Search when sorted by timestamp. This could make it more difficult to determine the root cause of issues highlighted by the logs.
If this is an issue for your environment, consider transforming the item["timestamp"] to match the item["body"] timestamp using a Parse Timestamp Processor.
A demo of using this processor to adjust the time is in the Pipeline quickstart section.
Troubleshoot Latency
There are a number of reasons for latency from the moment of telemetry creation to the moment of data ingestion by the Edge Delta agent. Use these steps to troubleshoot this issue:
- Measure network latency. Monitor the network between the source and the destination to identify potential bottlenecks. You can add a field to capture the delay between timestamps using a math CEL function. In addition, use tools like ping, traceroute, or network monitoring software to assess latency.
- Review log batching and buffering configurations. If you have telemetry processing components upstream of or before the Edge Delta agent, such as an OTEL collector, examine their configuration and the configuration of your data sources to ensure batching and buffering settings align with your latency requirements. Adjust the size and timeout settings of buffers and batches to reduce delay. Also check for upstream log aggregation services and check their processing delays and configurations.
- Synchronize system clocks. Verify time synchronization across all systems involved in log generation, transport, and ingestion. Ensure NTP is configured and operational on all systems.
- Inspect serverless functions. For environments like AWS Lambda, review function execution times and the timing of log events.
- Monitor resources. Monitor system resources to ensure there are no CPU, memory, or I/O bottlenecks.
- Perform end-to-end testing. Send test logs through the system and manually track their journey to identify where delays occur. Document the time at each stage from generation to ingestion.
By systematically analyzing and addressing each potential cause, you can narrow down the reasons for the discrepancies and take appropriate actions to minimize delays.
Timestamp Format Conversions
Converting Unix Milliseconds to ServiceNow Format
When integrating with ServiceNow or other systems that require timestamps in YYYY-MM-DD HH:MM:SS format, you can convert Unix millisecond timestamps using OTTL statements with the cache object for intermediate calculations.
Example: Convert Unix milliseconds to ServiceNow timestamp format
processors:
  - type: ottl_transform
    statements: |
      // Store Unix milliseconds timestamp in cache (with null/empty checks)
      set(cache["ts_ms"], Int(attributes["event_timestamp_ms"])) where attributes["event_timestamp_ms"] != nil and attributes["event_timestamp_ms"] != ""

      // Convert milliseconds to seconds
      set(cache["ts_sec"], cache["ts_ms"]/1000) where cache["ts_ms"] != nil

      // Format as ServiceNow timestamp (YYYY-MM-DD HH:MM:SS)
      set(attributes["servicenow_timestamp"], FormatTime(Unix(cache["ts_sec"]), "%Y-%m-%d %H:%M:%S")) where cache["ts_sec"] != nil
How it works:
- Extract timestamp to cache: The first statement extracts the Unix millisecond timestamp from the log attributes and converts it to an integer, storing it in
cache["ts_ms"]. Thewhereclause ensures this only happens if the field exists and is not empty. - Convert to seconds: The second statement divides the milliseconds by 1000 to get Unix seconds, stored in
cache["ts_sec"]. - Format the timestamp: The final statement uses
FormatTime(Unix(cache["ts_sec"]), "%Y-%m-%d %H:%M:%S")to convert the Unix seconds to ServiceNow’s expected format.
Input example:
{
  "event_timestamp_ms": 1726451332094,
  "message": "User login successful"
}
Output:
{
  "event_timestamp_ms": 1726451332094,
  "message": "User login successful",
  "servicenow_timestamp": "2024-09-16 02:28:52"
}
The resulting servicenow_timestamp attribute can then be used when sending data to ServiceNow or other systems requiring this timestamp format.
Note: The cache object is used for intermediate calculations and is not included in the final output. Only the formatted servicenow_timestamp attribute is added to the log.