Metric Change Monitor
7 minute read
Overview
Metric change monitors detect significant changes in metric behavior over time by comparing current values to a historical offset. This allows you to identify trends like sudden spikes, slow drifts, or regression to baseline without needing static thresholds.
Create Metric Change Monitor
To create a Metric Change monitor,
- Click Monitors and select the Triggered tab.
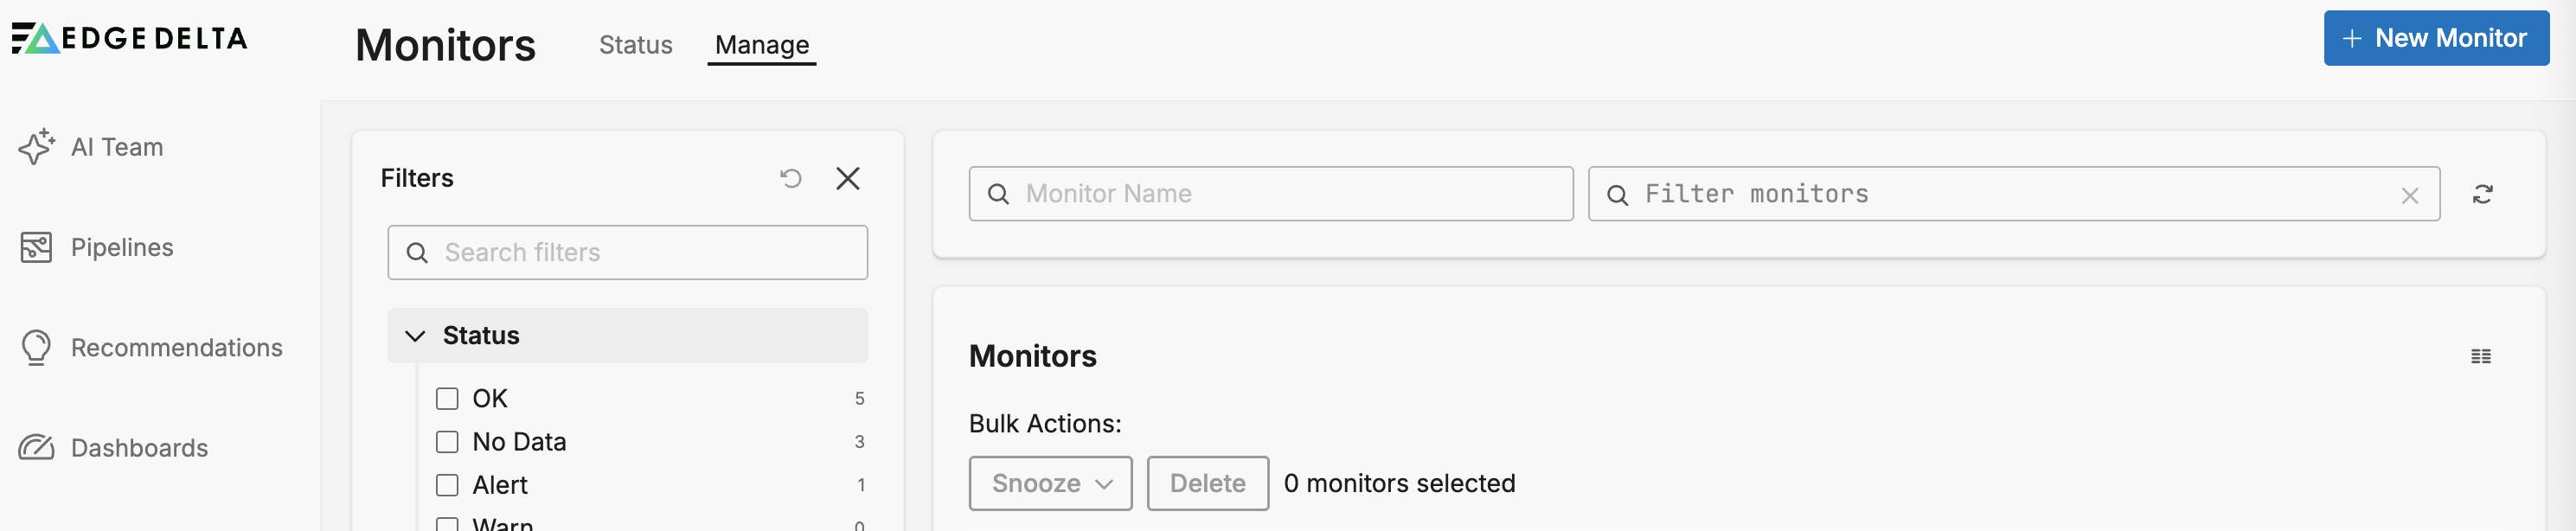

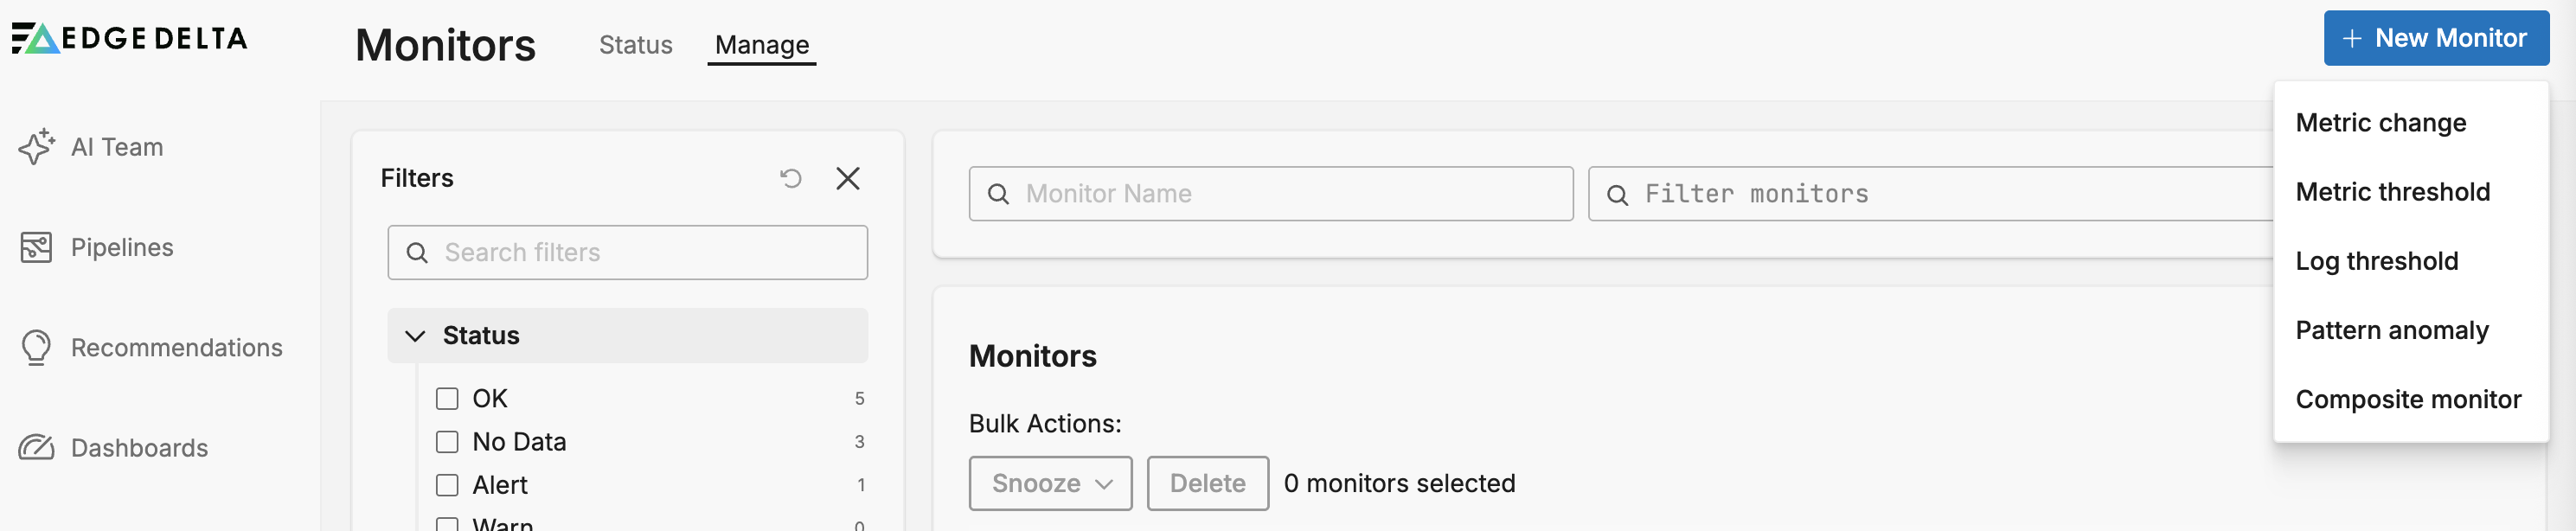
- Click + New Monitor and select Metric Change.

Key Configuration Fields
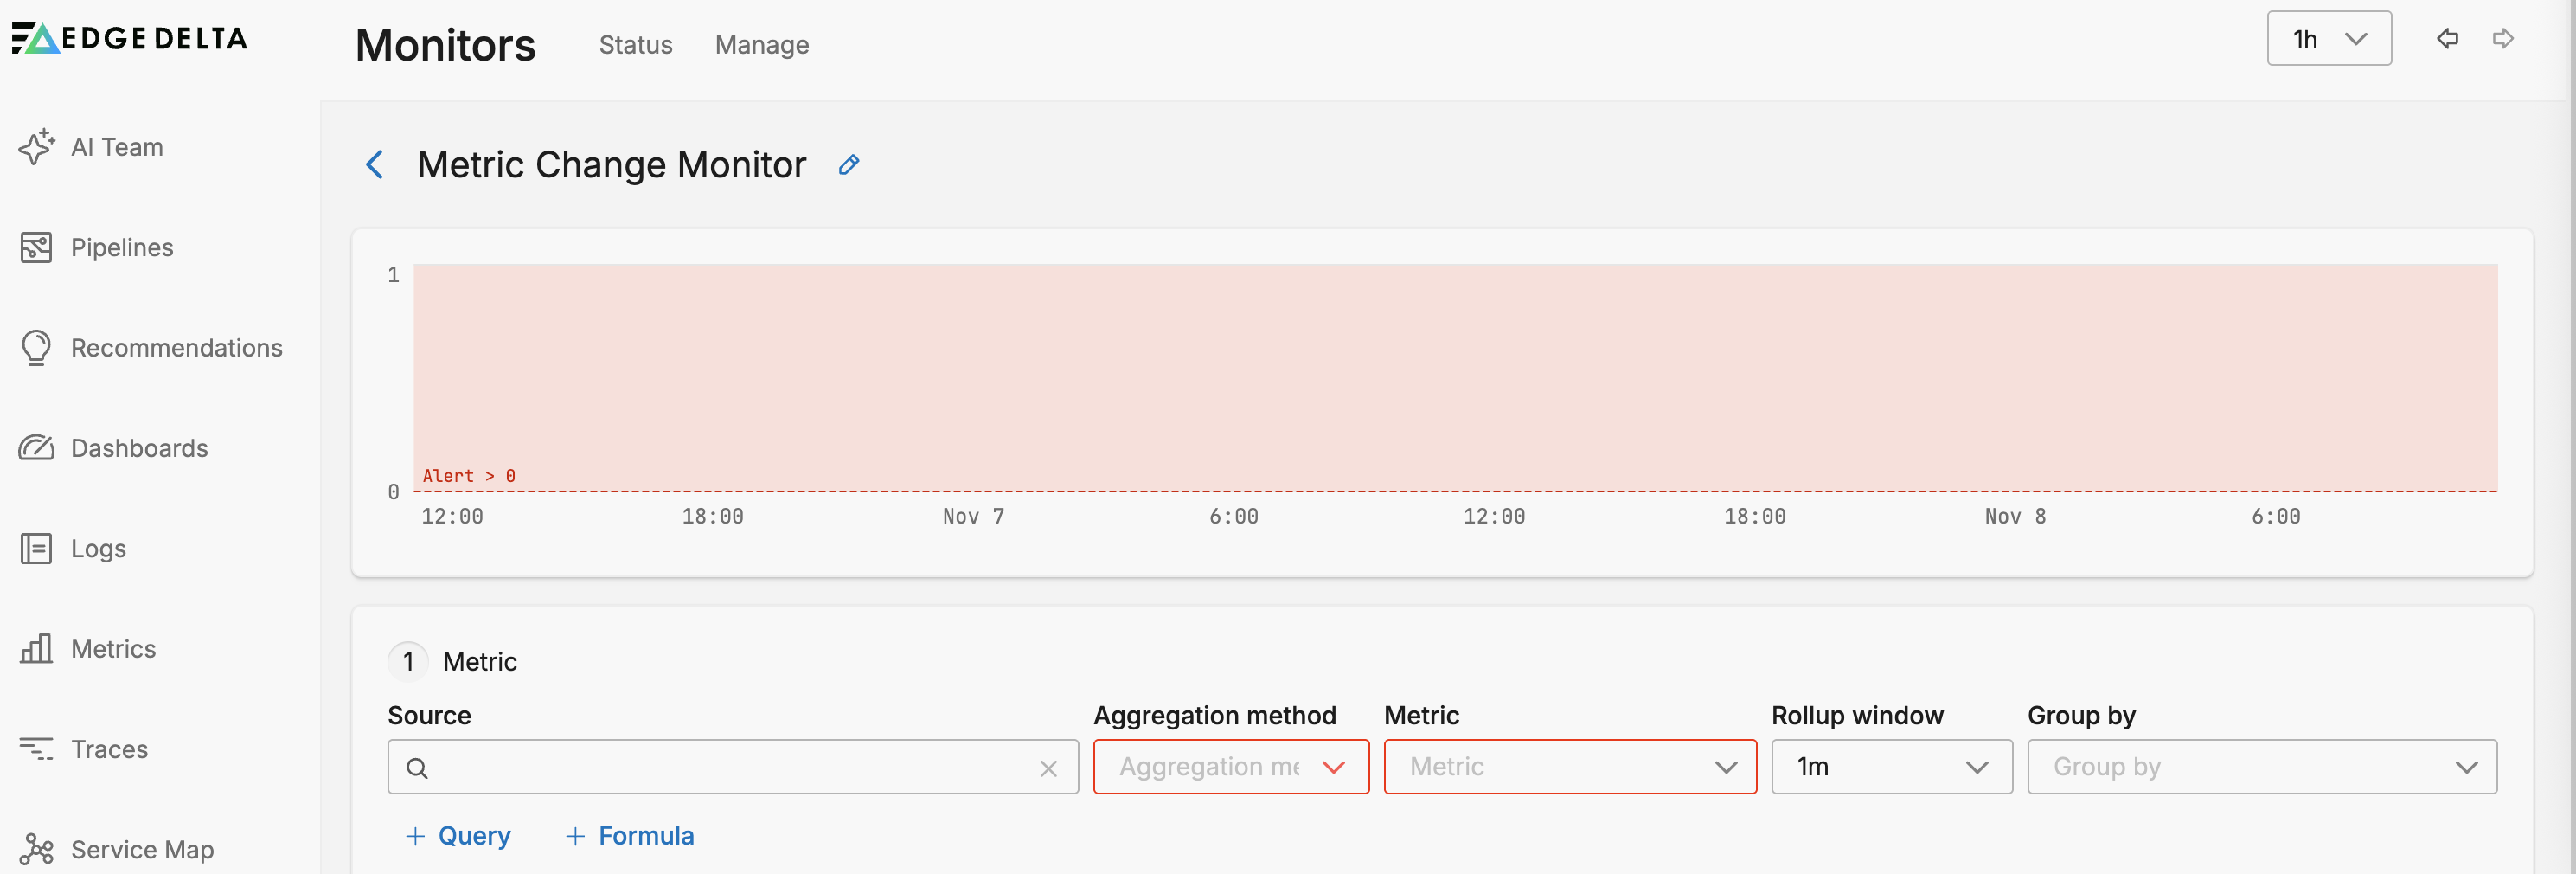

Source
The Source defines which metrics the monitor evaluates. This is typically scoped to a subset of services or environments using tags, dimensions, or labels. For example, a tag like ed.tag:"main-lab-gateway" restricts the monitor to only evaluate metrics emitted by a specific pipeline. Using a scoped source helps eliminate noise and ensures relevance to the target system.
Metric
The Metric specifies the exact telemetry signal being monitored—such as latency, request rate, or error count. Choosing the right metric is essential to detect changes that matter to your application’s performance or reliability. Use the metrics explorer and metrics inventory to determine the right metrics to monitor. You can also create formula based on multiple metric queries to evaluate against.
Group By
You can group the monitored item by dimensions such as the agent tag, host, namespace, or service name. This option is required if you want to split notifications by group. See Monitor Limits for group-by limits.
Aggregation Method
The Aggregation Method defines how raw data points are summarized before evaluation.
- Sum: Total of all values
- Average: Mean of values
- Minimum: Lowest value observed
- Maximum: Highest value observed
- Count: Total number of observations
- Median: Middle value in the dataset
- Count Unique: Number of distinct values (e.g., distinct users or requests)
For example, using Average on http.server.duration computes mean latency, while Maximum captures peak latency. Using Sum is more appropriate for counter metrics like request counts within a time window. This setting influences the shape and scale of the value being analyzed.
Rollup Window
The Rollup Window determines how metric data is pre-aggregated over time. A 1-minute rollup window, for example, means that metric data will be averaged or summed into 1-minute intervals. This reduces short-term volatility and ensures a consistent basis for comparisons across the evaluation and offset windows. If the metric is generated as an average every 5 minutes, for example, a volatile graph will be generated.
Evaluation Aggregation
The Evaluation Aggregation describes how rolled-up values are summarized during the evaluation window.
- Average: Mean of values across the window
- Minimum: Lowest value seen
- Maximum: Highest value seen
- Sum: Total of all values
- Count: Number of values observed
For instance, if using a 15-minute evaluation window with Average aggregation, the system computes the average of 15 rolled-up values. This smoothed figure becomes the primary input for change detection.
Evaluation Window
The Evaluation Window defines the time period over which the monitor evaluates the metric value. A 15-minute window means the monitor is analyzing the most recent 15 minutes of data to compute the current state. This setting determines how responsive or conservative the monitor will be in detecting change.
Change Type
The Change Type determines whether the monitor detects absolute changes (raw delta) or percentage changes (relative delta) when comparing the evaluation window to the offset window. Use Absolute for signals with consistent scale and Percentage when tracking proportional differences across fluctuating baselines.
Offset
The Offset specifies how far back in time the system should look for the historical baseline. A 1-hour offset means the evaluation window is compared against the same metric value from one hour earlier. This allows the monitor to account for patterns like traffic surges or system shifts.
Alert Threshold
The Alert Threshold is the trigger point for alerting. When the calculated change (either absolute or percentage) exceeds this threshold, an alert is generated. For example, if your historical peak is 90,000 and you expect significant load spikes to exceed 200,000, setting the threshold to 200,000 ensures alerts are meaningful and actionable.
If Data is Missing
The If data is missing for <evaluation window> dropdown controls how the monitor behaves when no data points are available during the evaluation window. This setting determines whether missing data should be treated as a problem or simply ignored. The available options are:
- Evaluate as 0: Treats missing data points as zero values and proceeds with monitor evaluation. This can trigger alerts if your threshold is configured to detect low or zero values.
- Show No Data: Displays “No Data” status for the monitor but does not send notifications. Use this when you want visibility into data gaps without generating alerts.
- Show No Data and Notify: Displays “No Data” status and sends alert notifications. This is useful when missing data itself indicates a problem (e.g., a data pipeline failure).
- Show OK: Treats missing data as if everything is normal and displays an OK status. Use this for metrics that may have legitimate gaps during off-hours or low-activity periods.
Require a Full Window of Data for Evaluation
The Require a full window of data for evaluation checkbox determines whether the monitor should wait for a complete evaluation window before making a decision. When enabled:
- The monitor will not evaluate until it has collected data for the entire evaluation window duration
- This prevents premature alerts during monitor startup or after data gaps
- Useful when you need high confidence that the evaluation is based on a complete dataset
When disabled, the monitor will evaluate based on whatever data is available, even if partial. This provides faster detection but may be less reliable during the initial evaluation period.
Example Configuration
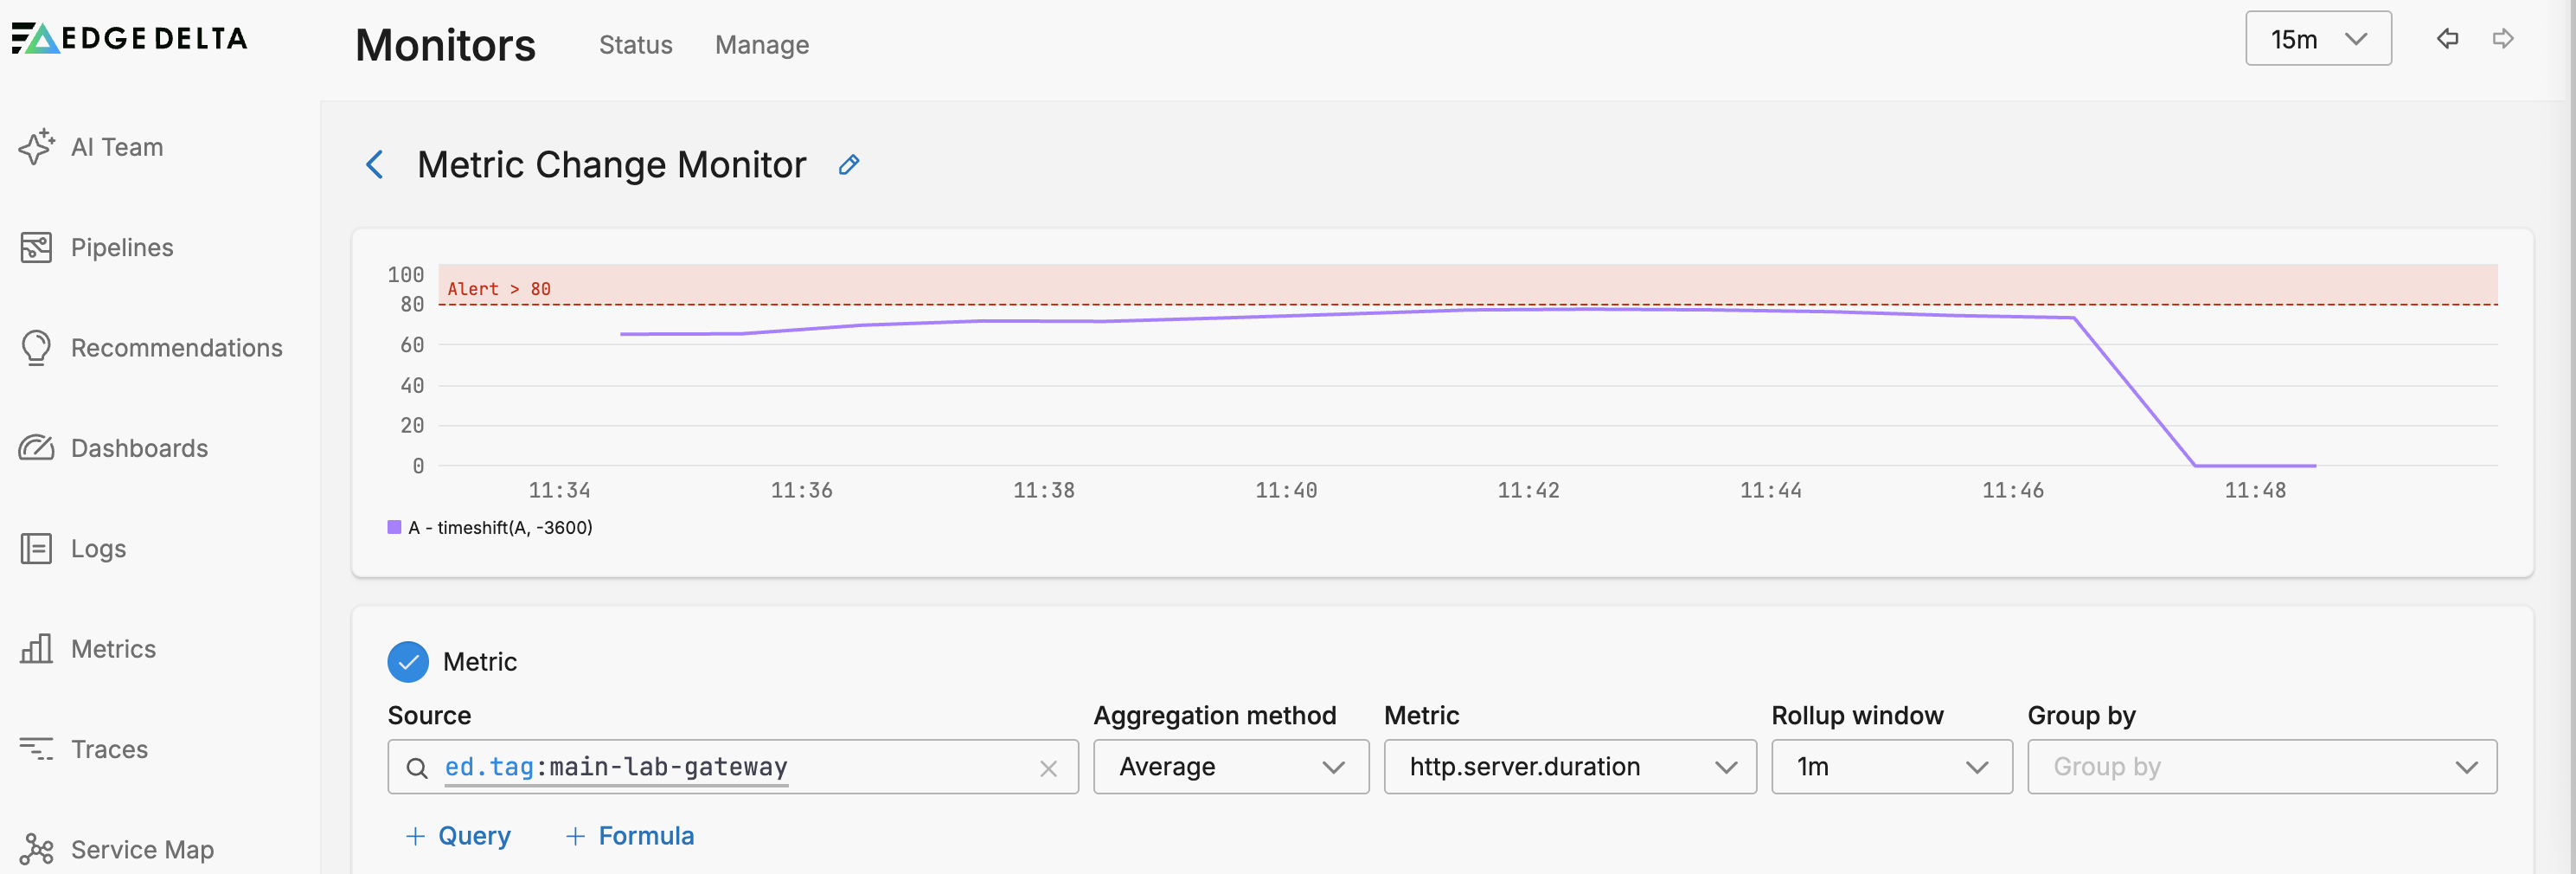
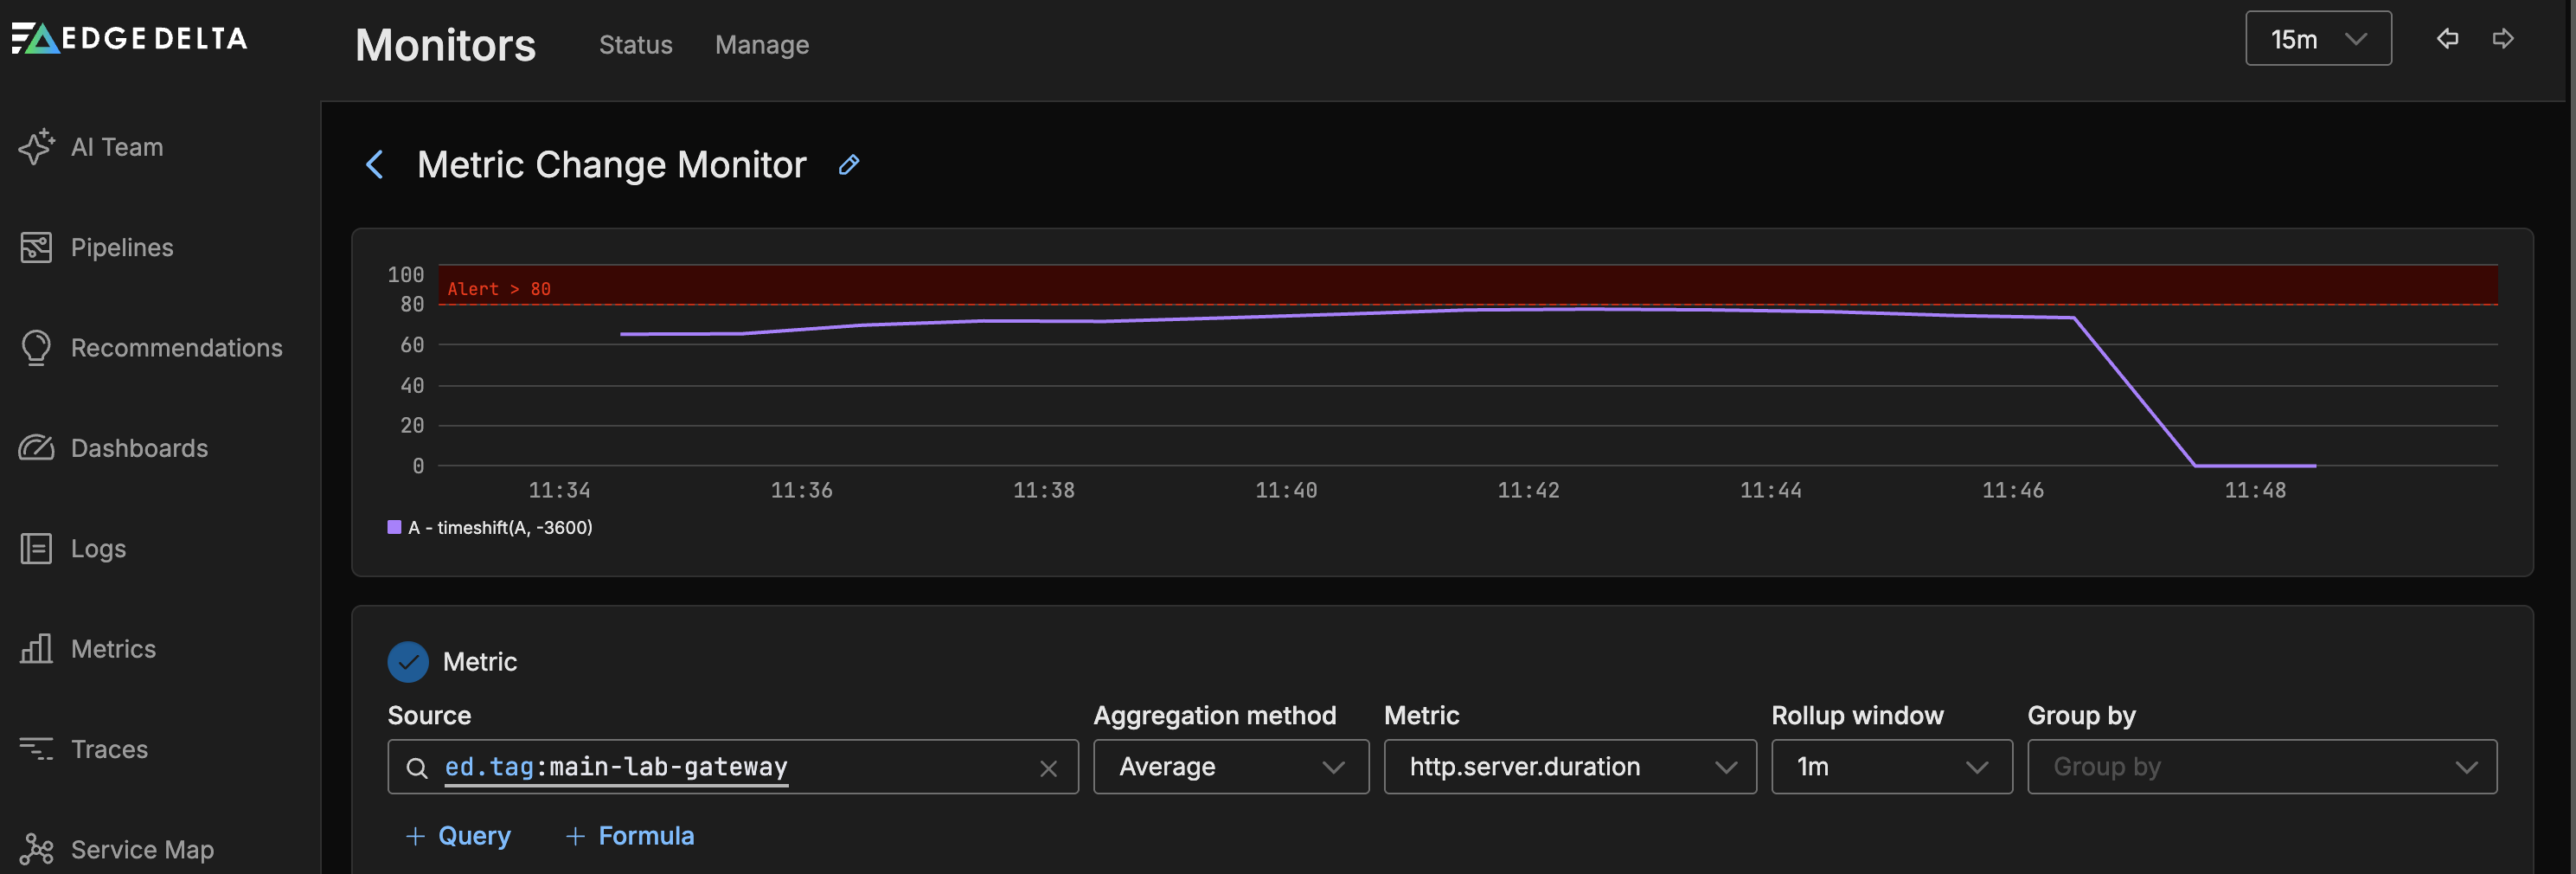
In this example, the monitor is configured to track the http.server.duration metric emitted from a service tagged with main-lab-gateway. The metric is aggregated using the average method to capture mean latency over time. These values are smoothed using a rollup window of 1 minute, which averages the raw data into consistent intervals.
For evaluation, the monitor calculates the average value across a 15-minute evaluation window, and compares it to the value from a 1-hour offset (i.e., the same 15-minute window but from one hour ago). The change type is set to absolute, meaning the monitor looks at the raw difference rather than a percent change.
An alert is triggered if the evaluated value exceeds an absolute threshold of 200,000 during the evaluation period. This threshold was chosen based on a known natural peak of around 90,000, ensuring that only significant deviations cause an alert.
How Rate-of-Change Is Calculated
The monitor uses a timeshift-based comparison between the current evaluation window and the same window offset back in time. In this case:
- Evaluation window: 15 minutes (current)
- Offset: 1 hour ago
- Rollup: Metric data is averaged per 1-minute intervals
For percentage-based monitors, the formula would be:
((A) / timeshift(A, -3600) - 1) * 100
This calculates the percent increase of the current value A relative to the value of A 1 hour ago.
For absolute change monitors like this one, the delta is calculated as:
A - timeshift(A, -3600)
The
timeshiftline on the graph shows the metric’s value one hour ago (in this case, around90.4K). The monitor compares this to the current average over the last 15 minutes.
Trigger Threshold
The alert fires if the current evaluated value exceeds 200,000. Since the observed historical peak was around 90,000, this threshold ensures:
- Normal variation does not trigger an alert
- Larger surges do trigger an alert
Learn how to Develop Metrics Maturity with Edge Delta and how to Implement Metric-Based Monitoring Effectively.
Visualizing the Change
The performance graph displays:
- Blue line: Current value of
http.server.duration - Purple dotted line:
timeshiftbaseline (1 hour ago) - Red band/line: Threshold (set to
200,000)
This setup provides a clear visual and logical comparison of present vs. past behavior, helping identify rapid changes over time.
Notification
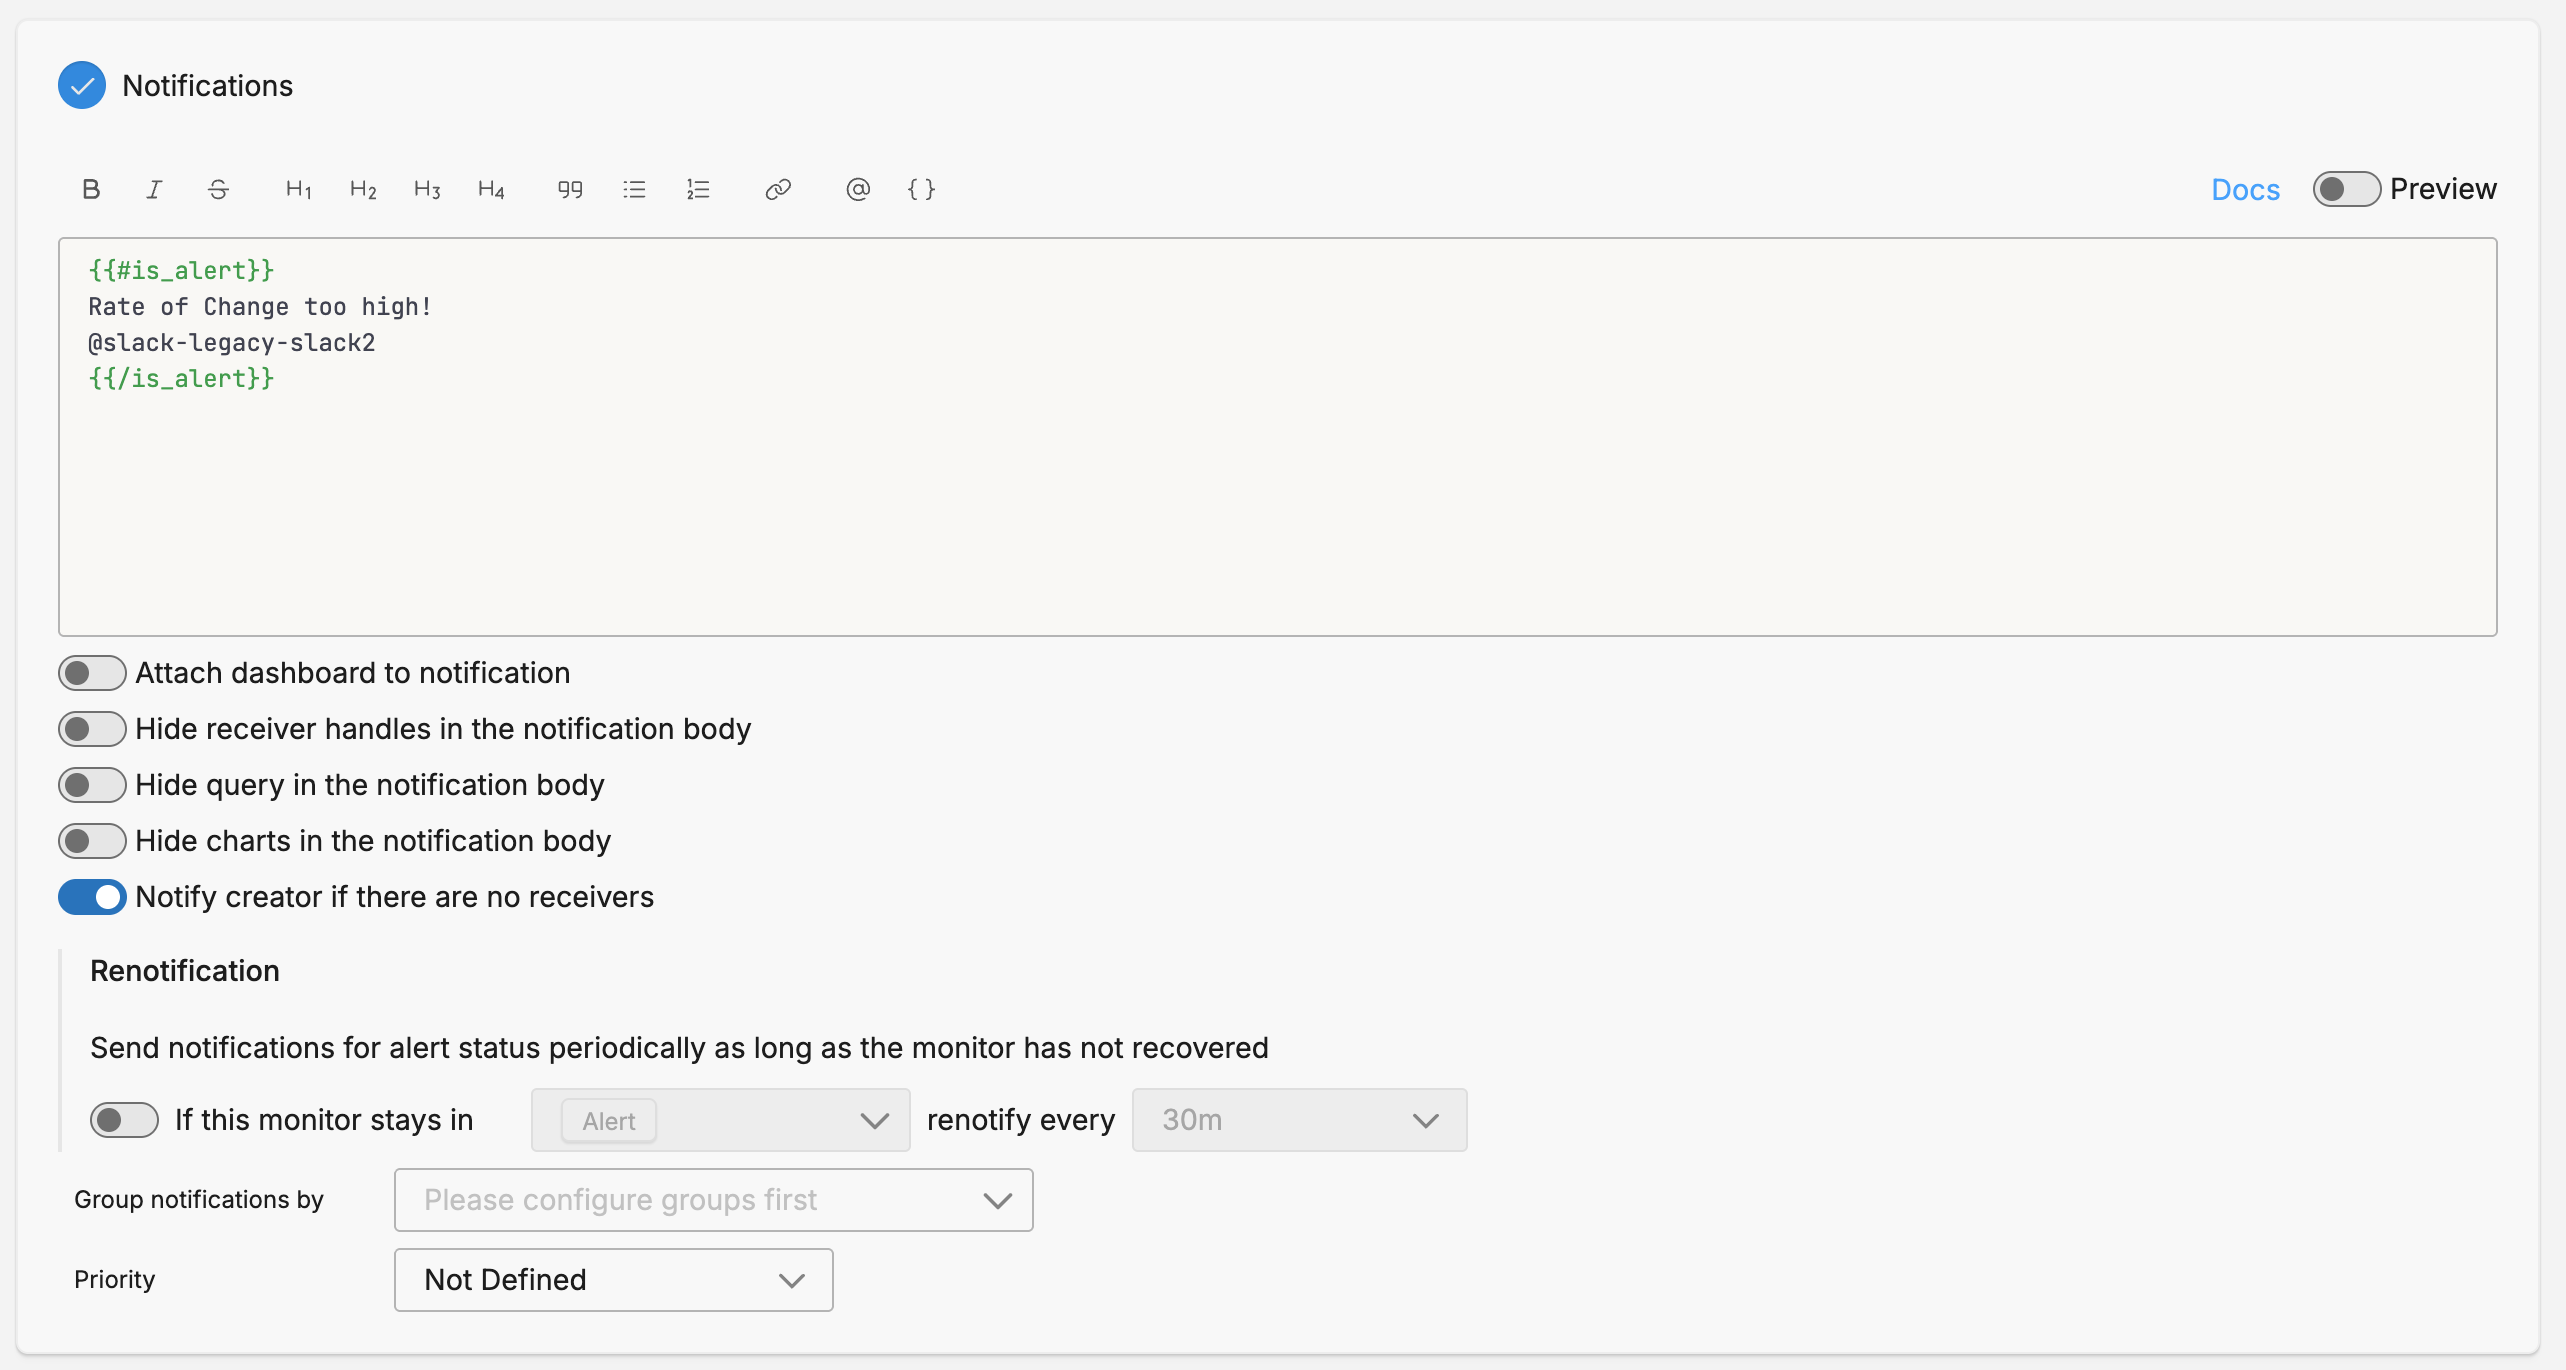
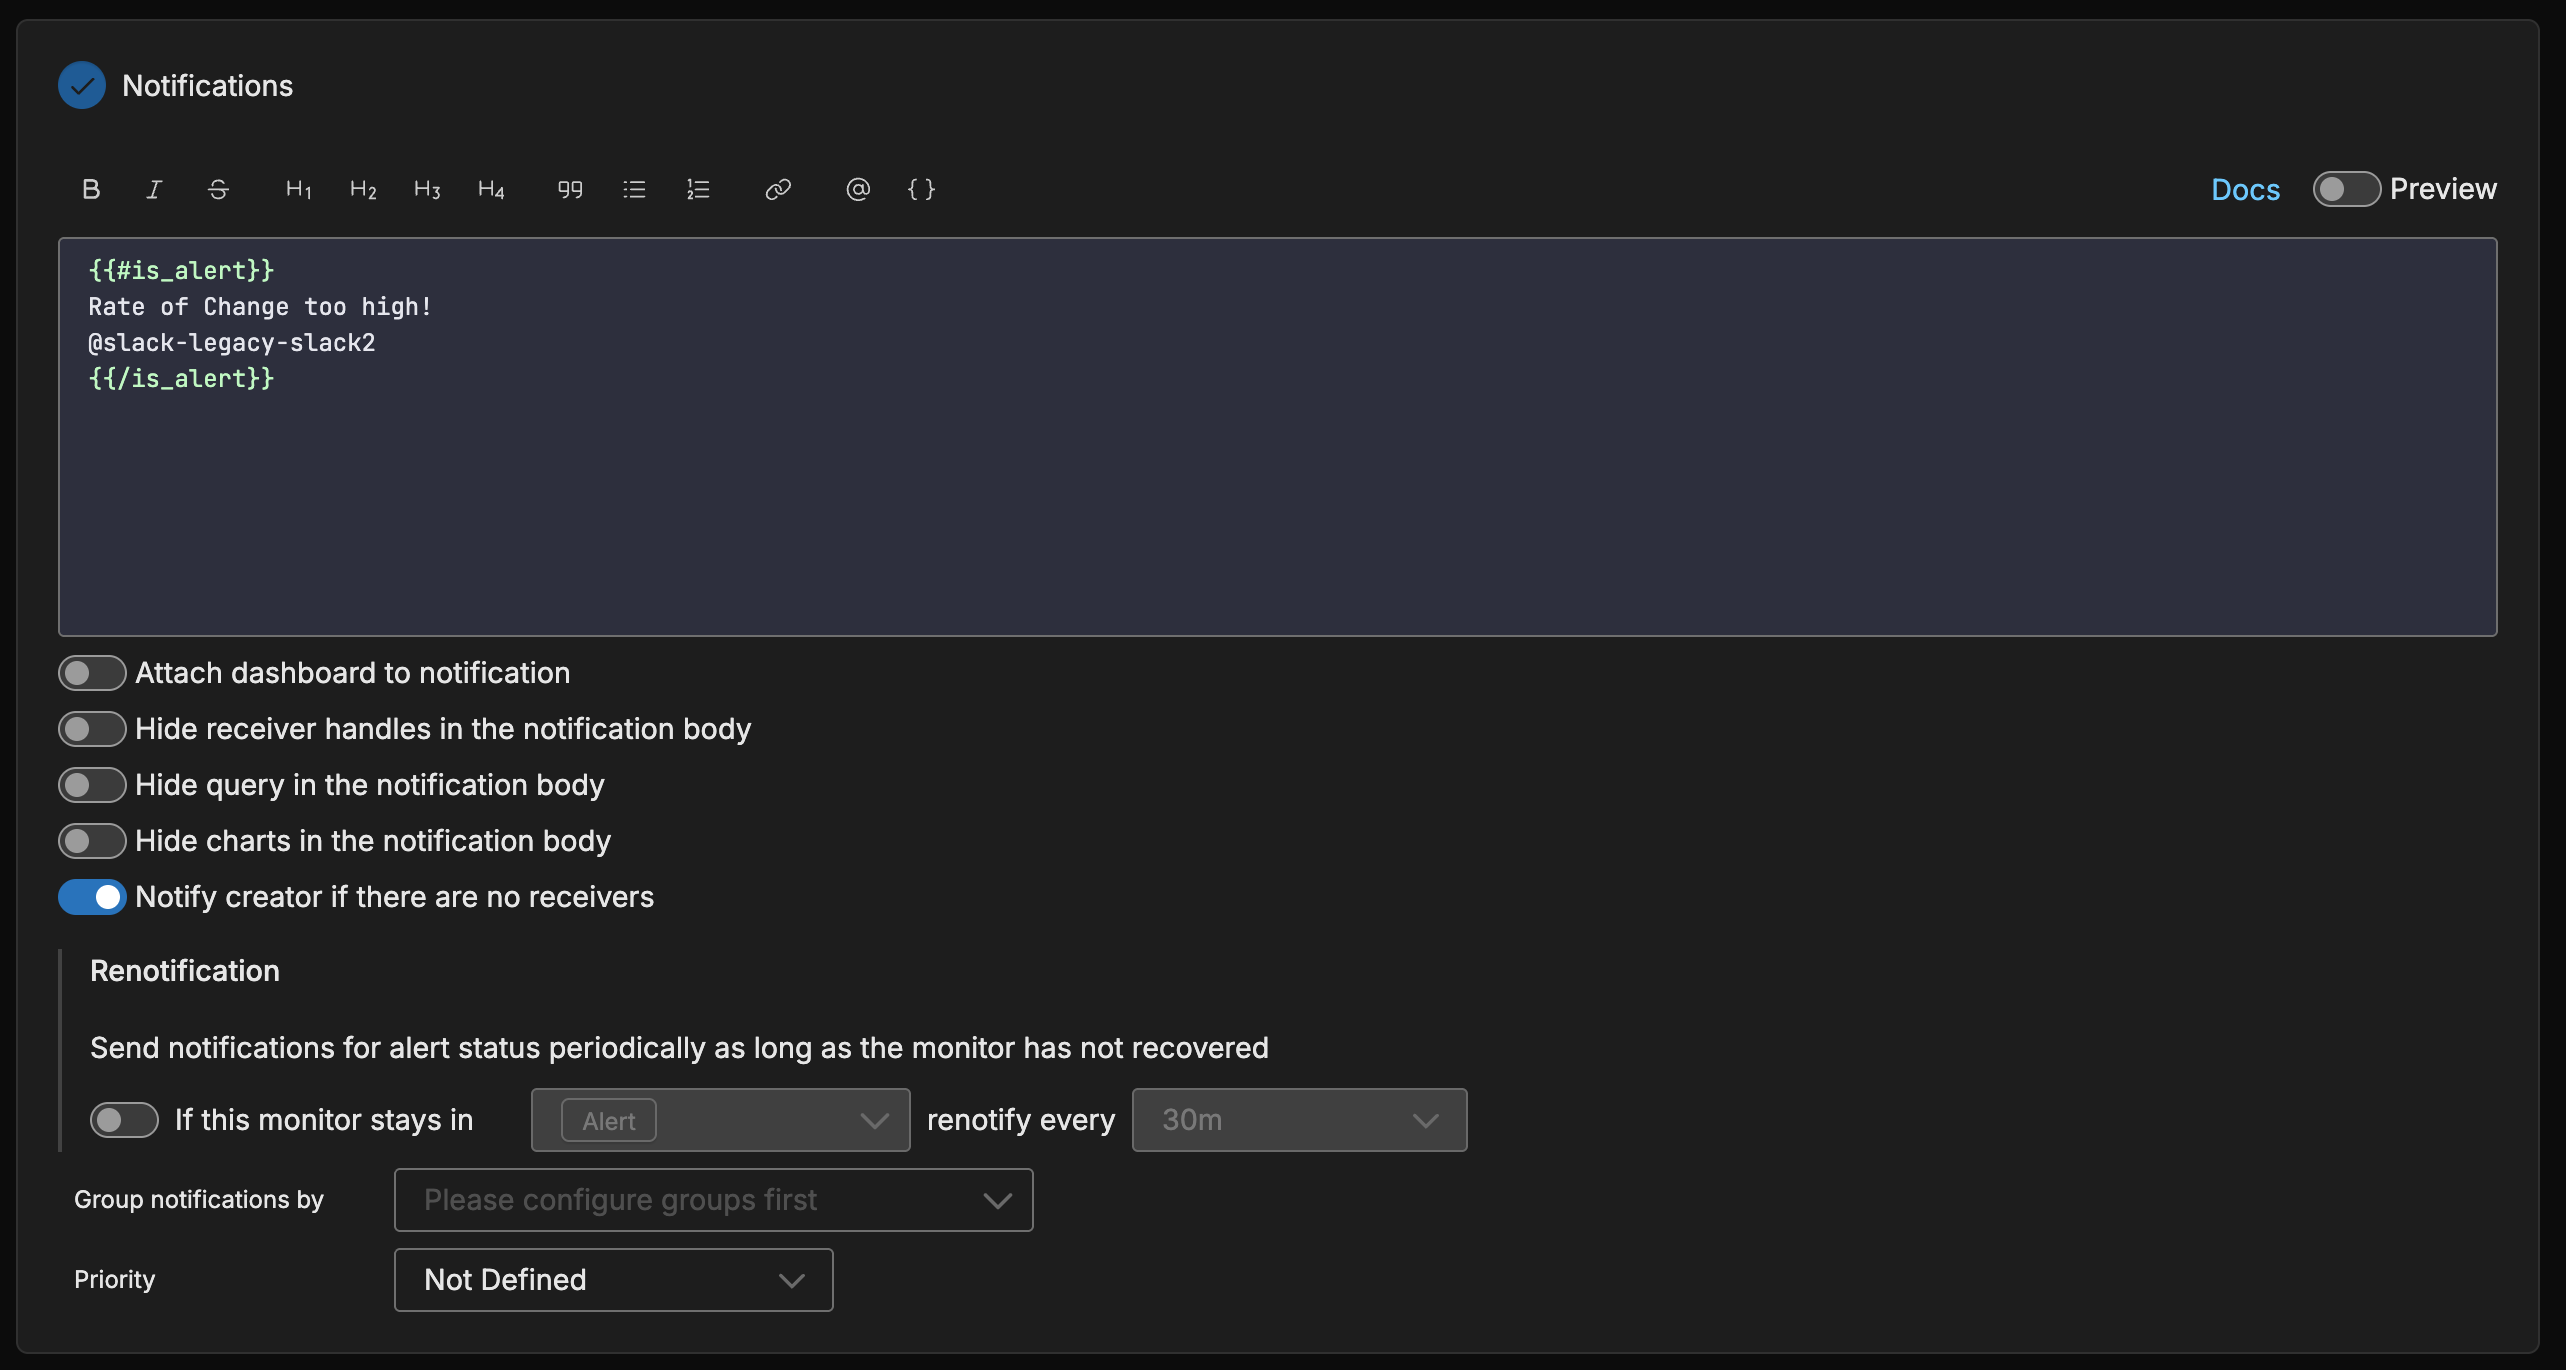
Group Notifications By
To use source fields in the notification you must specify them in the Group By field in the Monitor Scope section and in the Group notifications by field in the Notifications section. This allows you to send separate notifications for each group combination, such as per-service or per-namespace alerts.