Metric Threshold Monitor
5 minute read
Create a Metric Threshold Monitor
To create a metric threshold monitor:
- Click Monitors and select the Triggered tab.
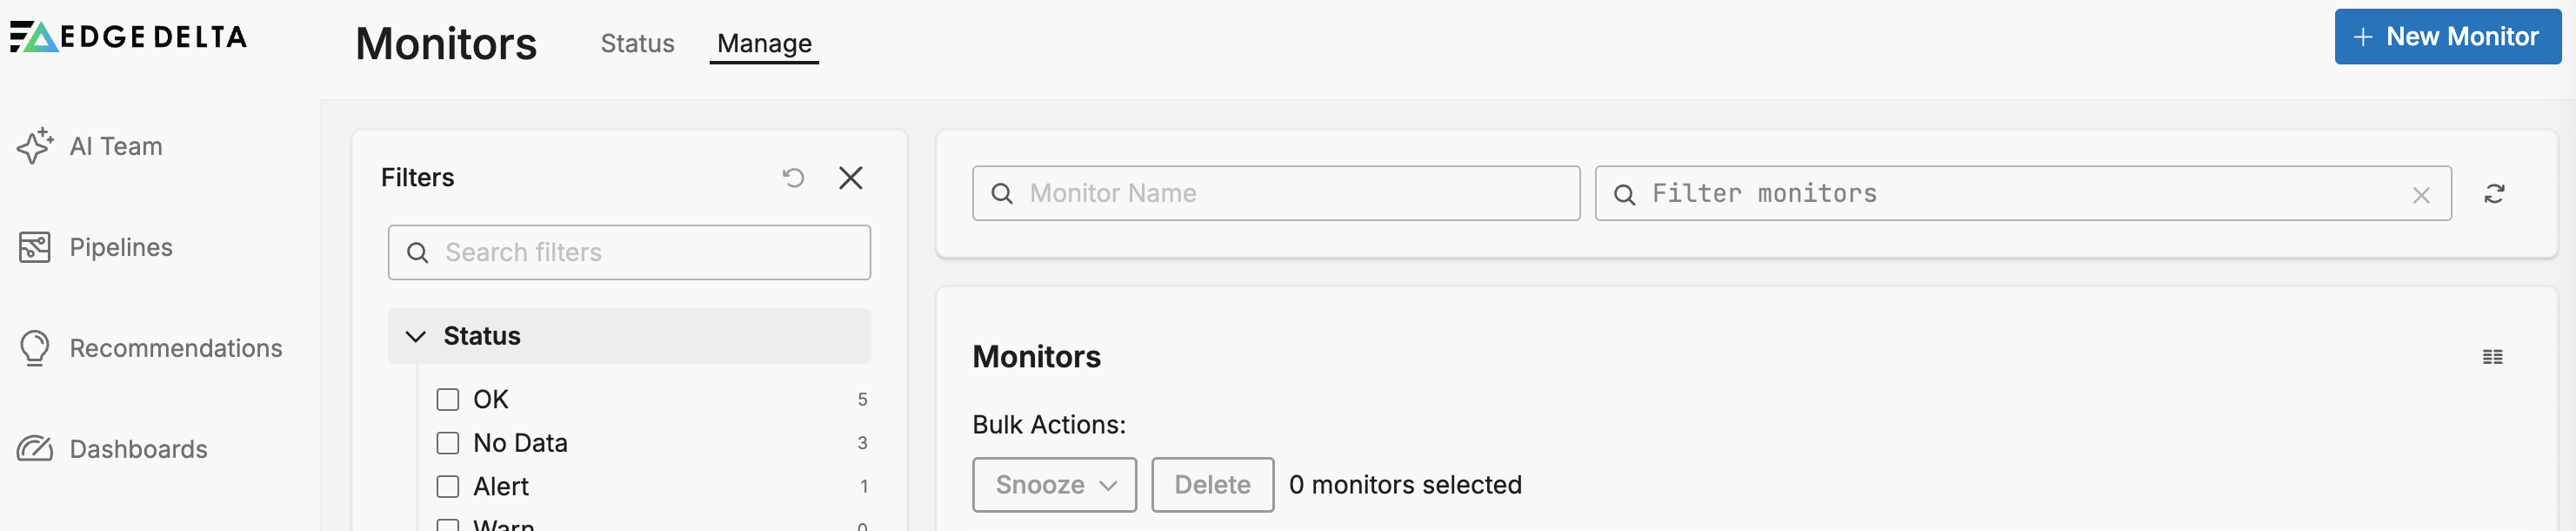
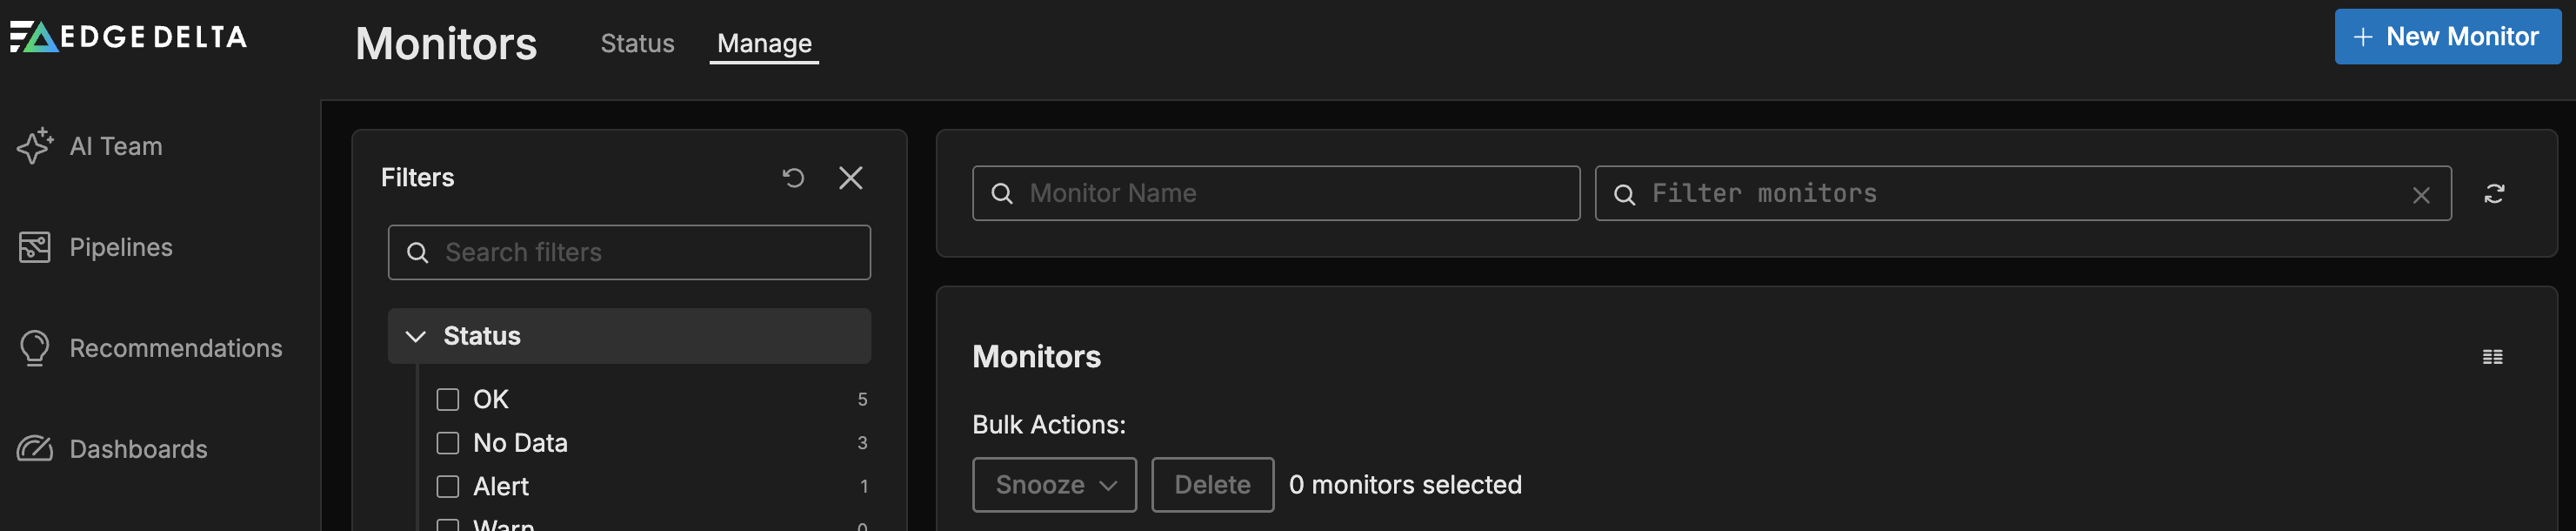
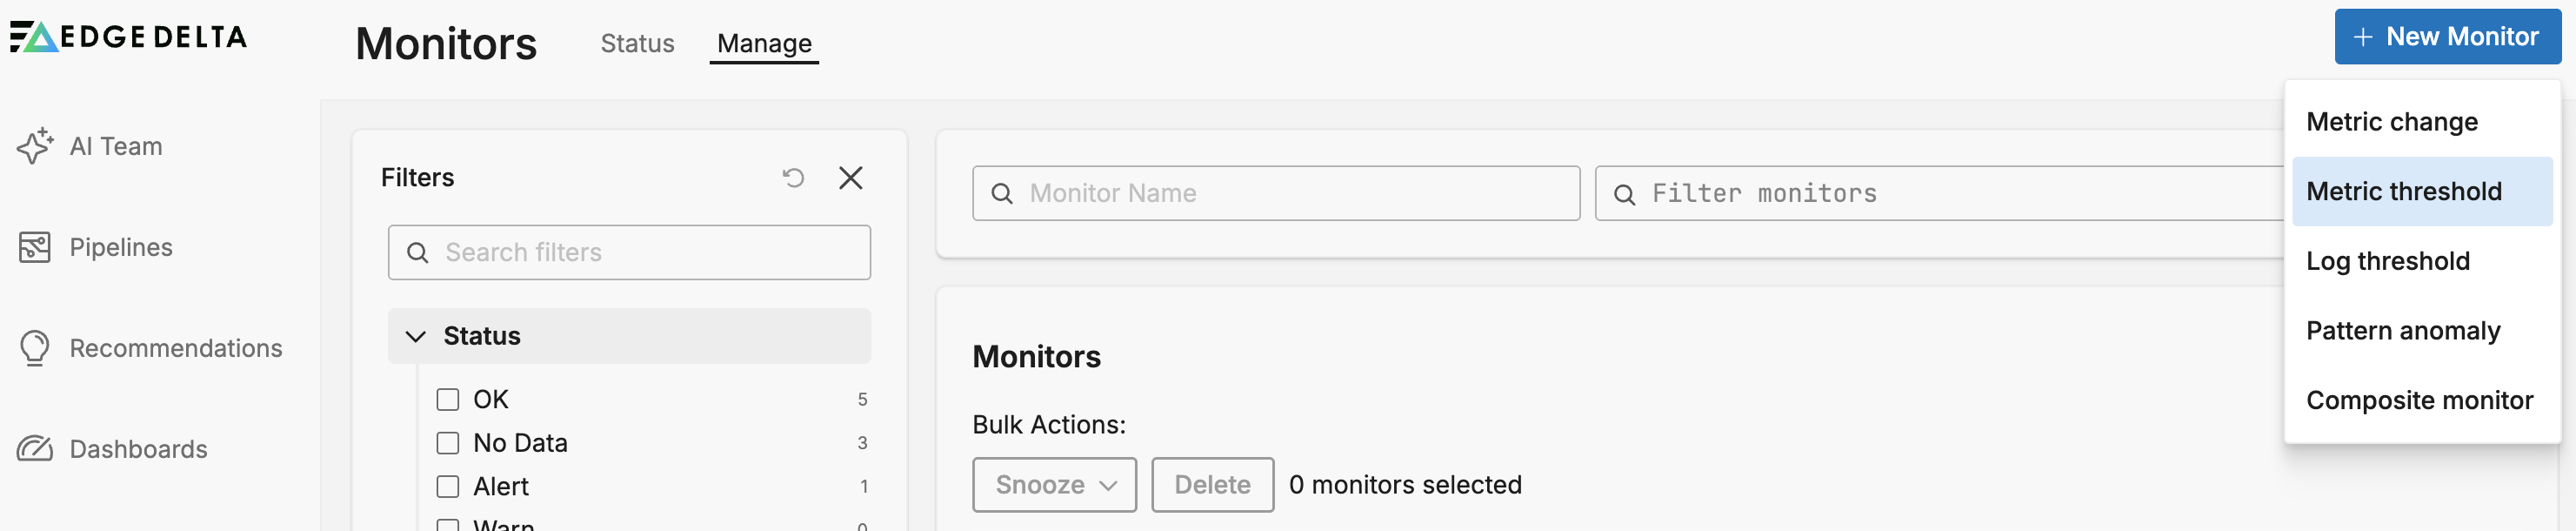
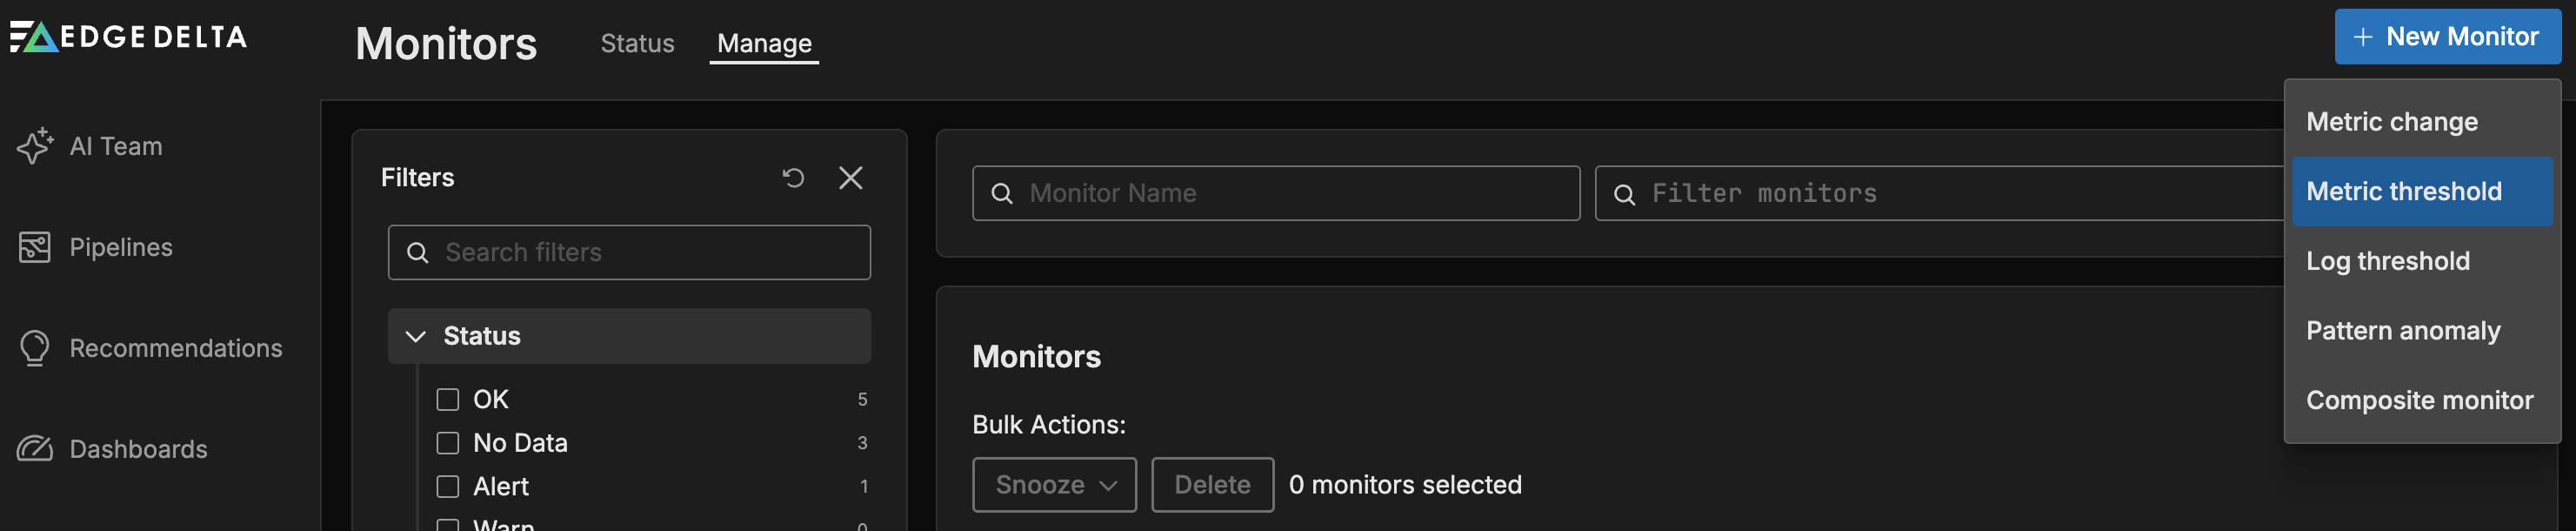
- Click + New Monitor and select Metric Threshold.
Configure Metric Monitor
The metric monitor can evaluate metric conditions across all pipelines. In this example, the Metric, Grouping and Alert Conditions have been populated.

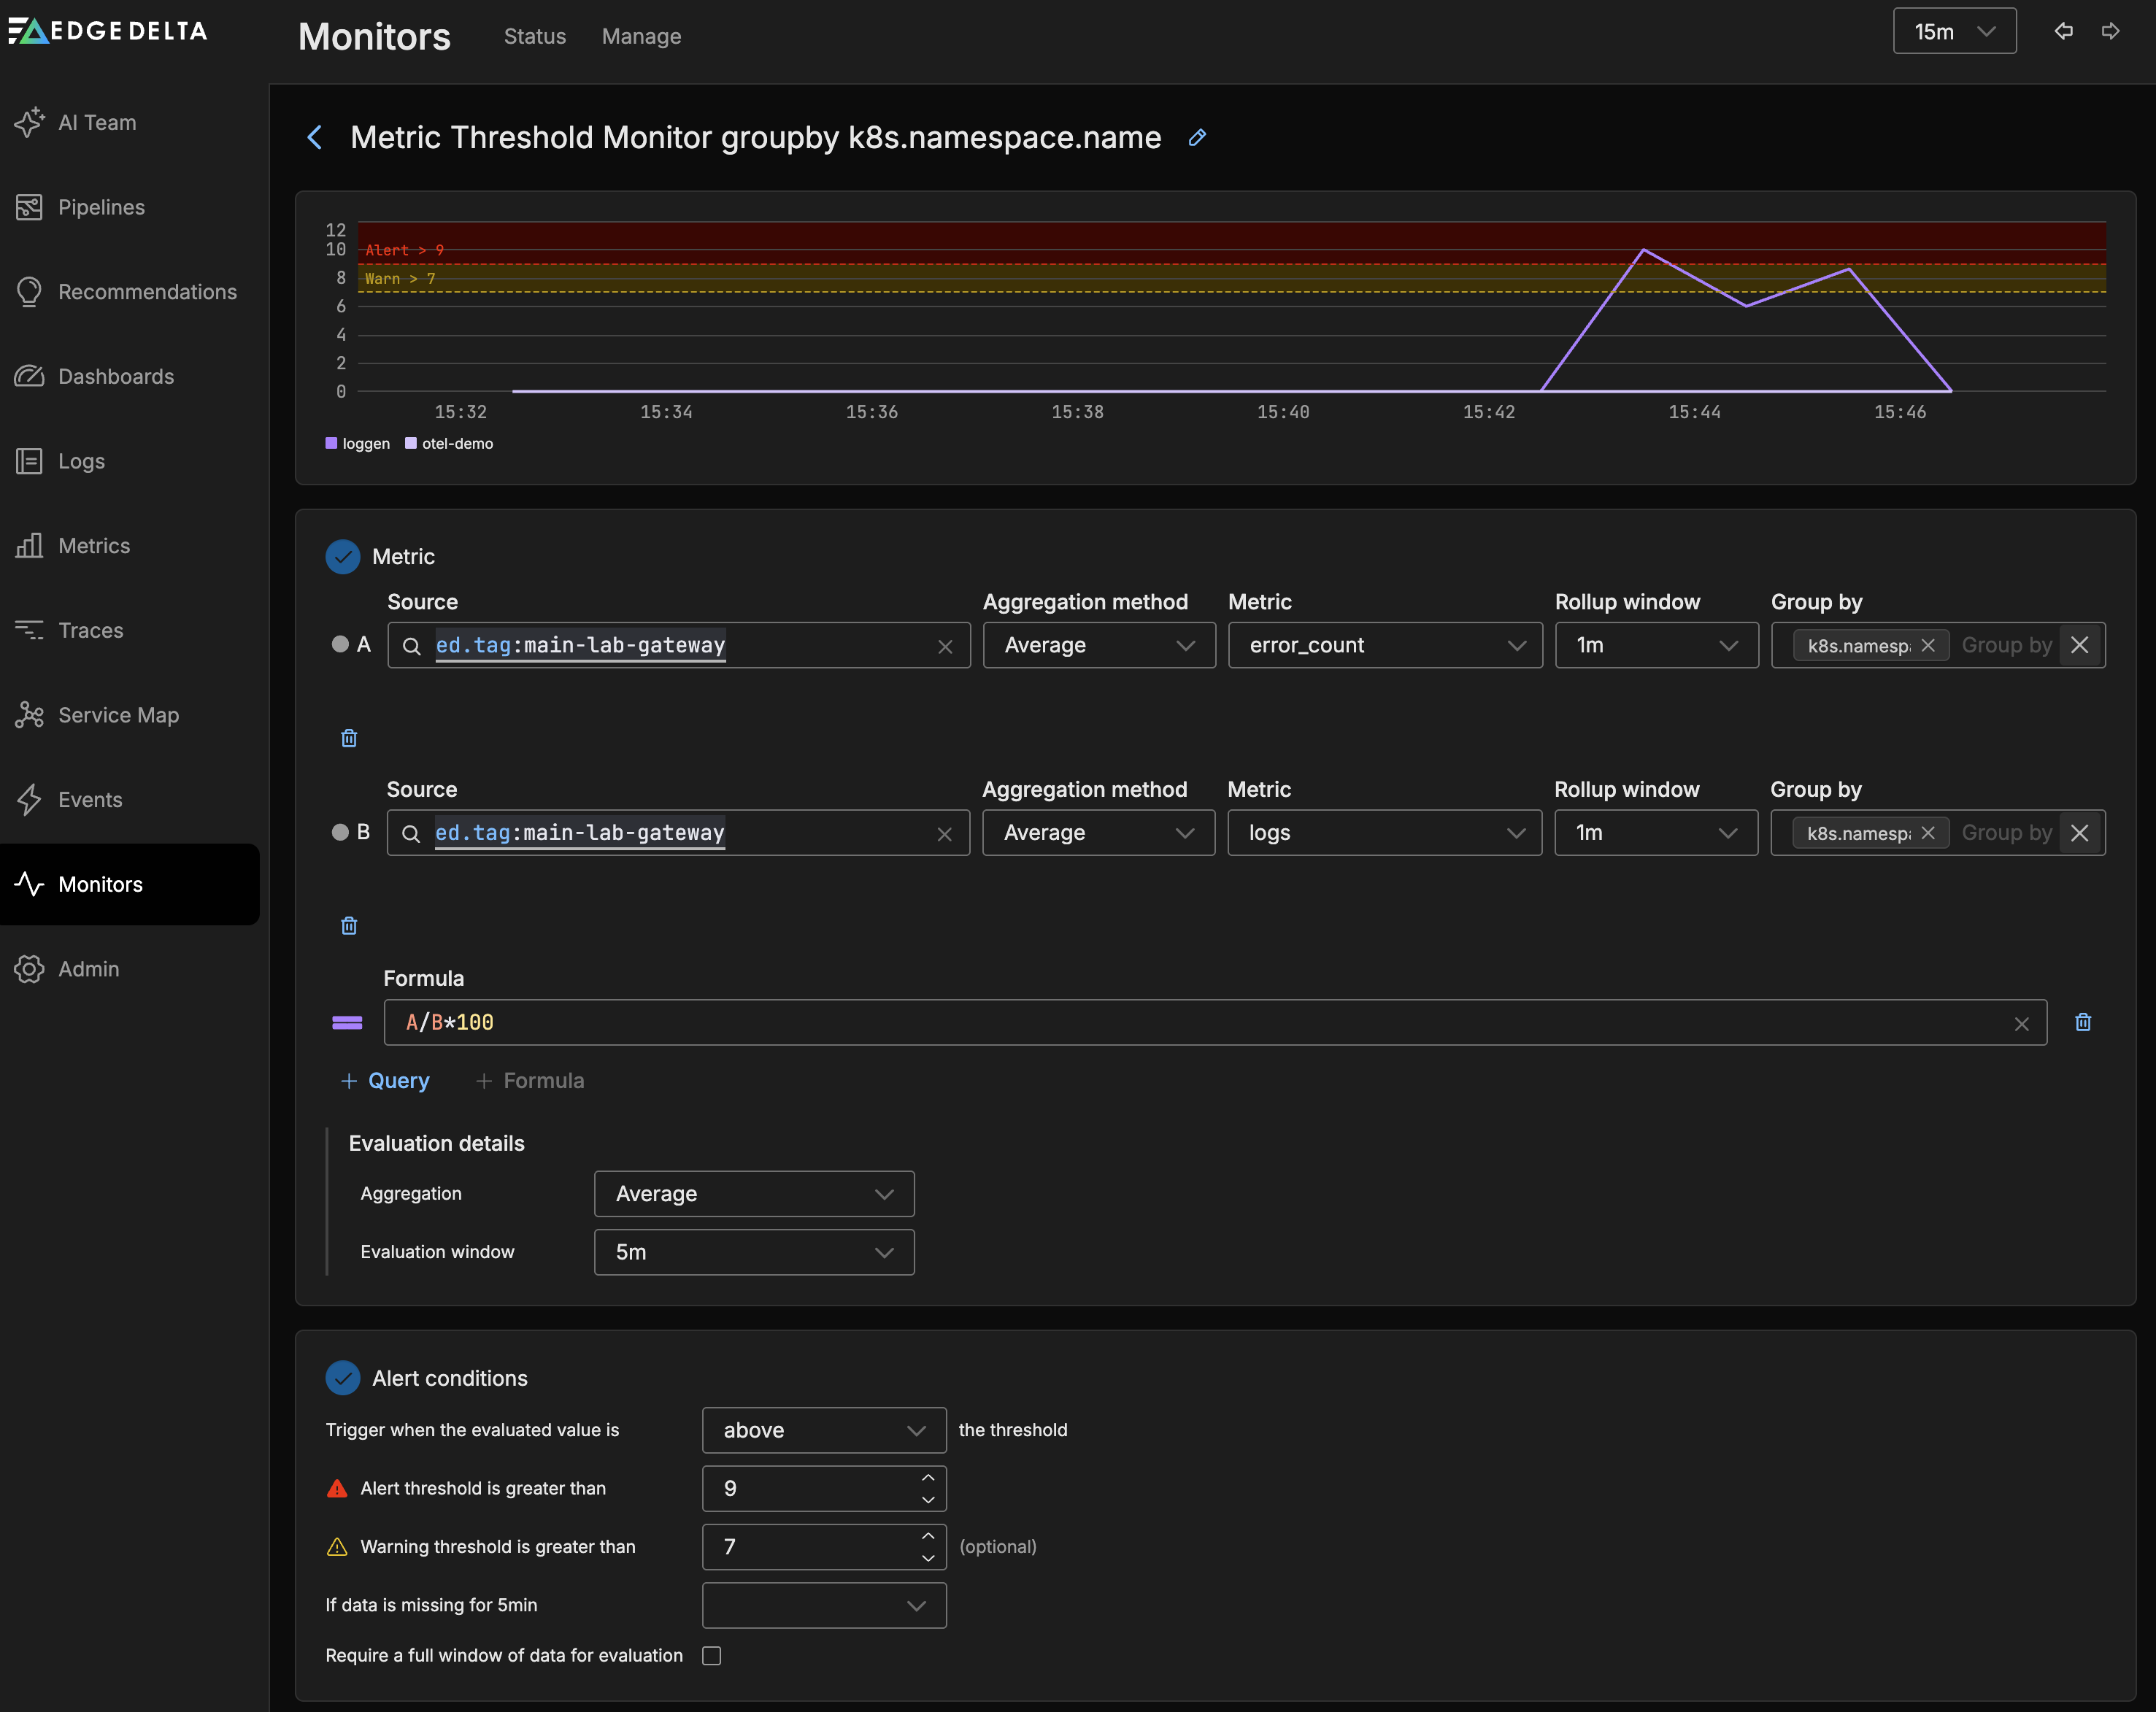
Metric
You select a metric and an aggregation to populate the graph. This enables you to see a the historical data for the metric and establish reasonable alert and warning alert conditions.
Aggregation: Choose between Sum, Average, Minimum, Maximum, Count and Median. This defines the logic used to create the aggregated value for each Rollup window. Use Aggregation and Rollup Window to shape the base time series. Then use the Evaluation Details options (Aggregation and Evaluation WIndow) to get a scalar threshold from the shaped base time series. See the example that follows.
Metric: Select a metric to monitor.
Source: Use autocomplete to select the sources you want to monitor. For example you can specify a number of agent tags. If you leave this blank all sources will be monitored.
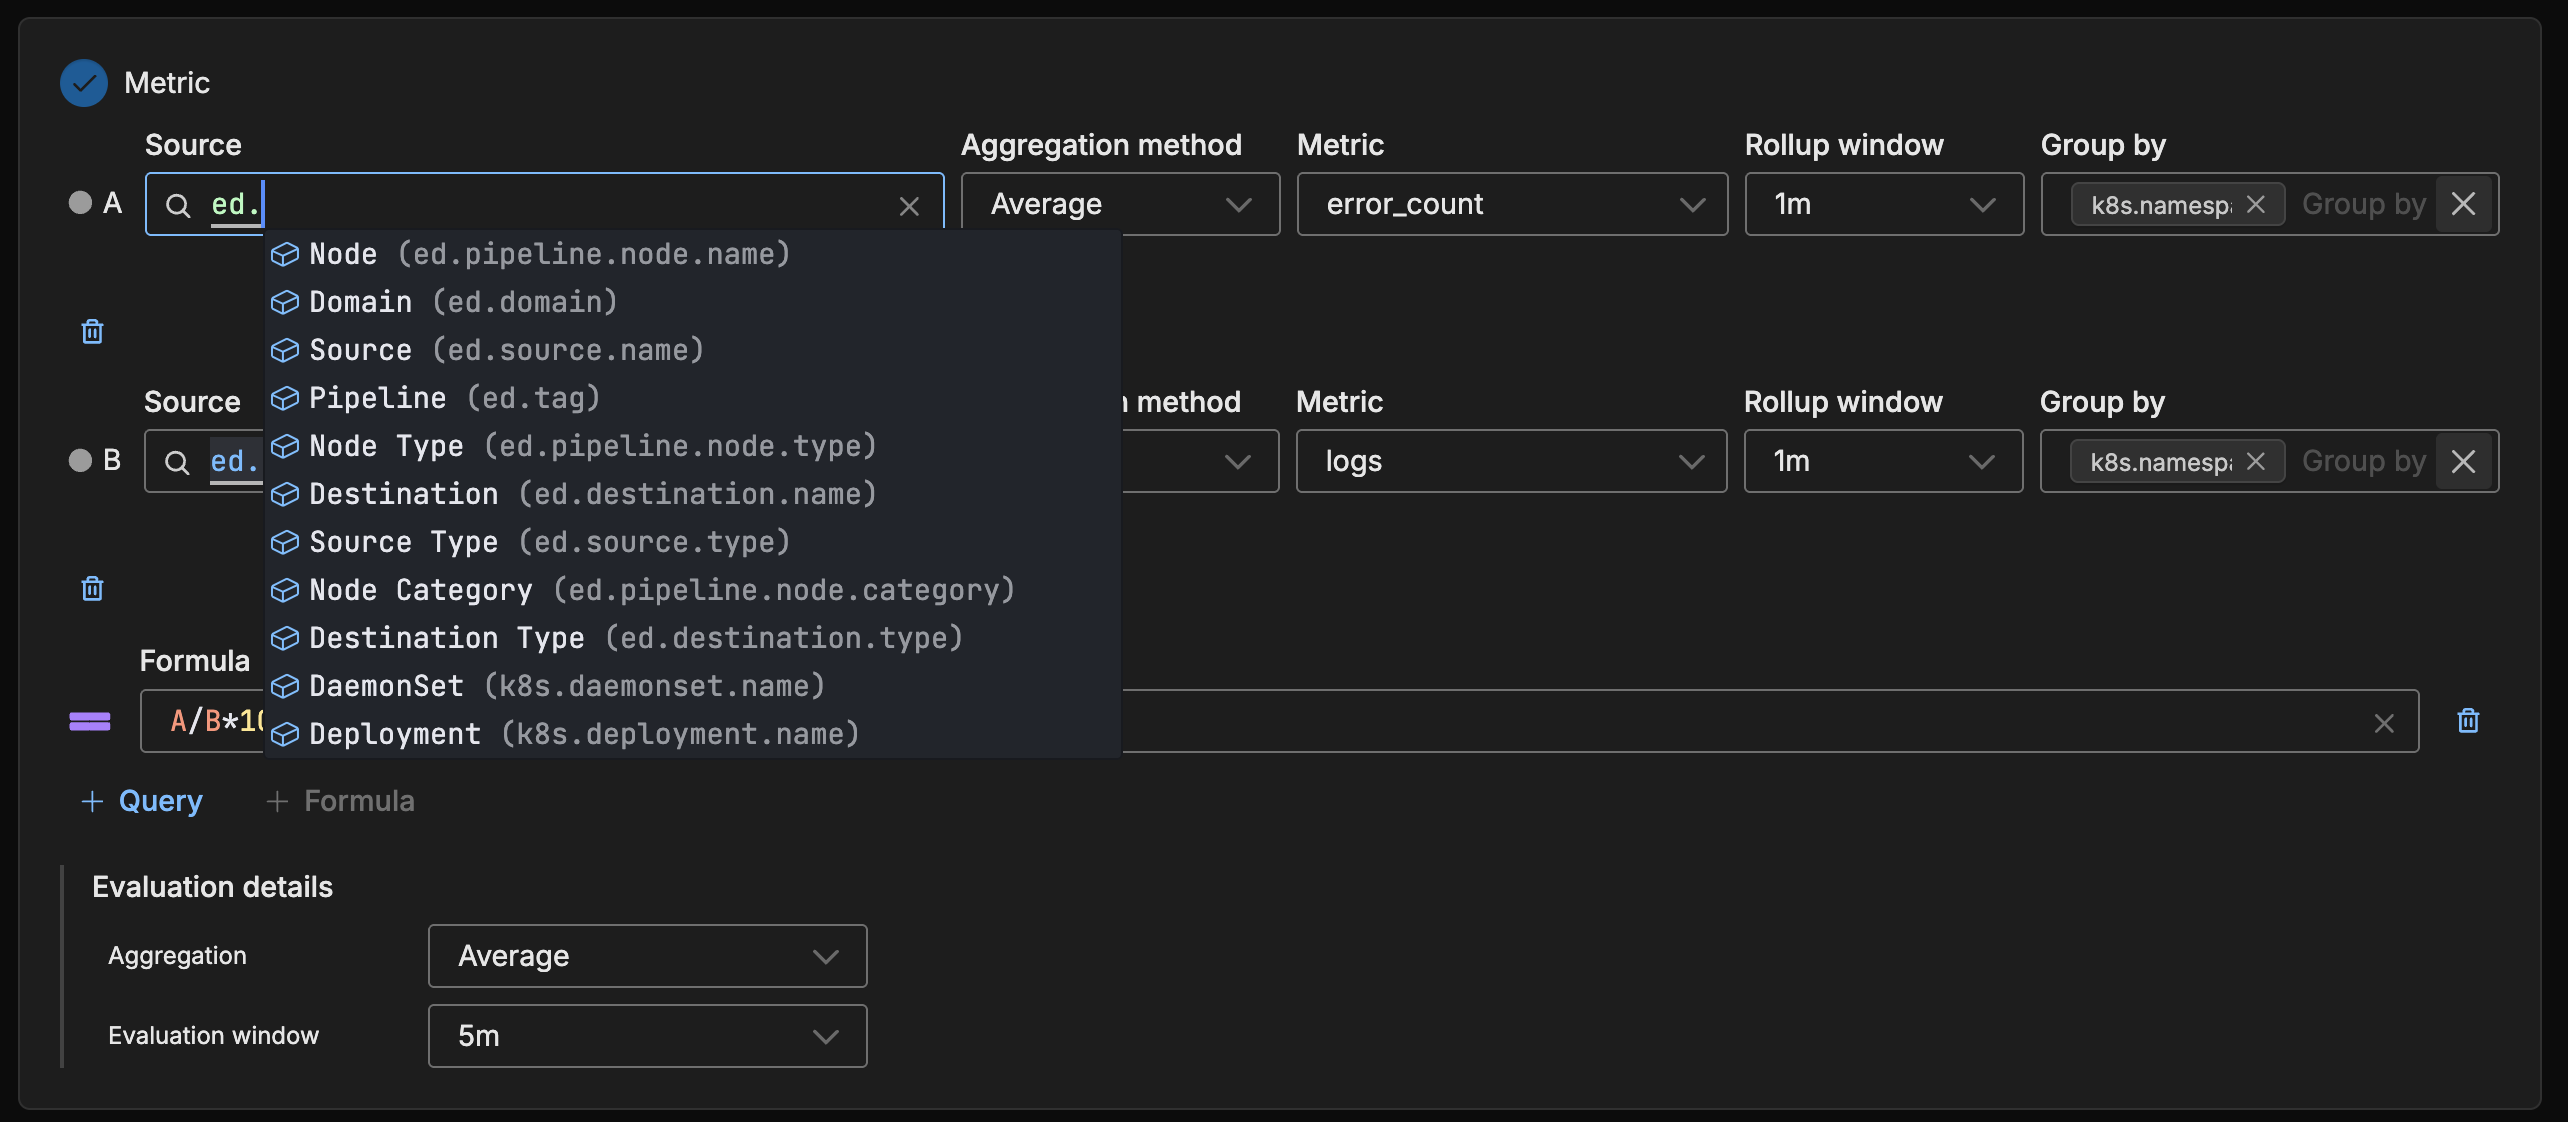
- Group by: You can group the monitored item by dimensions such as the agent tag, host, namespace etc. This option is required if you want to split notifications by group. See Monitor Limits for group-by limits.

- Rollup Window: Define the duration with which to shape the base time series, along with the preceding base time series aggregation. Then use the Evaluation Details options (Aggregation and Evaluation WIndow) to get a scalar threshold from the shaped base time series. See the example that follows.
Evaluation Details
The Evaluation Details options evaluate the shaped base time series (as shaped by the preceding aggregation and rollup window options) to determine a value against which to check for thresholds.
- Evaluation Details - Aggregation: The function applied to the shaped time series to determine a value for evaluation against the thresholds.
- Evaluation Details - Evaluation Window: The duration at which to apply the Evaluation Details - Aggregation function. It will take this long before any potential alerts or warnings are issued as the entire duration window needs to be evaluated.
Example:
- Aggregation: Minimum
- Rollup Window: 5m
- Evaluation Details - Aggregation: Sum
- Evaluation Details - Evaluation Window: 15m
The first two options in this configuration determine the minimum of the metric for each 5 minutes. In other words, every 5 minutes a data point is created.
The second two options in this configuration determine the sum of the data points every 15 minutes (three data points) to create a metric. This metric will be evaluated against the thresholds you will set.
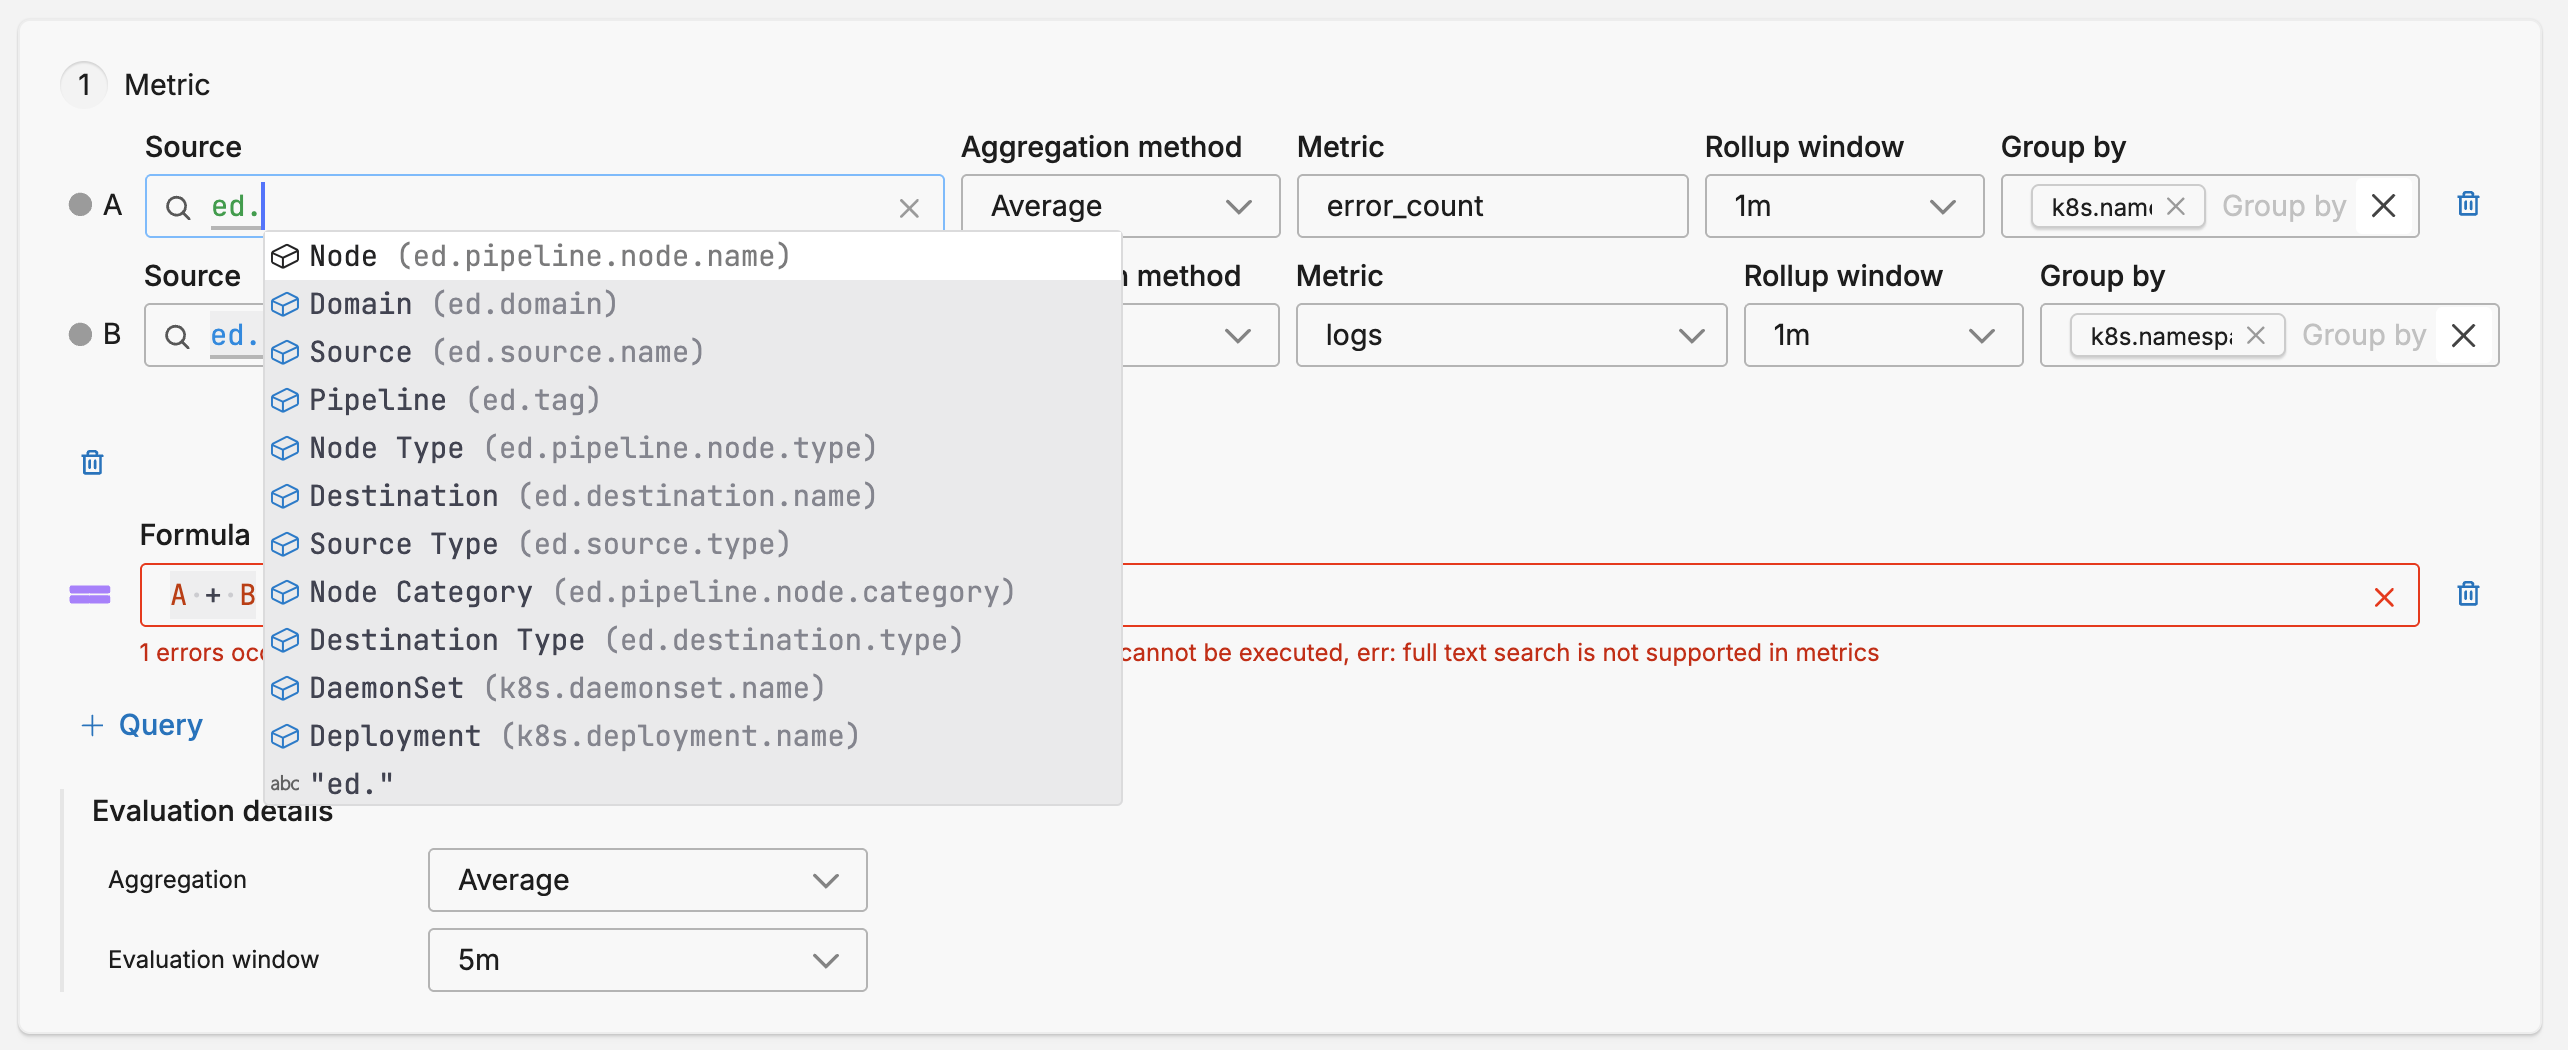
Multiple Queries and Formula
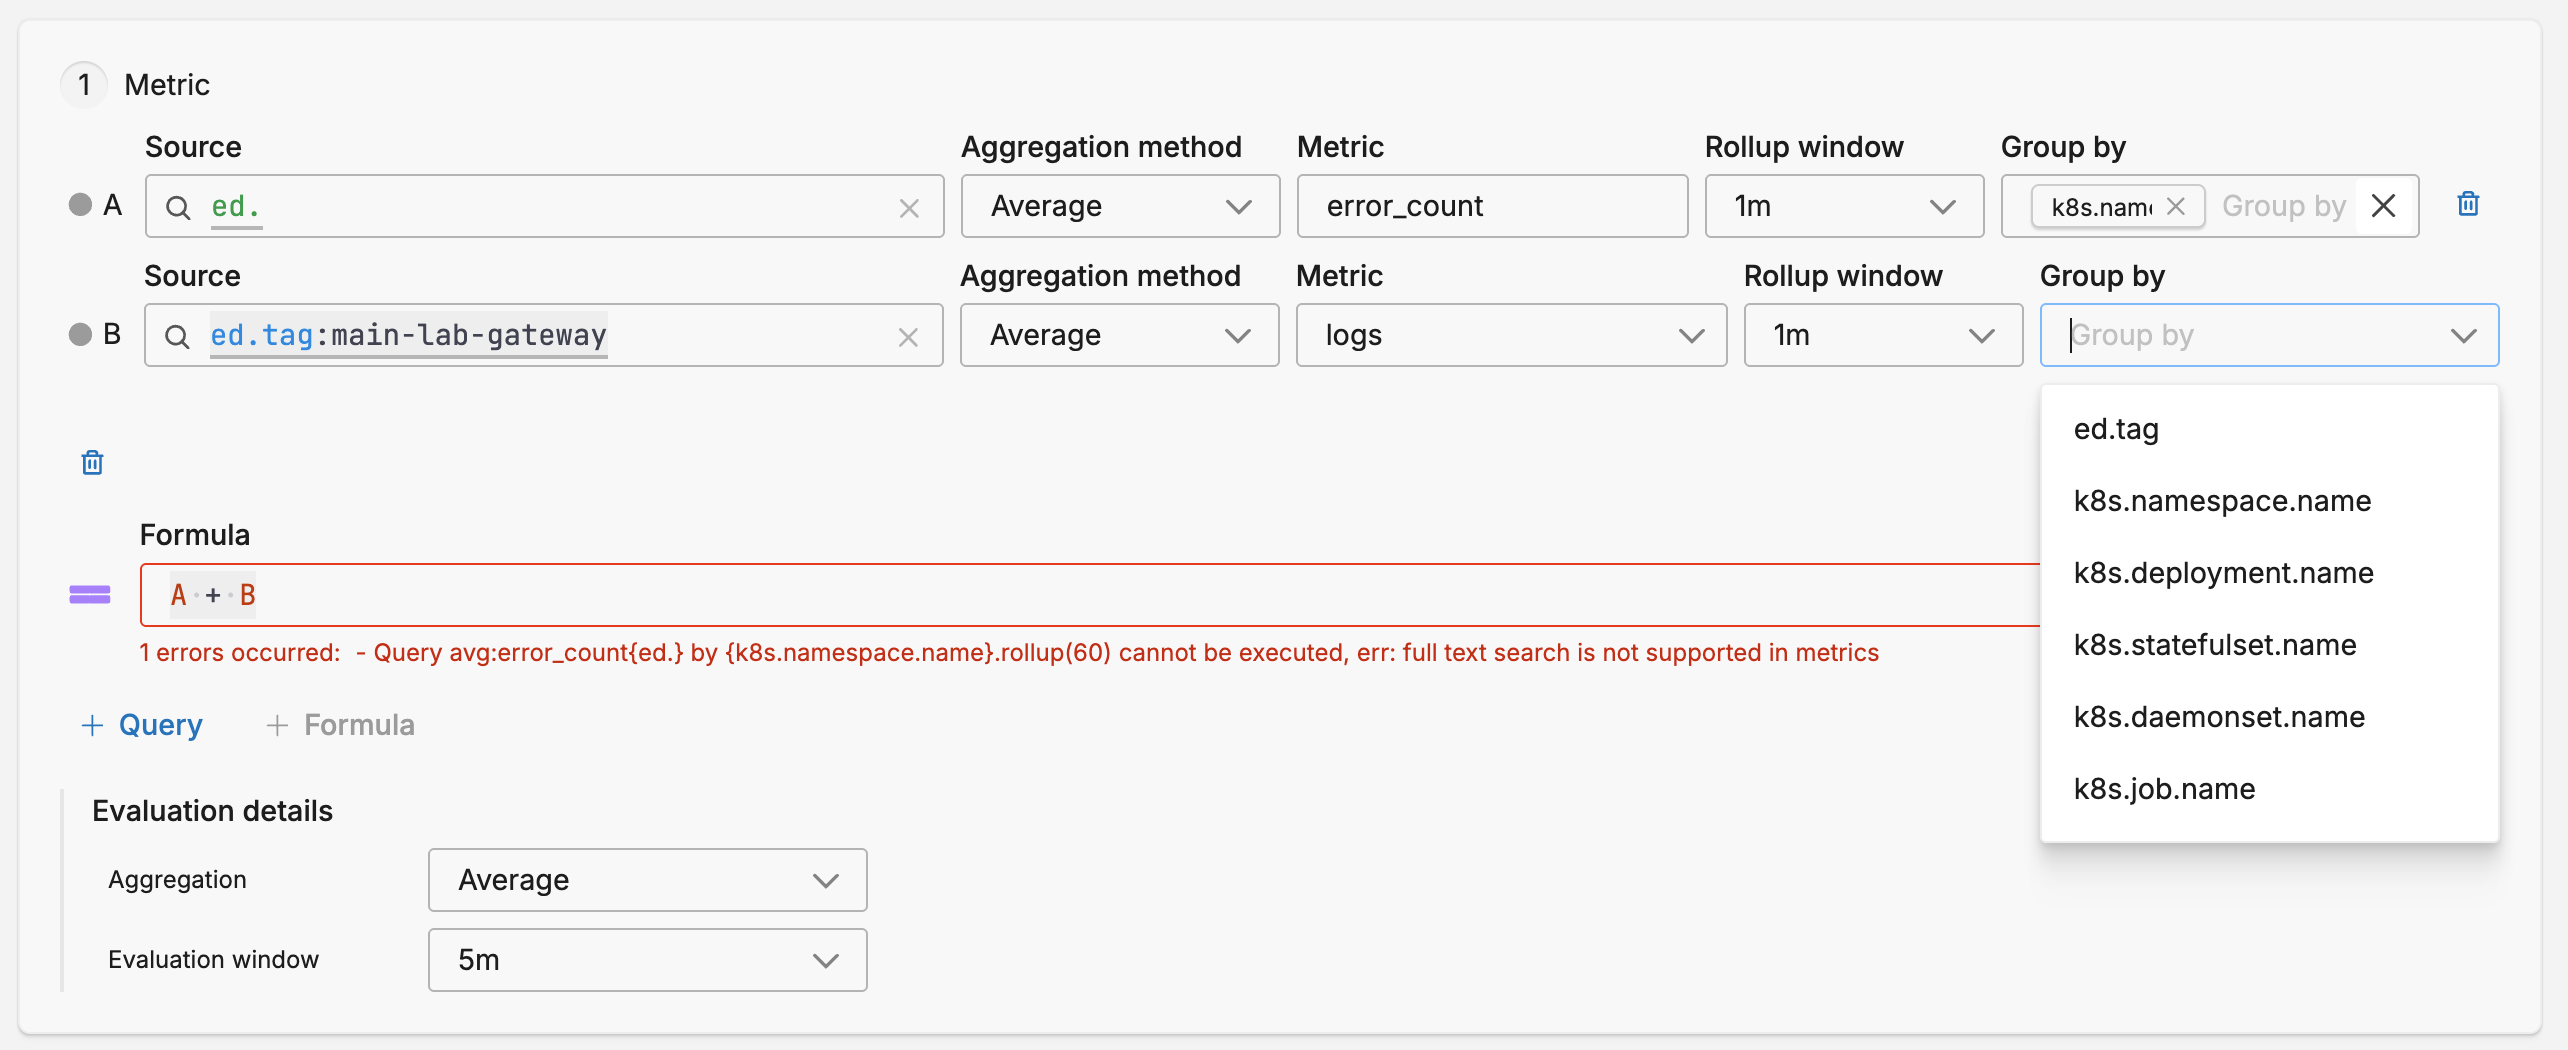
Click + Query to add a query and formula to the monitor. This enables you to evaluate two queries simultaneously for the same lookback period. You can configure additional queries similarly to the first - selecting the source, aggregation method, metric, rollup window and a group.
With multiple queries specified, you can configure mathematical functions executed against the queries. The queries are labelled alphabetically and you can use these labels in the formula. For example, you may wish to see the percentage of metrics in query A against the metrics in query B.
Alert Conditions
Configure the thresholds that the monitored item should be evaluated against in this section. You can select a warning and an alert thresholds. If you are configuring a metric monitor, as you add the thresholds they are displayed in the graph relative to the current metric’s values. You can choose to trigger when the evaluated value is Above, Above or equal to, Below or Below or equal to the thresholds.
If Data is Missing
The If data is missing for <evaluation window> dropdown controls how the monitor behaves when no data points are available during the evaluation window. This setting determines whether missing data should be treated as a problem or simply ignored. The available options are:
- Evaluate as 0: Treats missing data points as zero values and proceeds with monitor evaluation. This can trigger alerts if your threshold is configured to detect low or zero values.
- Show No Data: Displays “No Data” status for the monitor but does not send notifications. Use this when you want visibility into data gaps without generating alerts.
- Show No Data and Notify: Displays “No Data” status and sends alert notifications. This is useful when missing data itself indicates a problem (e.g., a data pipeline failure).
- Show OK: Treats missing data as if everything is normal and displays an OK status. Use this for metrics that may have legitimate gaps during off-hours or low-activity periods.
Require a Full Window of Data for Evaluation
The Require a full window of data for evaluation checkbox determines whether the monitor should wait for a complete evaluation window before making a decision. When enabled:
- The monitor will not evaluate until it has collected data for the entire evaluation window duration
- This prevents premature alerts during monitor startup or after data gaps
- Useful when you need high confidence that the evaluation is based on a complete dataset
When disabled, the monitor will evaluate based on whatever data is available, even if partial. This provides faster detection but may be less reliable during the initial evaluation period.
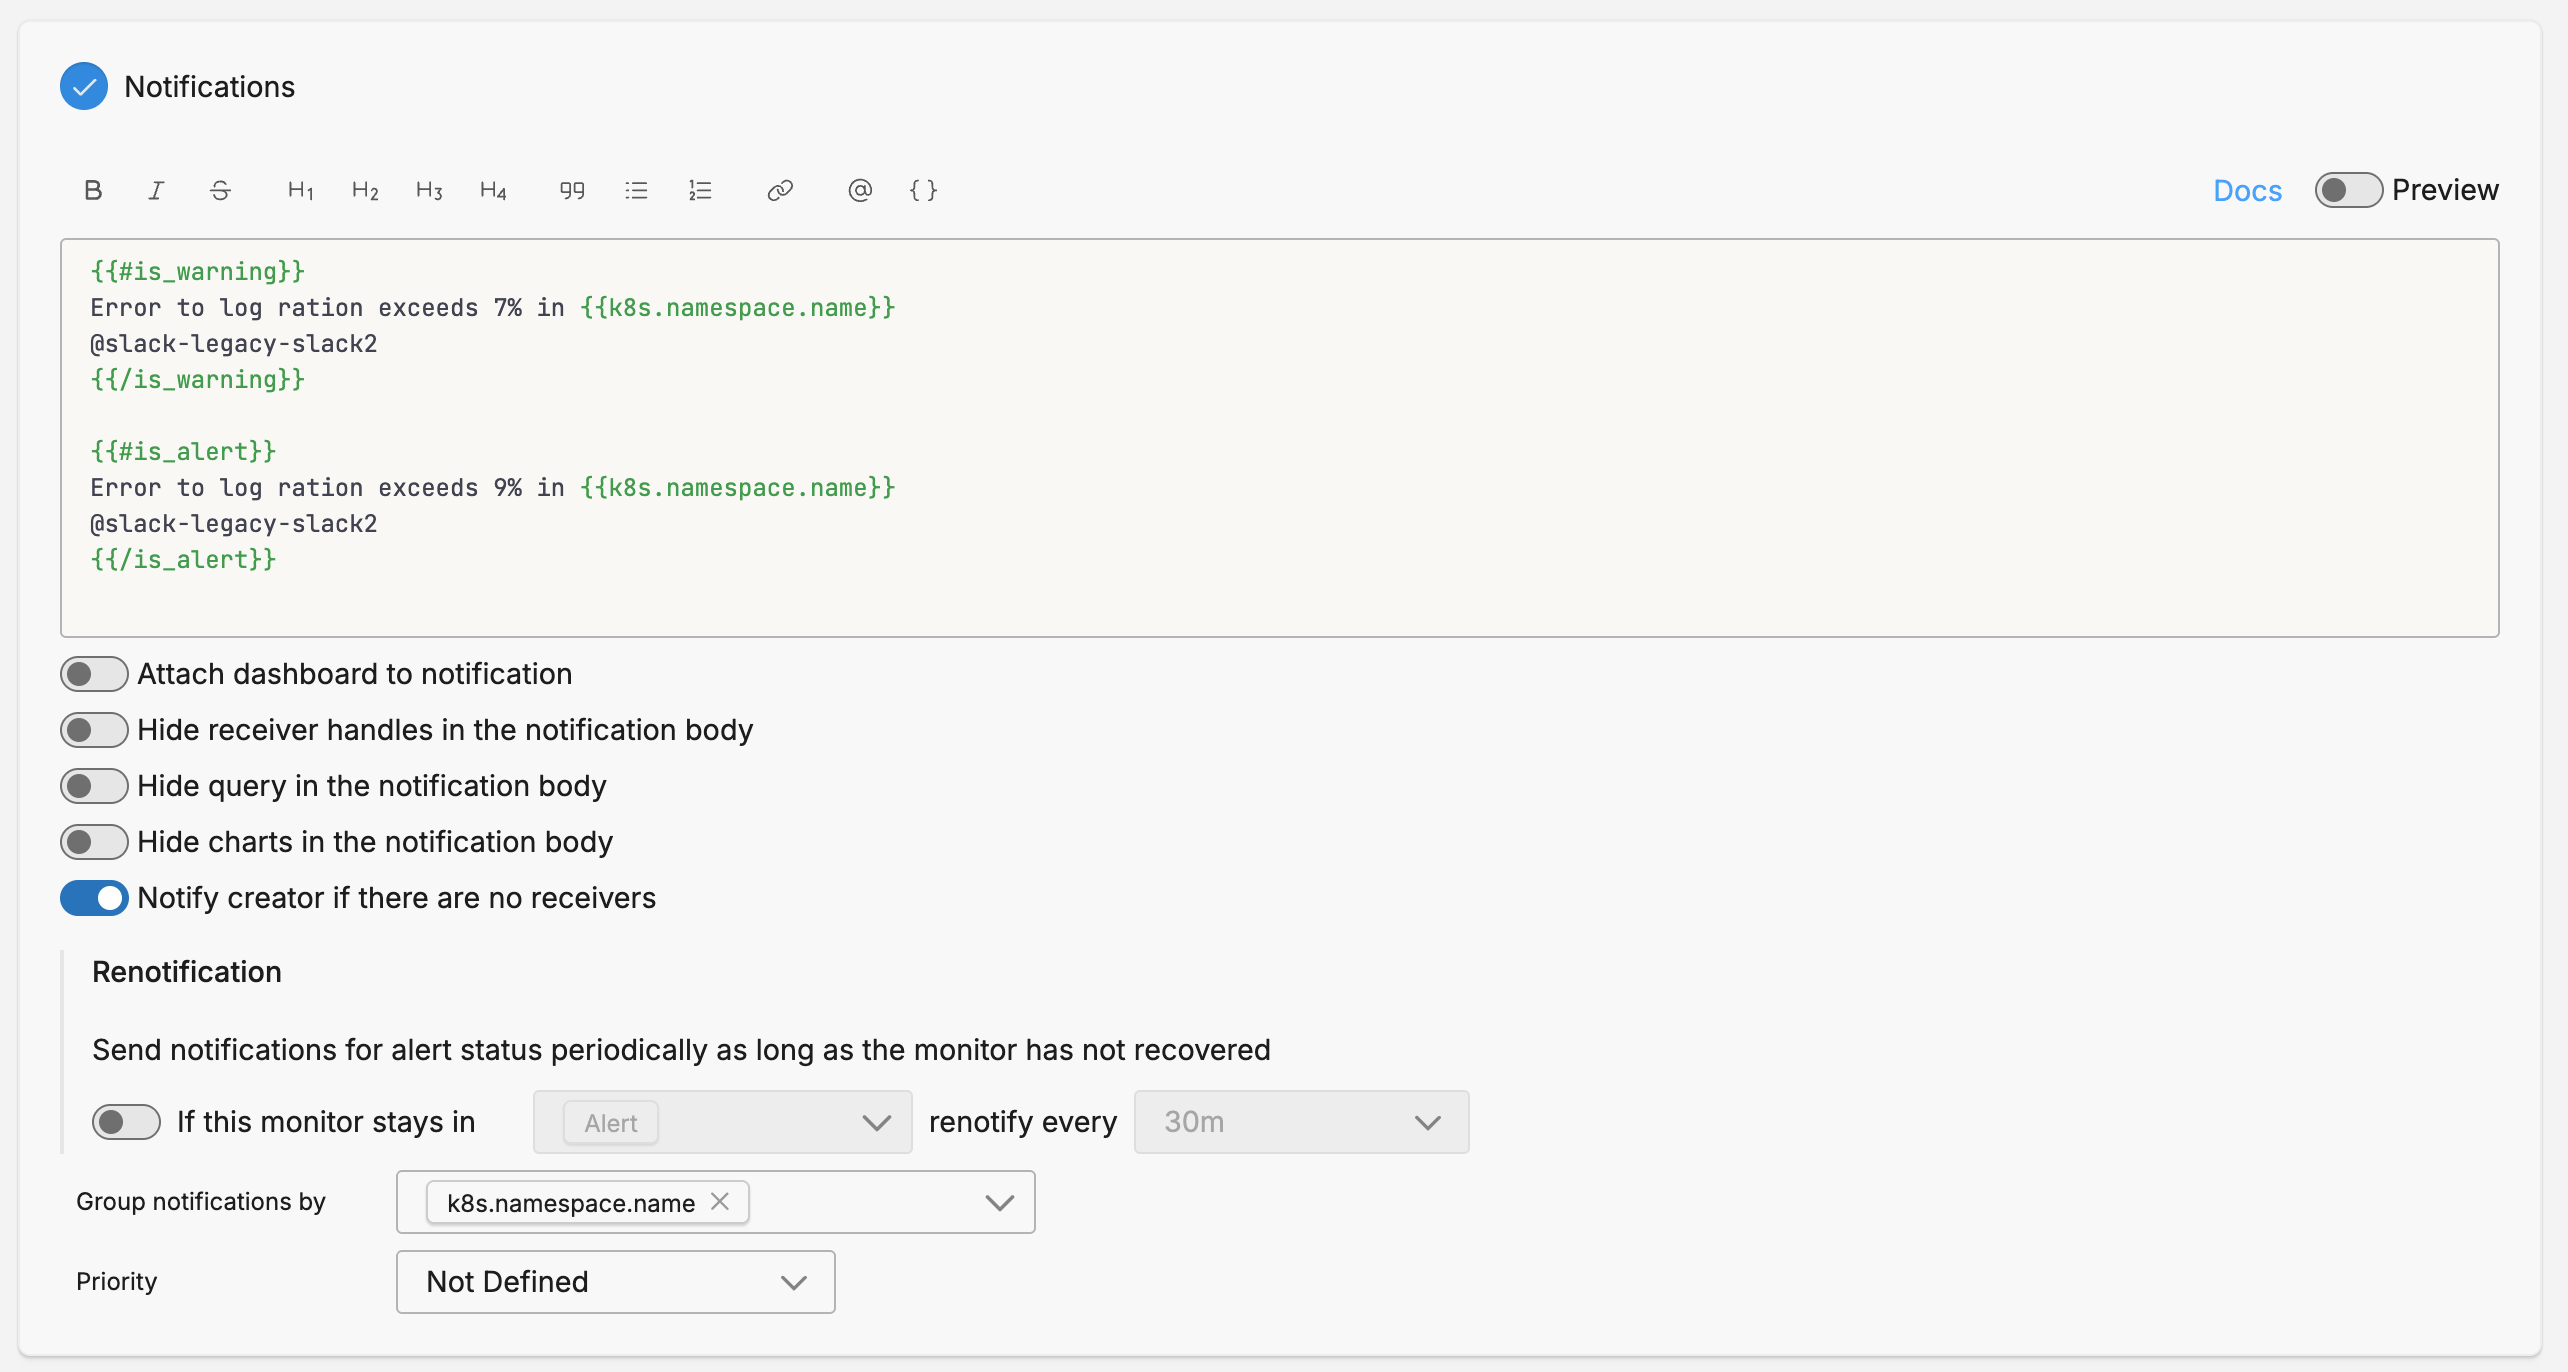
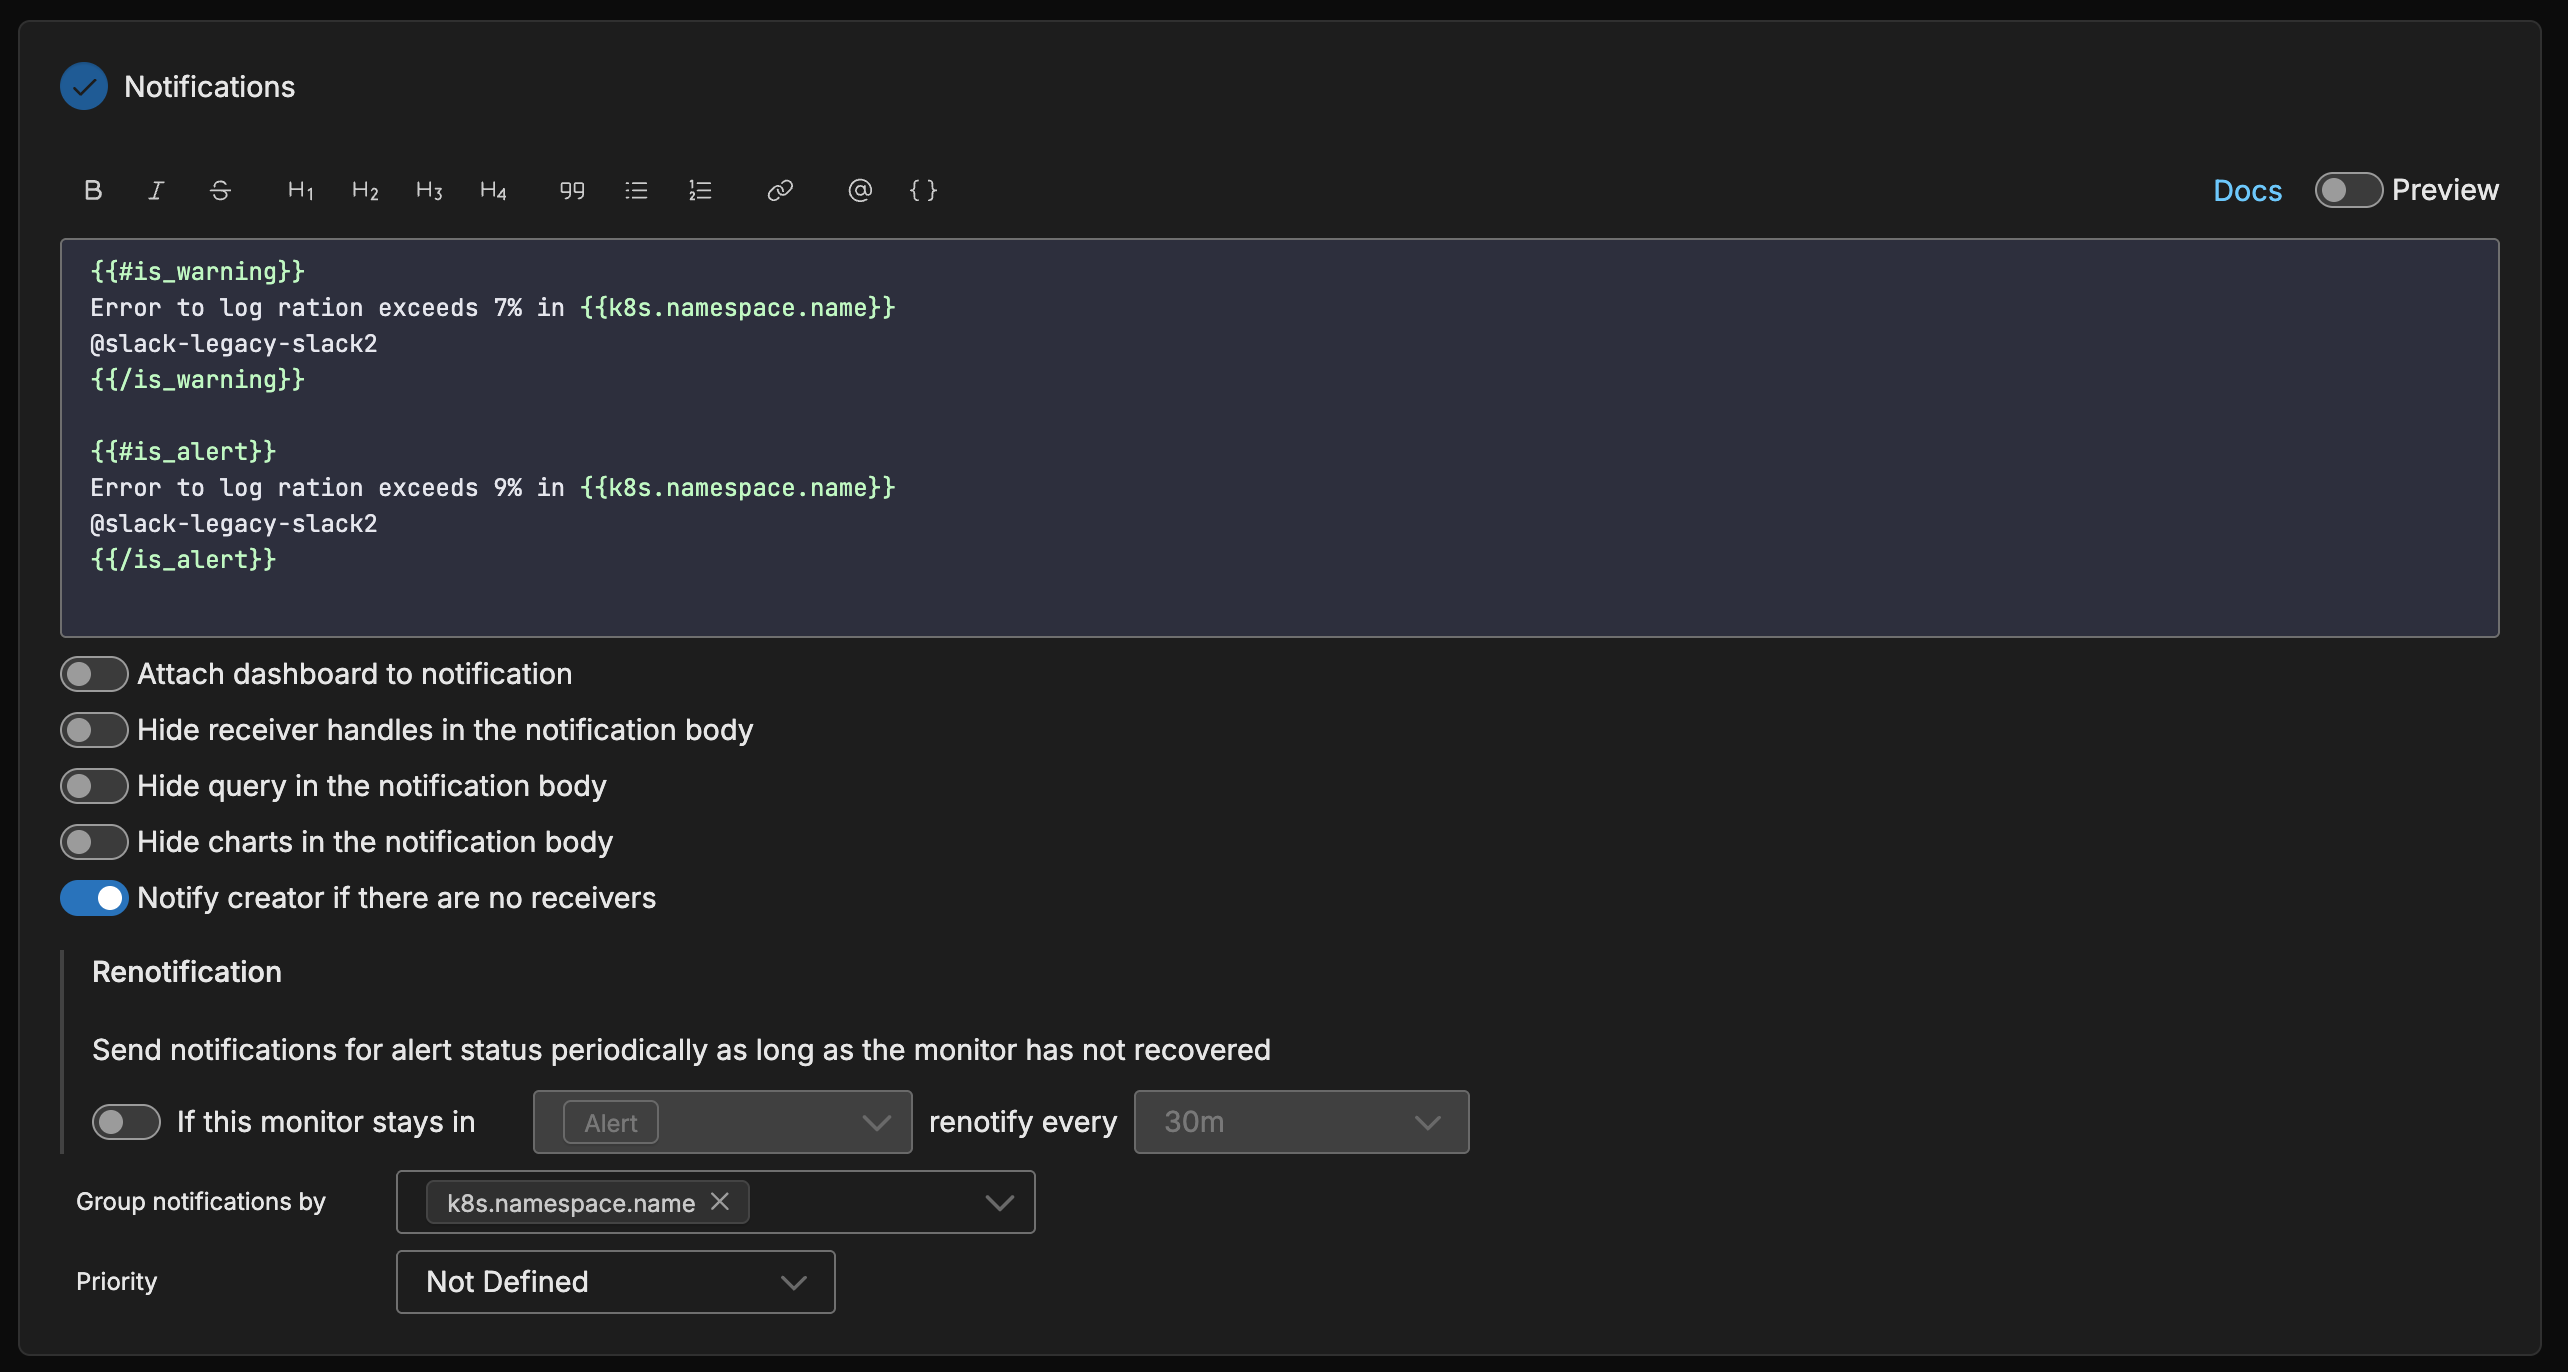
Notification
Metric data item fields
To use Source fields in the notification you must specify them in the Group By field in the Monitor Scope section and in the Group notifications by field in the Notifications section.