Pattern Anomaly Monitor
5 minute read
Overview
The Pattern Anomaly Monitor alerts you about a threshold of anomaly spikes in a specific time frame and for the configured source scope. You can use the alert to begin an investigation, such as by checking OnCall AI Analysis in the Logs - Anomalies page.
Create a Pattern Anomaly Monitor
To create a Pattern Anomaly monitor:
- Click Monitors and select the Triggered tab.

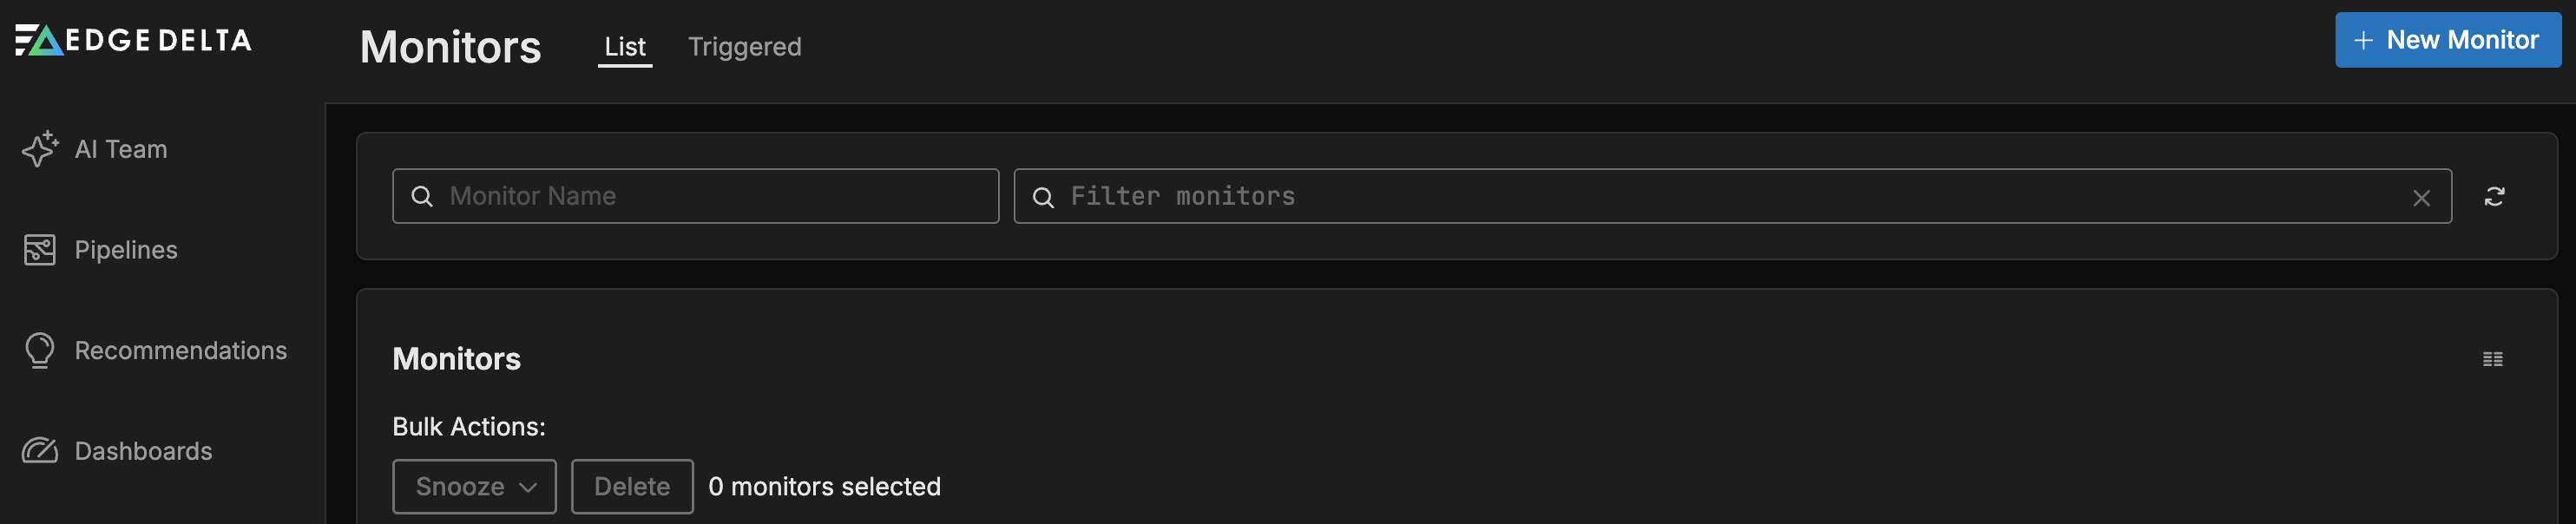
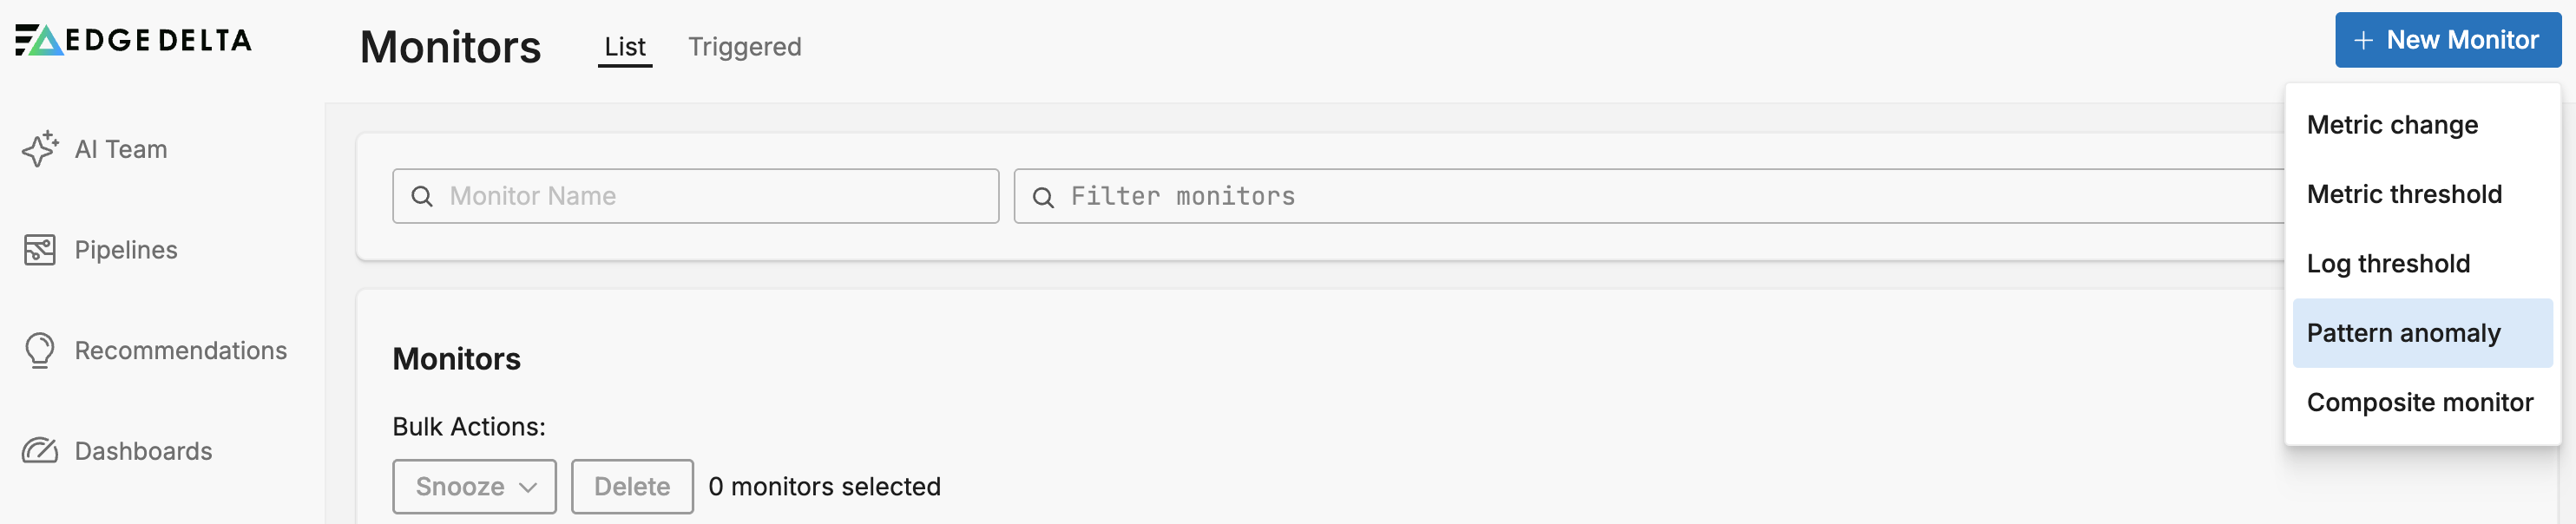
- Click + New Monitor and select Pattern Anomaly.

Configure Pattern Anomaly Monitor
The Pattern Anomaly Monitor evaluates the Pattern Anomaly count across all agents in the pipeline. In this example the anomaly count is grouped by pipeline.

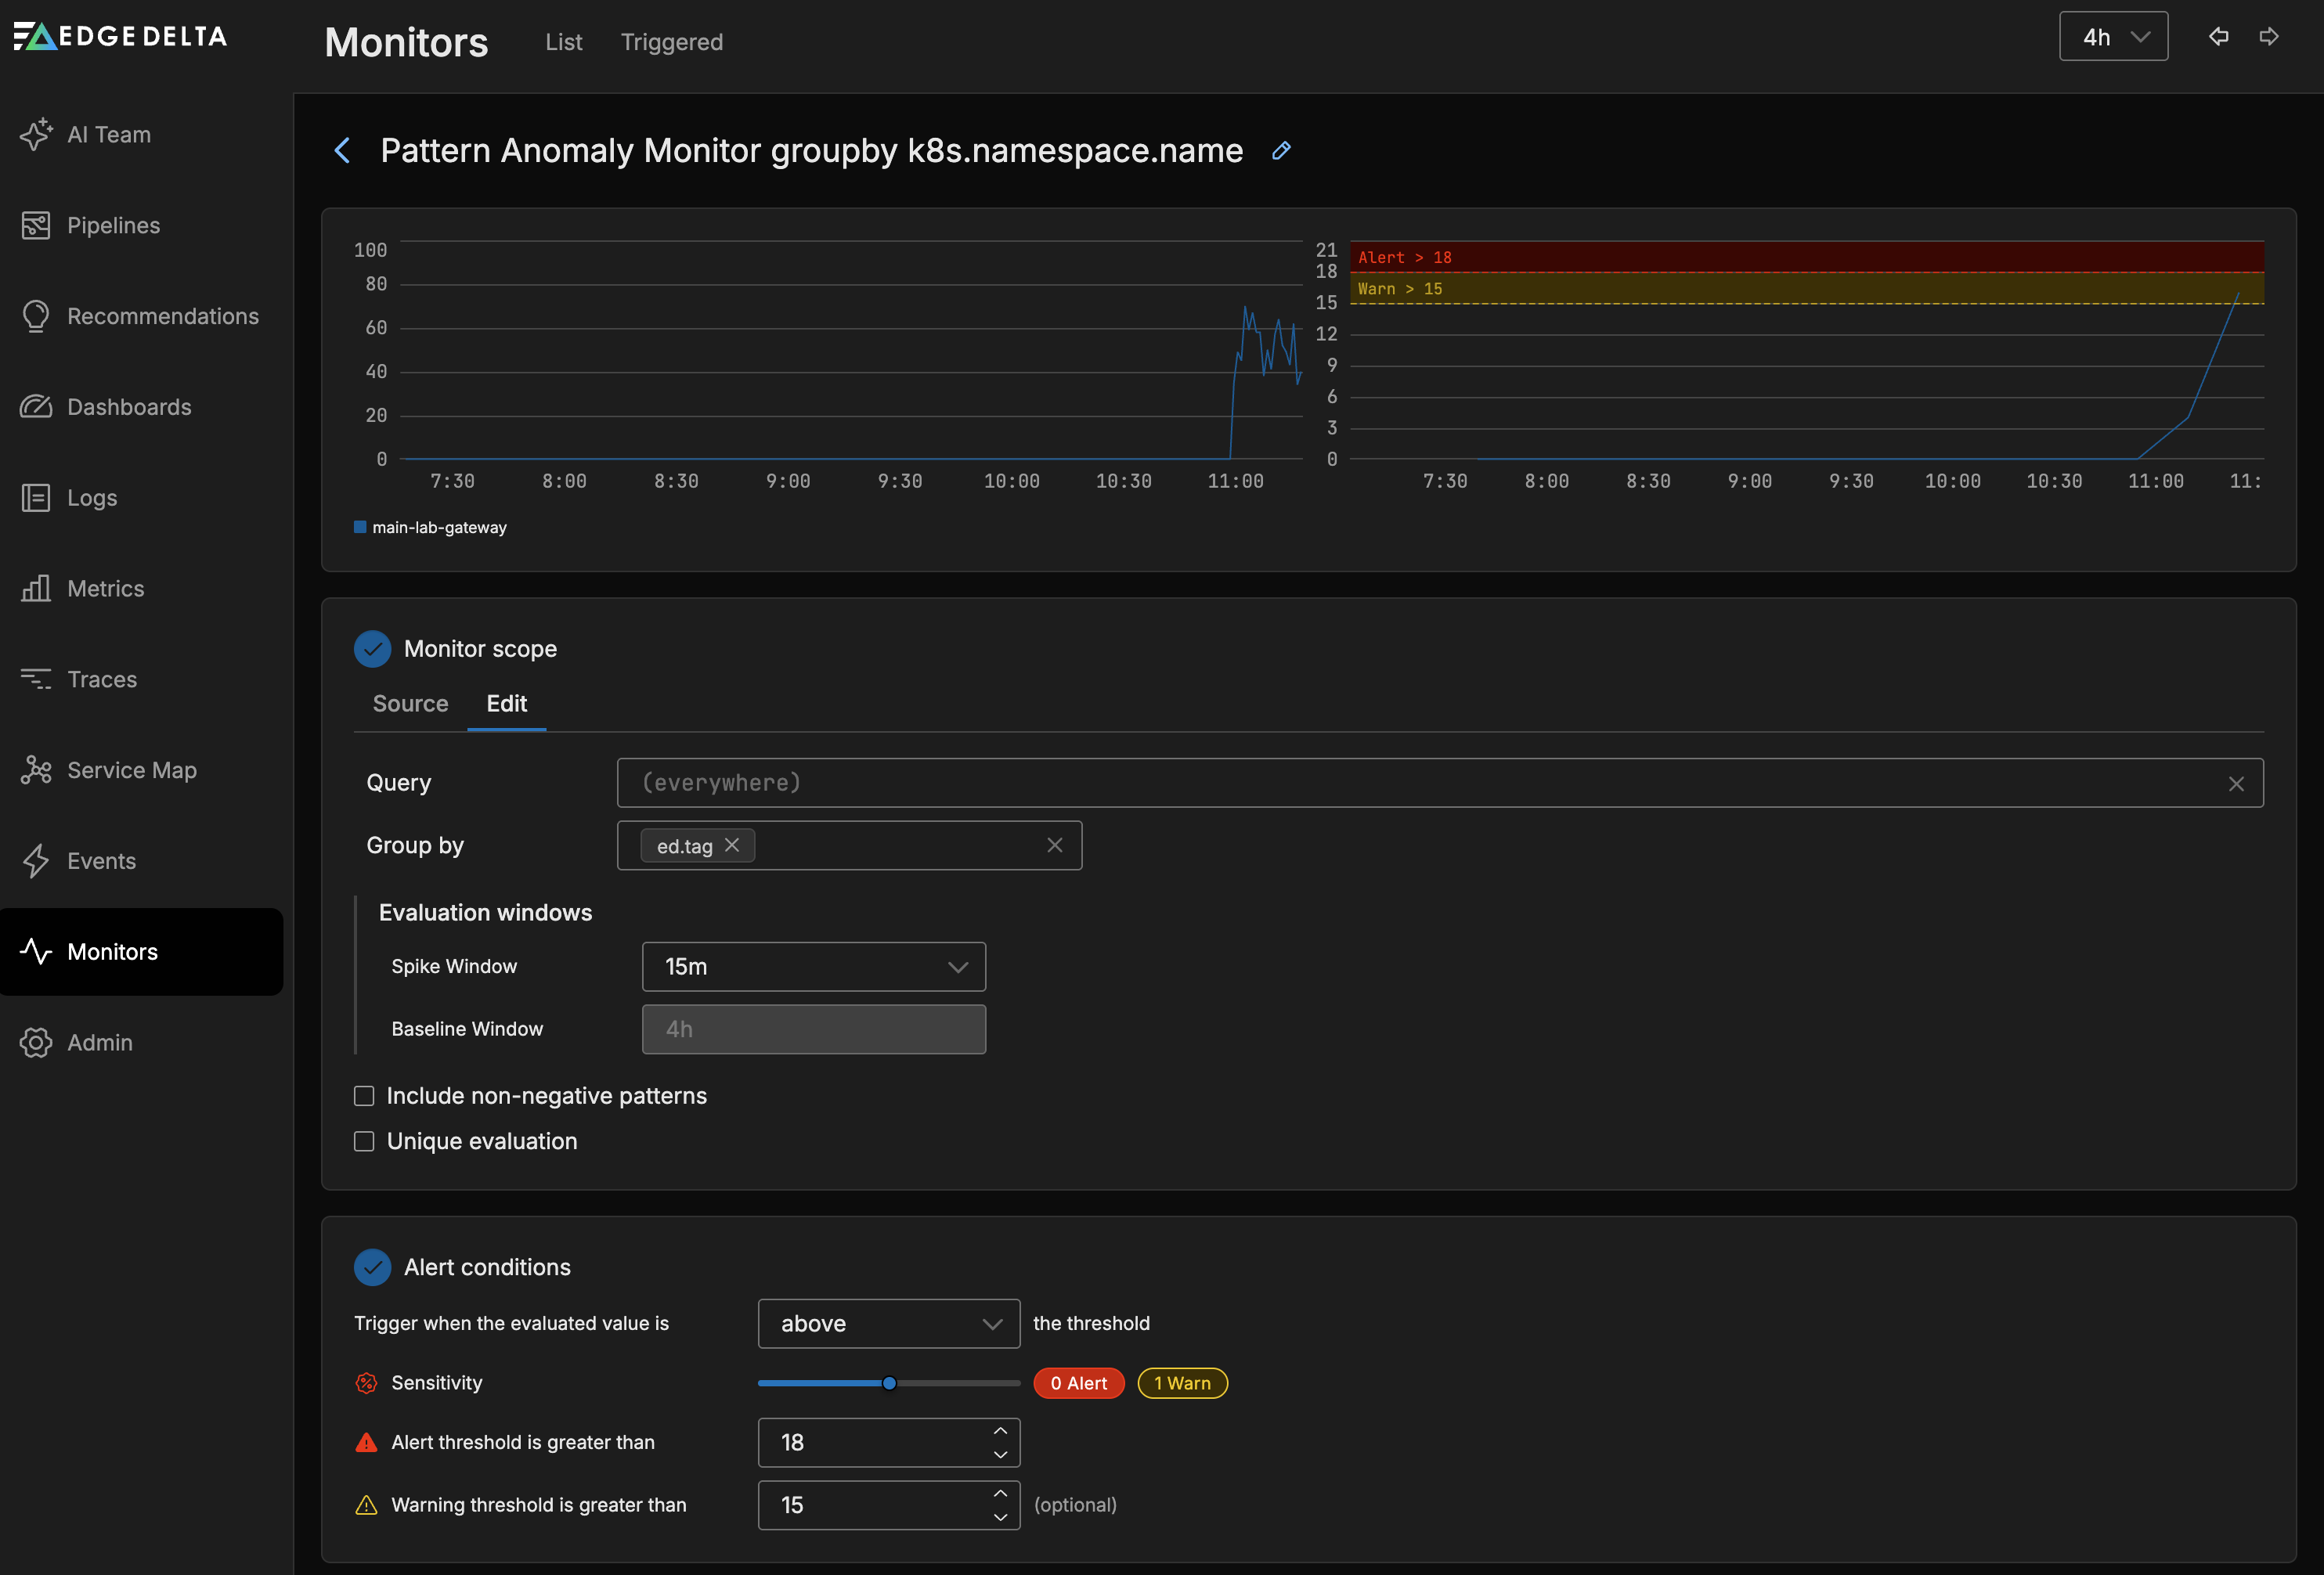
Monitor Scope
- Source: Use autocomplete to select the sources you want to monitor. For example you can specify a number of agent tags. If you leave this blank all sources will be monitored.
- Group by: You can group the monitored item by dimensions such as the agent tag, host, namespace etc. This option is required if you want to split notifications by group such as namespace. See Monitor Limits for group-by limits.
Alert Conditions
Configure the thresholds that the monitored item should be evaluated against in this section.
- You can choose to trigger when the evaluated value is
Above,Above or equal to,BeloworBelow or equal tothe thresholds. - You can select a warning and an alert thresholds. As you add the thresholds they are displayed in the graph relative to the current source’s values.
Sensitivity
Sensitivity controls how many deviations the system counts as spikes. The system compares current pattern counts against a baseline established from the lookback period configured at the top of the monitor page.
- A lower sensitivity detects smaller deviations from the baseline, producing a higher spike count and more potential alerts.
- A higher sensitivity requires larger deviations before counting them as spikes, reducing the spike count and filtering out minor fluctuations.
As you adjust the sensitivity slider, the graph updates in real time to show how many spikes fall into the warning and alert zones. Use this visual feedback to find a sensitivity level that captures meaningful anomalies without generating excessive alerts.
Tuning guidance
| Goal | Approach |
|---|---|
| Detect subtle changes early | Lower the sensitivity and set a low warning threshold. Expect more alerts. |
| Reduce alert noise | Raise the sensitivity to filter out minor deviations. Set a higher alert threshold. |
| Stage alerts by severity | Set the warning threshold lower than the alert threshold. Route warnings to Slack and alerts to PagerDuty. |
| Monitor specific services | Use the Source filter to scope the monitor to specific agent tags, then adjust sensitivity per monitor. |
For a conceptual explanation of how baselines and spikes relate to anomaly scoring, see How anomaly scoring works.
Notification
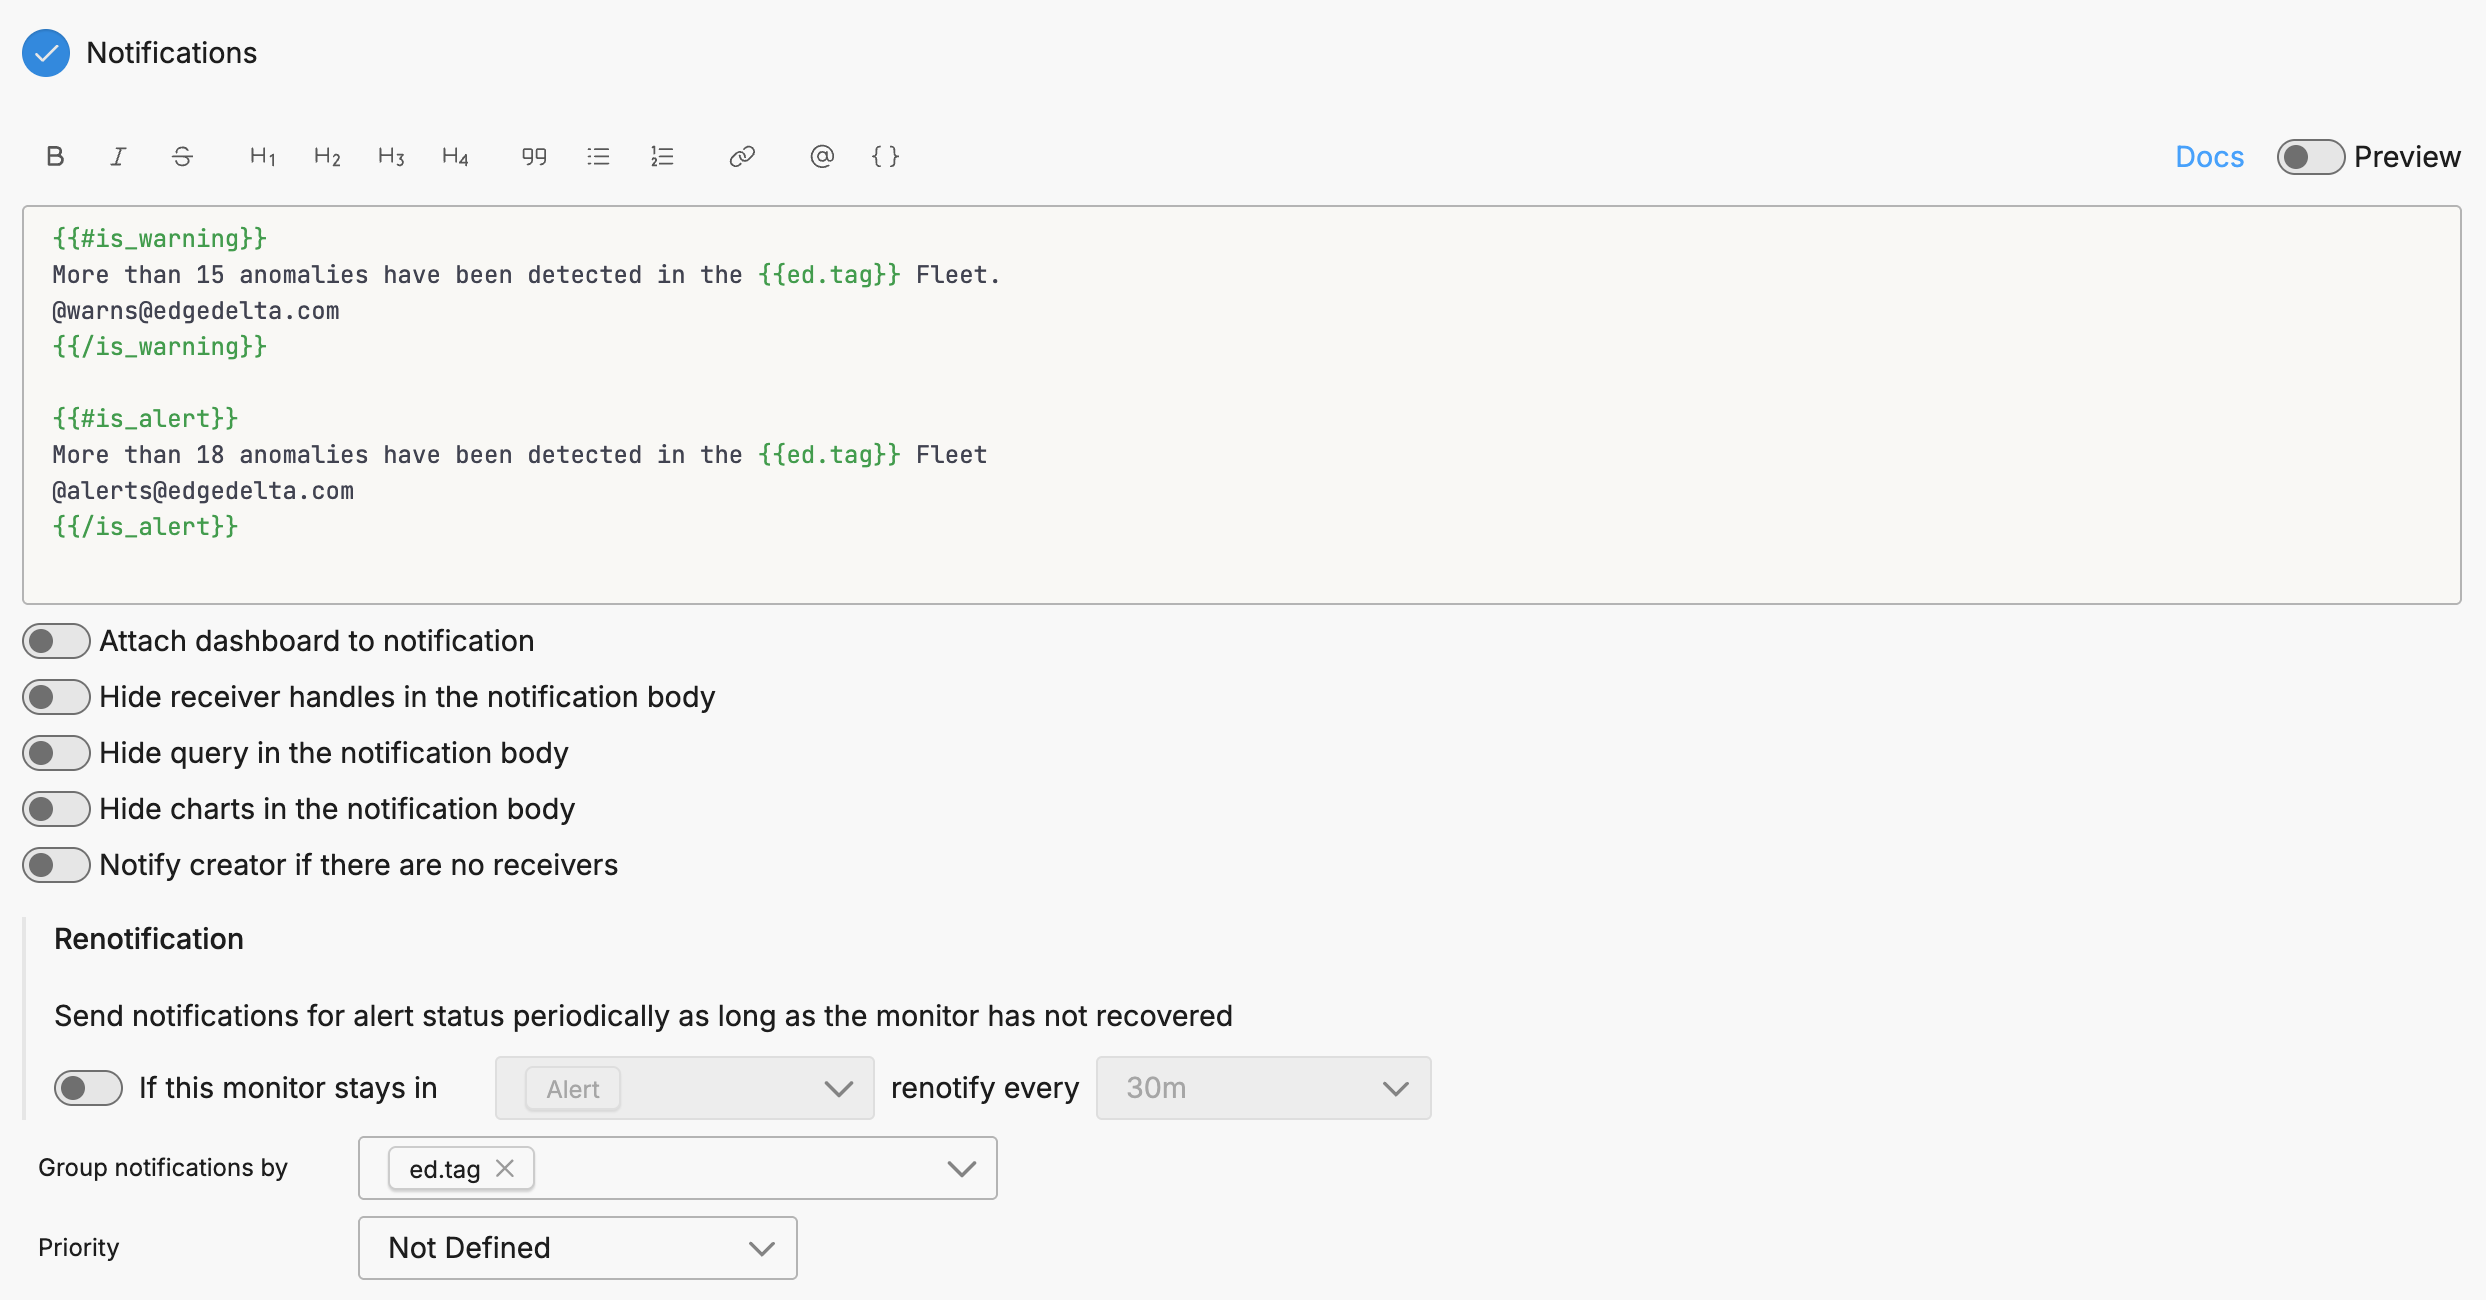
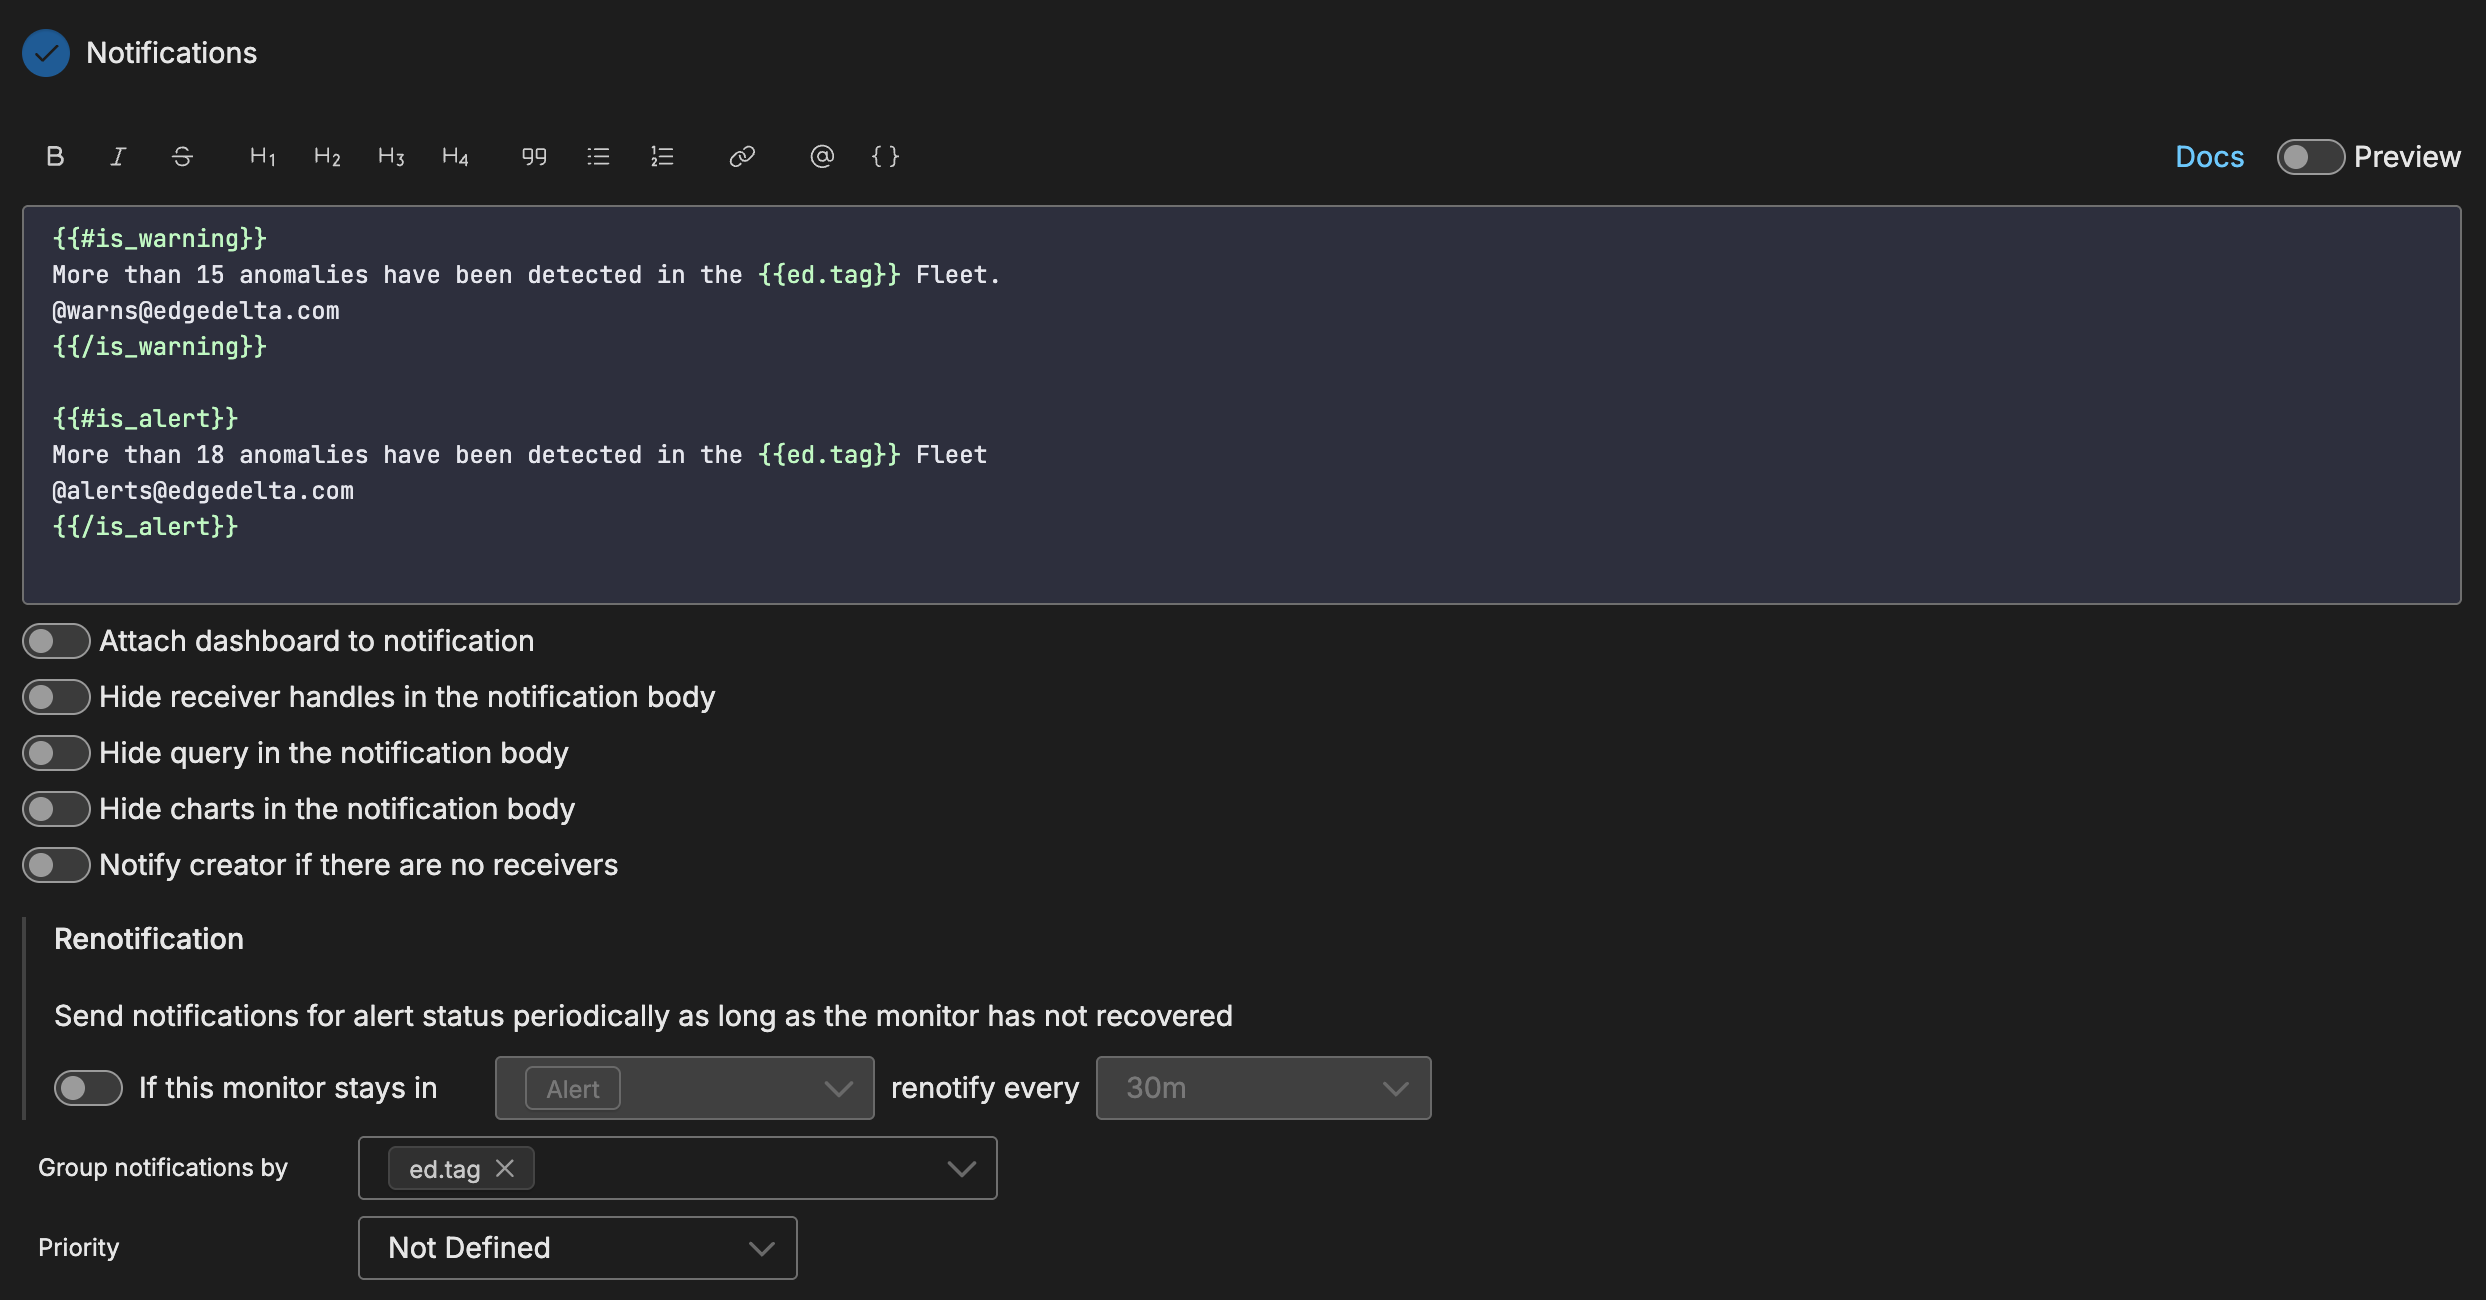
To use source fields in the notification you must specify them in the Group By field in the Monitor Scope section and in the Group notifications by field in the Notifications section.
Route Alerts to AI Teammates
Pattern anomaly monitors can route alerts to AI teammates for autonomous investigation. When configured, teammates receive the alert context and begin analyzing the anomaly without manual intervention.
Configuration
To route pattern anomaly alerts to AI teammates:
- In the Notification section, add an AI Team channel as a notification destination
- Configure the escalation states (WARN to ALERT) to control when teammates engage
- Optionally group anomalies by attributes such as service name to help teammates scope their investigation
What Happens When an Alert Routes to AI Team
When an anomaly alert arrives, the assigned teammate:
- Pulls relevant logs, metrics, and traces from the affected pipeline
- Identifies likely root causes based on the pattern content
- Reviews historical trends to determine if similar patterns occurred before
- Examines related services for correlated errors
- Proposes mitigation steps with links to the relevant anomaly events
This workflow proceeds autonomously, with findings posted back to the channel for review. See Specialized Teammates for details on the investigation workflow.
Troubleshooting
| Symptom | Cause | Solution |
|---|---|---|
| Monitor shows “No Data” | No negative log patterns are flowing into the system. The Pattern Anomaly Monitor evaluates negative pattern counts, so if no patterns are classified as negative, there is nothing to evaluate. | Verify that your sentiment keywords in Global Data Settings match words that appear in your actual log body content. Check the Patterns tab on the Logs page to confirm negative patterns exist for the monitored sources. |
| Threshold never triggers despite some negative patterns | The negative pattern count does not exceed the configured threshold at the current sensitivity. Adjusting threshold and sensitivity does not help when the upstream pattern count is too low. | Confirm that negative patterns are flowing consistently using the Patterns tab. If counts are near zero, the issue is upstream: review your sentiment keywords rather than lowering thresholds. |
| Sentiment keywords exist but no patterns are classified as negative | The Log to Pattern Metric processor clusters the body field by default. Keywords that appear only in log attributes are not matched. Tokenization is whitespace-based, so a keyword like unauthorized does not match a compound token like UnauthorizedOperation. | Verify that your sentiment keywords appear as standalone whitespace-separated tokens in the log body. If the relevant content is in an attribute, configure field_path in the Log to Pattern Metric processor to point to that attribute. |