Edge Delta Global Data Settings
3 minute read
Configuration
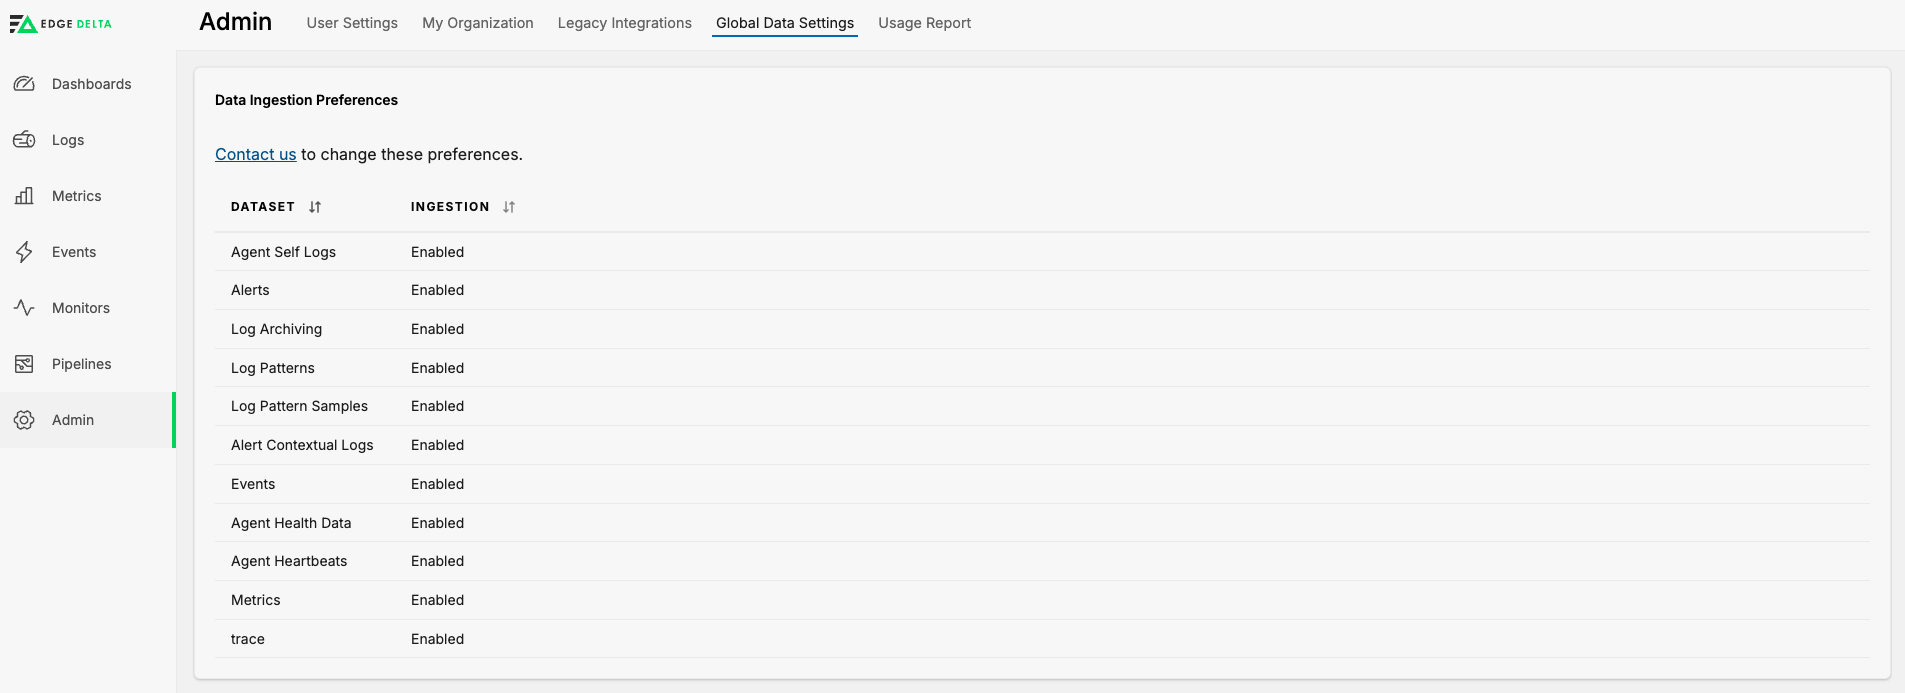
Edge Delta pipelines send certain data to the Edge Delta back end, for example agent health data and system events. In the Edge Delta App, click Admin, and then click the Global Data Settings.

Agent Self Logs
This data type represents the output of agent logs, which helps Edge Delta Support and engineering to troubleshooting agent behavior.
Alerts
This data type represents a signal detected by the agent regarding an unexpected event. This information and corresponding metadata are sent to the Edge Delta back end by default. This data type is based on the threshold settings in the Pipeline configuration.
Log Archiving
This data type represents the compressed storage of raw logs on a cloud storage service, such as S3. Edge Delta maintains separate S3 buckets per customer organization. This data type populates the Log Search page where you can filter for specific logs.
Due to an ingestion delay of archived files, logs in from the past few minutes may not display.
Log Patterns
Patterns are reduced versions of the original log line where specific parts are placed with asterisks *. Typically, these patterns do not contain sensitive data. This data type can be enabled by adding a cluster processor.
Log Pattern Samples
This data type represents the raw logs that match a specific pattern. For each distinct cluster pattern found by the agent, the agent also sends a few samples of that cluster.
Alert Contextual Logs
This data type represents the logs generated from an issue. An issue can be an anomaly detected by an individual agent or by the back end processing jobs. Contextual logs are useful to investigate an issue and find a root cause.
Events
An event is a Kubernetes-based anomaly. By default, Edge Delta consumes Kubernetes system events.
Agent Health Data
This data type represents the various critical internal components of the agent. This data includes:
- Success count
- Failure count
- Last error
- Start time
Agent Heartbeats
This data type represents the heartbeat that the agent sends to the back end every minute. Edge Delta uses this information to ensure that the agent is running. This information populates the Pipelines Dashboard page of the Edge Delta App.
Metrics
This data type can be collected from the environment, such as system_stats, or generated by a processor.
Turning off metrics will disable the pipeline status page, which is populated by metrics.
To change data ingestion preferences you need to contact Edge Delta.
You can also set automatic monitor creation. This configures a set of default monitors upon account creation.

Alert Creation Preferences
Contact Edge Delta to disable the automatic creation of Monitors.
Configuration Variables
If your account contains multiple pipelines, you may want to consider setting variables that can be globally applied. These variables can be referenced in you Pipeline configurations either with or without a fallback default value:
'{{ Env "MY_VARIABLE_NAME" }}''{{ Env "MY_VARIABLE_NAME" "my default value" }}'
If the default value is not provided and there is no variable set the Agent will stop with an error. If a default value is provided, but the variable does not exist, the default value will be used.
Environment variables can only be used with string-typed inputs.
nodes:
  - name: my_http_port
	type: http_output
	endpoint: '{{ Env "MY_HTTP_ENDPOINT" }}'
Sentiment Analysis
Every pattern detected by the Edge Delta agent is analyzed to check for negative sentiment. Negative sentiment is determined by checking for the presence of specific keywords or Golang Regex patterns. Some keywords such as debug are considered neutralizing because they automatically offset negative keyword matches in the pattern. Sentiment keywords are applied to all pipelines within the account.
You can specify Golang Regex such as alert([=\s\*]+|$) or string literals such as broken. Literals are not case sensitive.

Note: You must reload the pipeline after changing sentiment keywords.