Performance Profiling Edge Delta Agents
3 minute read
Overview
Performance Profiler (PPROF) is a tool used to analyze the performance of Edge Delta agents. It helps visualize where time, CPU, or memory is being spent during execution. You can use it for debugging, trend analysis, remote diagnostics and to detect bottlenecks. The PPROF traffic has no cost to your plan.
For each agent you can view 4 dimensions:
- CPU: How much CPU time your program is consuming, broken down by function. It helps identify CPU-heavy operations such as a particular parsing or transformation step is chewing through cycles. It is good for spotting hot code paths that need optimization.
- Allocs: Number and size of memory allocations (how often memory is being requested). Frequent or large allocations can lead to memory churn and pressure on the garbage collector (GC). It is useful to find unnecessary memory allocations that slow things down.
- Heap: Memory in use and managed by the Go heap at the time of the snapshot. This tells you how much memory your program actually holds on to, and how well GC is working. Look for unexpectedly large or growing heap usage: that’s a red flag.
- Goroutine: Current stack traces of all active goroutines (lightweight threads in Go). It helps identify concurrency issues like too many routines running, leaks, or blocked threads. Thousands of unexpected goroutines require investigation.
Requirements
- Before agent versions older than v1.31.0 PPROF are enabled by default.
- For agent v1.31.0 PPROF must be enabled but this version doesn’t honor host and type selections.
- From agent v1.32.0 it honors host and type selections.
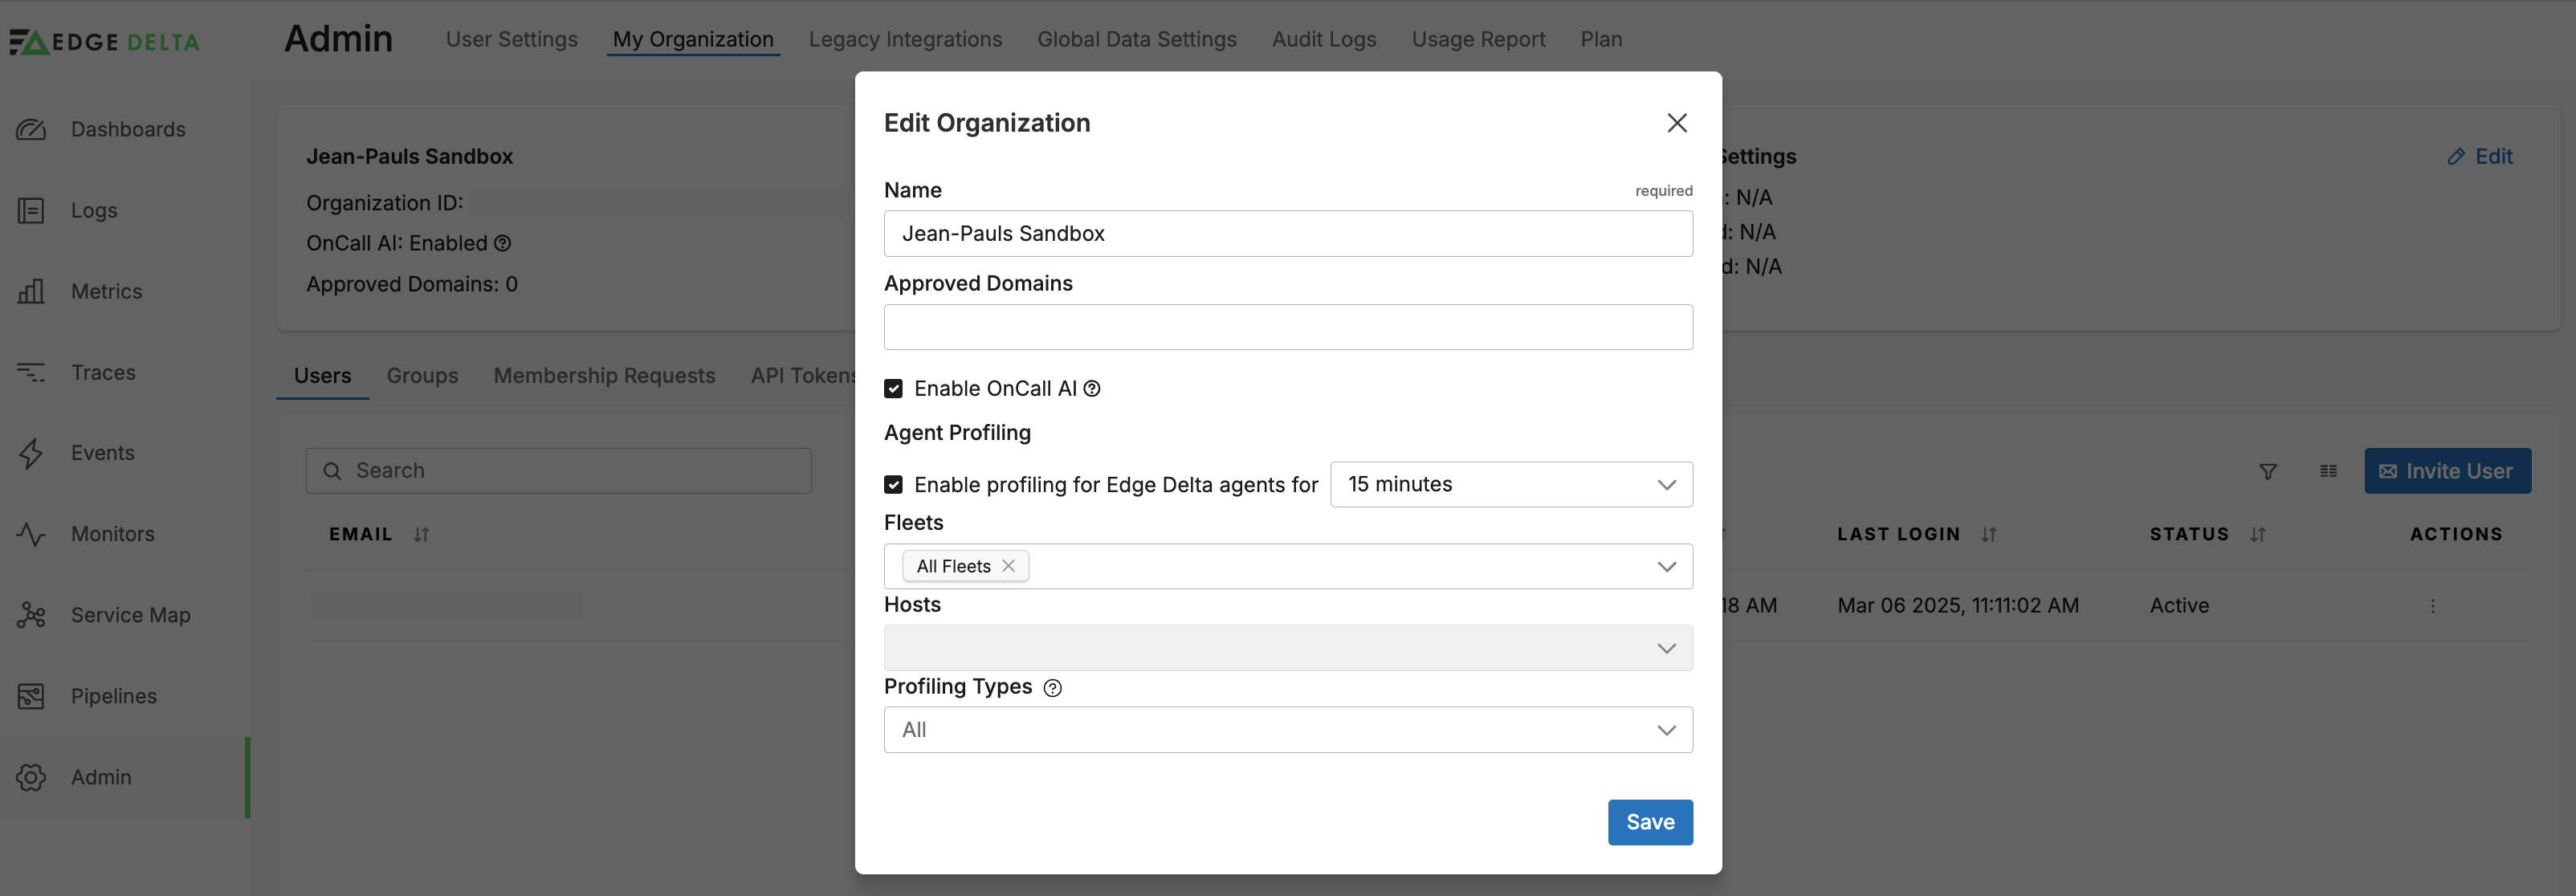
Enable PPROF
Profiling of Edge Delta agents is disabled by default but you can enable it for a set duration.
- Click Admin.
- Select the My Organization tab.
- Click Edit.
- Select Enable profiling and specify a duration.
- Optionally, specify a scope for profiling, such as all pipelines and hosts or specific instances.
- Optionally specify specific profiling types.
- Click Save.
View PPROF
To view an agent’s performance profiler:
- Click Pipelines and select a pipeline.
- Select an agent.
- Open the Profiling tab
- Select a dimension
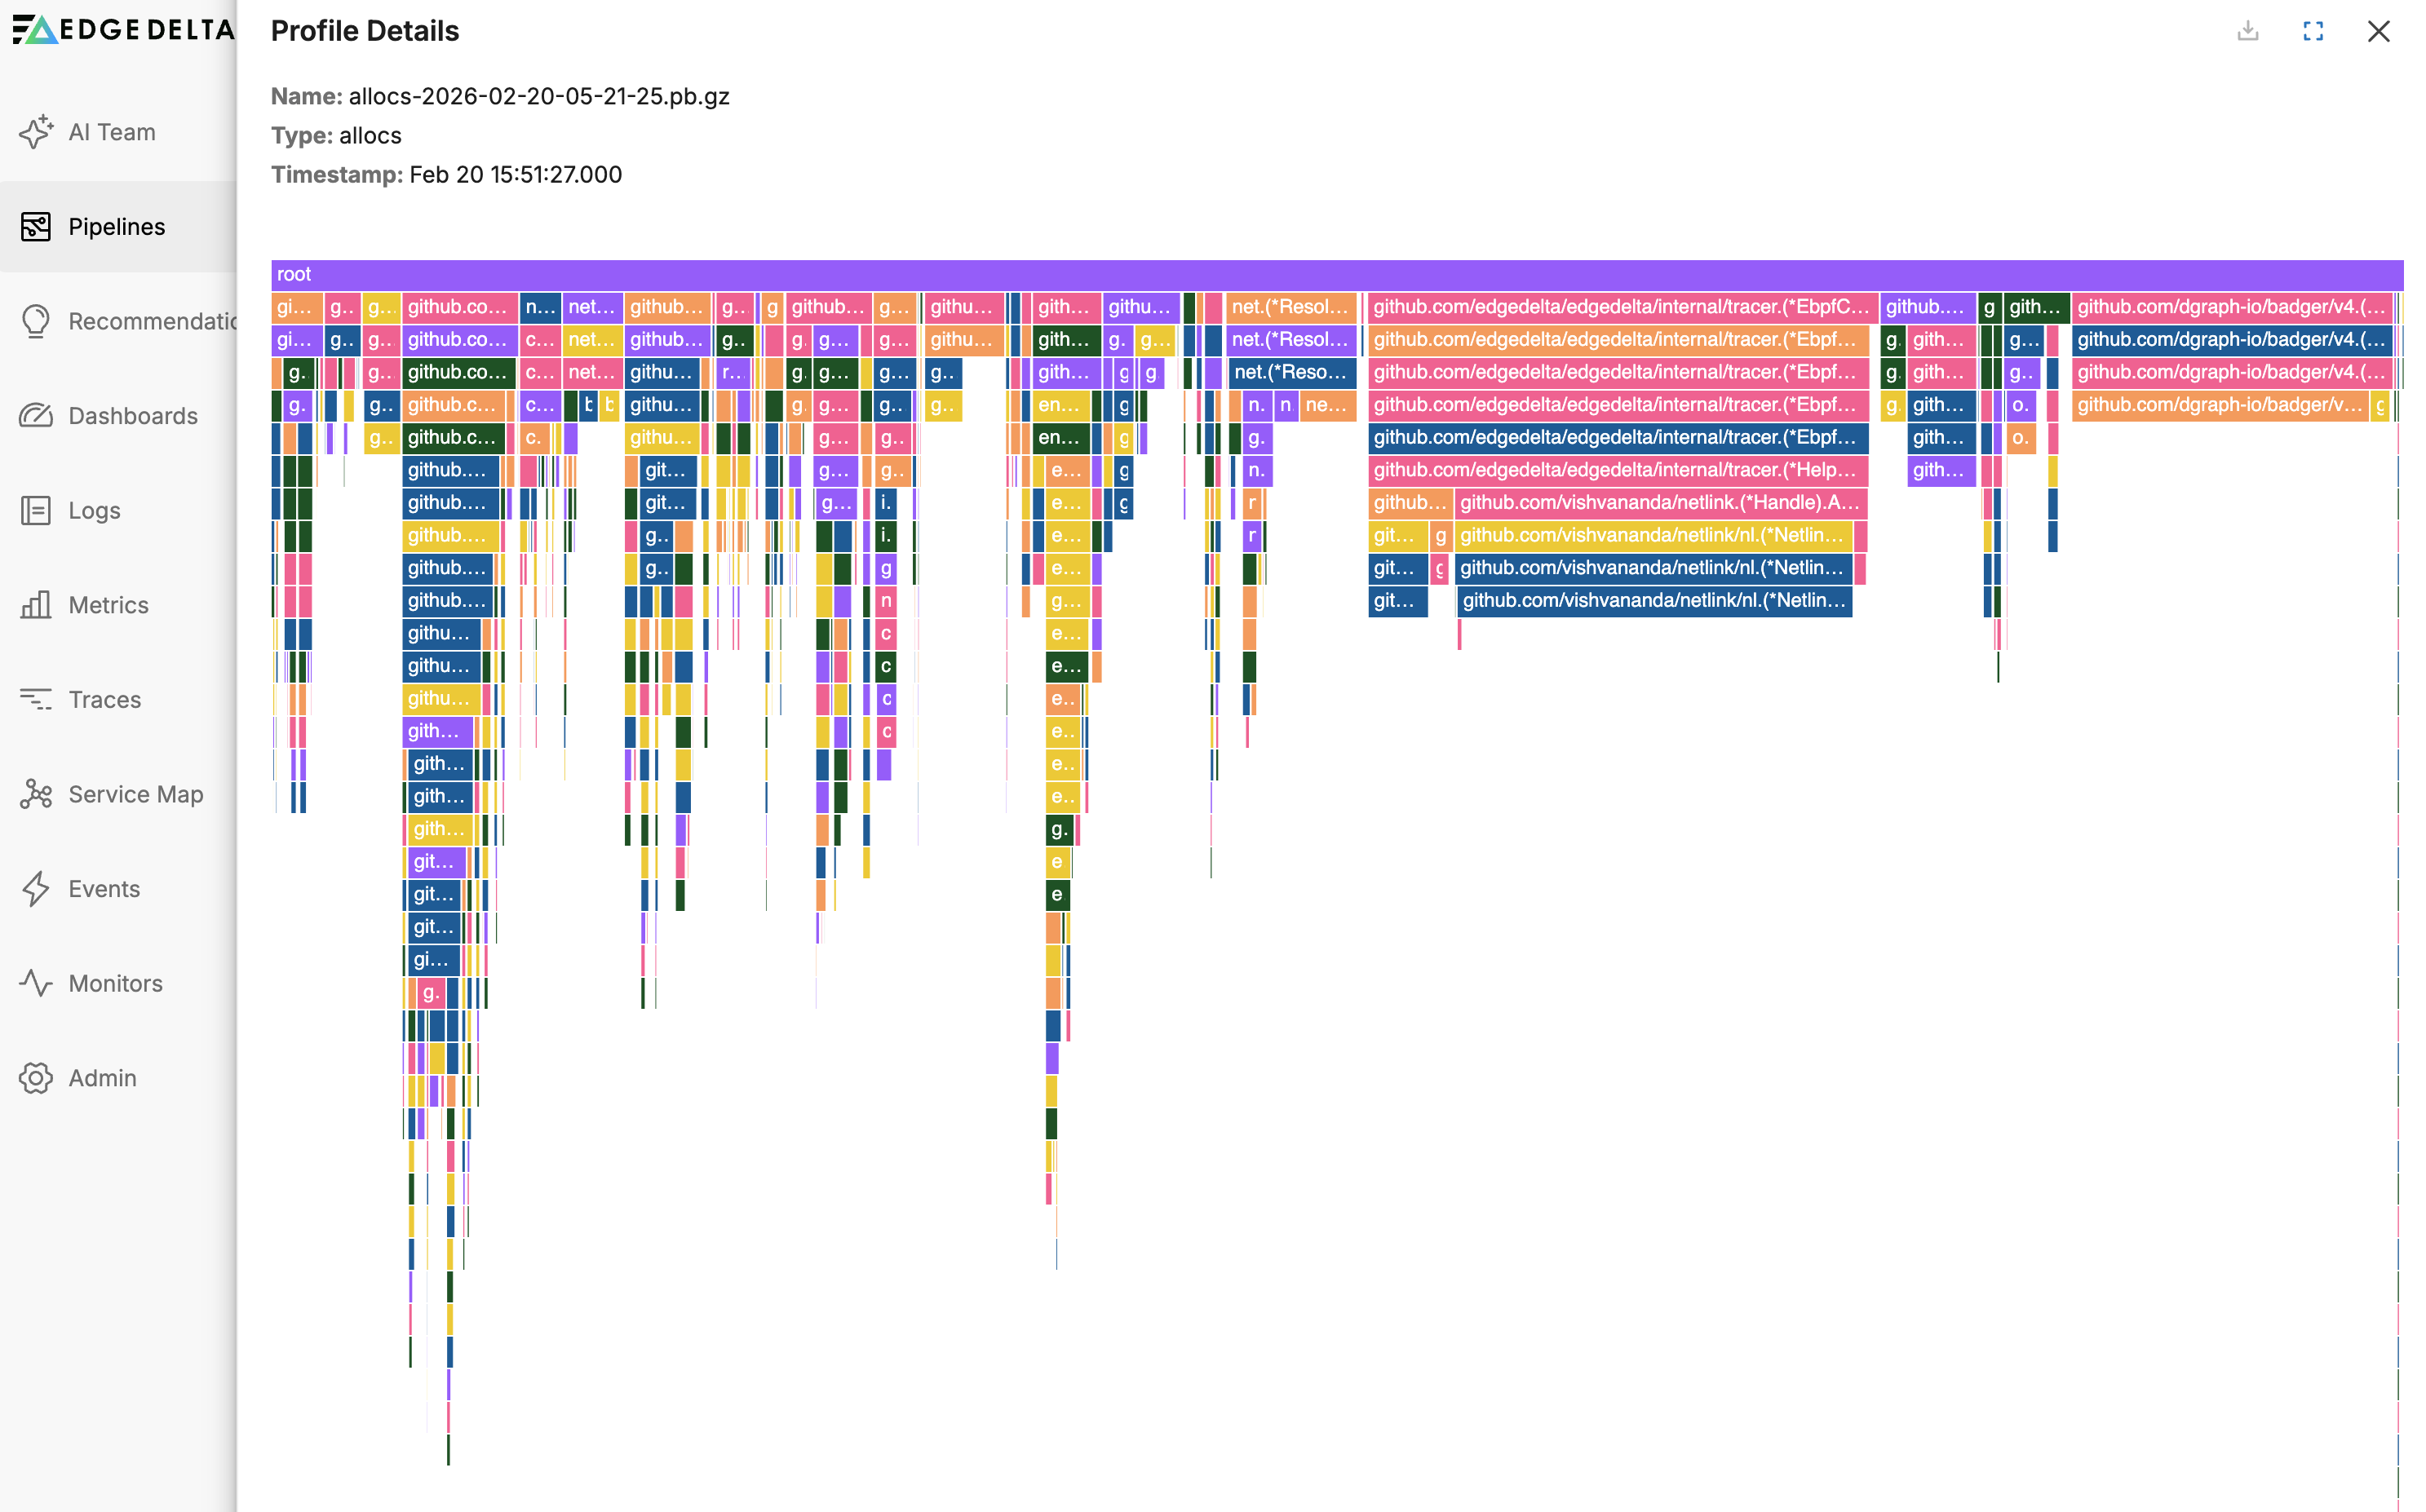
The flame graph shows a stacked call hierarchy:
- Width of a block is the amount of time/resources that function (and its children) used.
- X-axis is sorted by stack traces, not time.
- Y-axis shows stack depth (main calls func1, which calls func2, etc.)
You can hover for details and click to trace back through the call path.
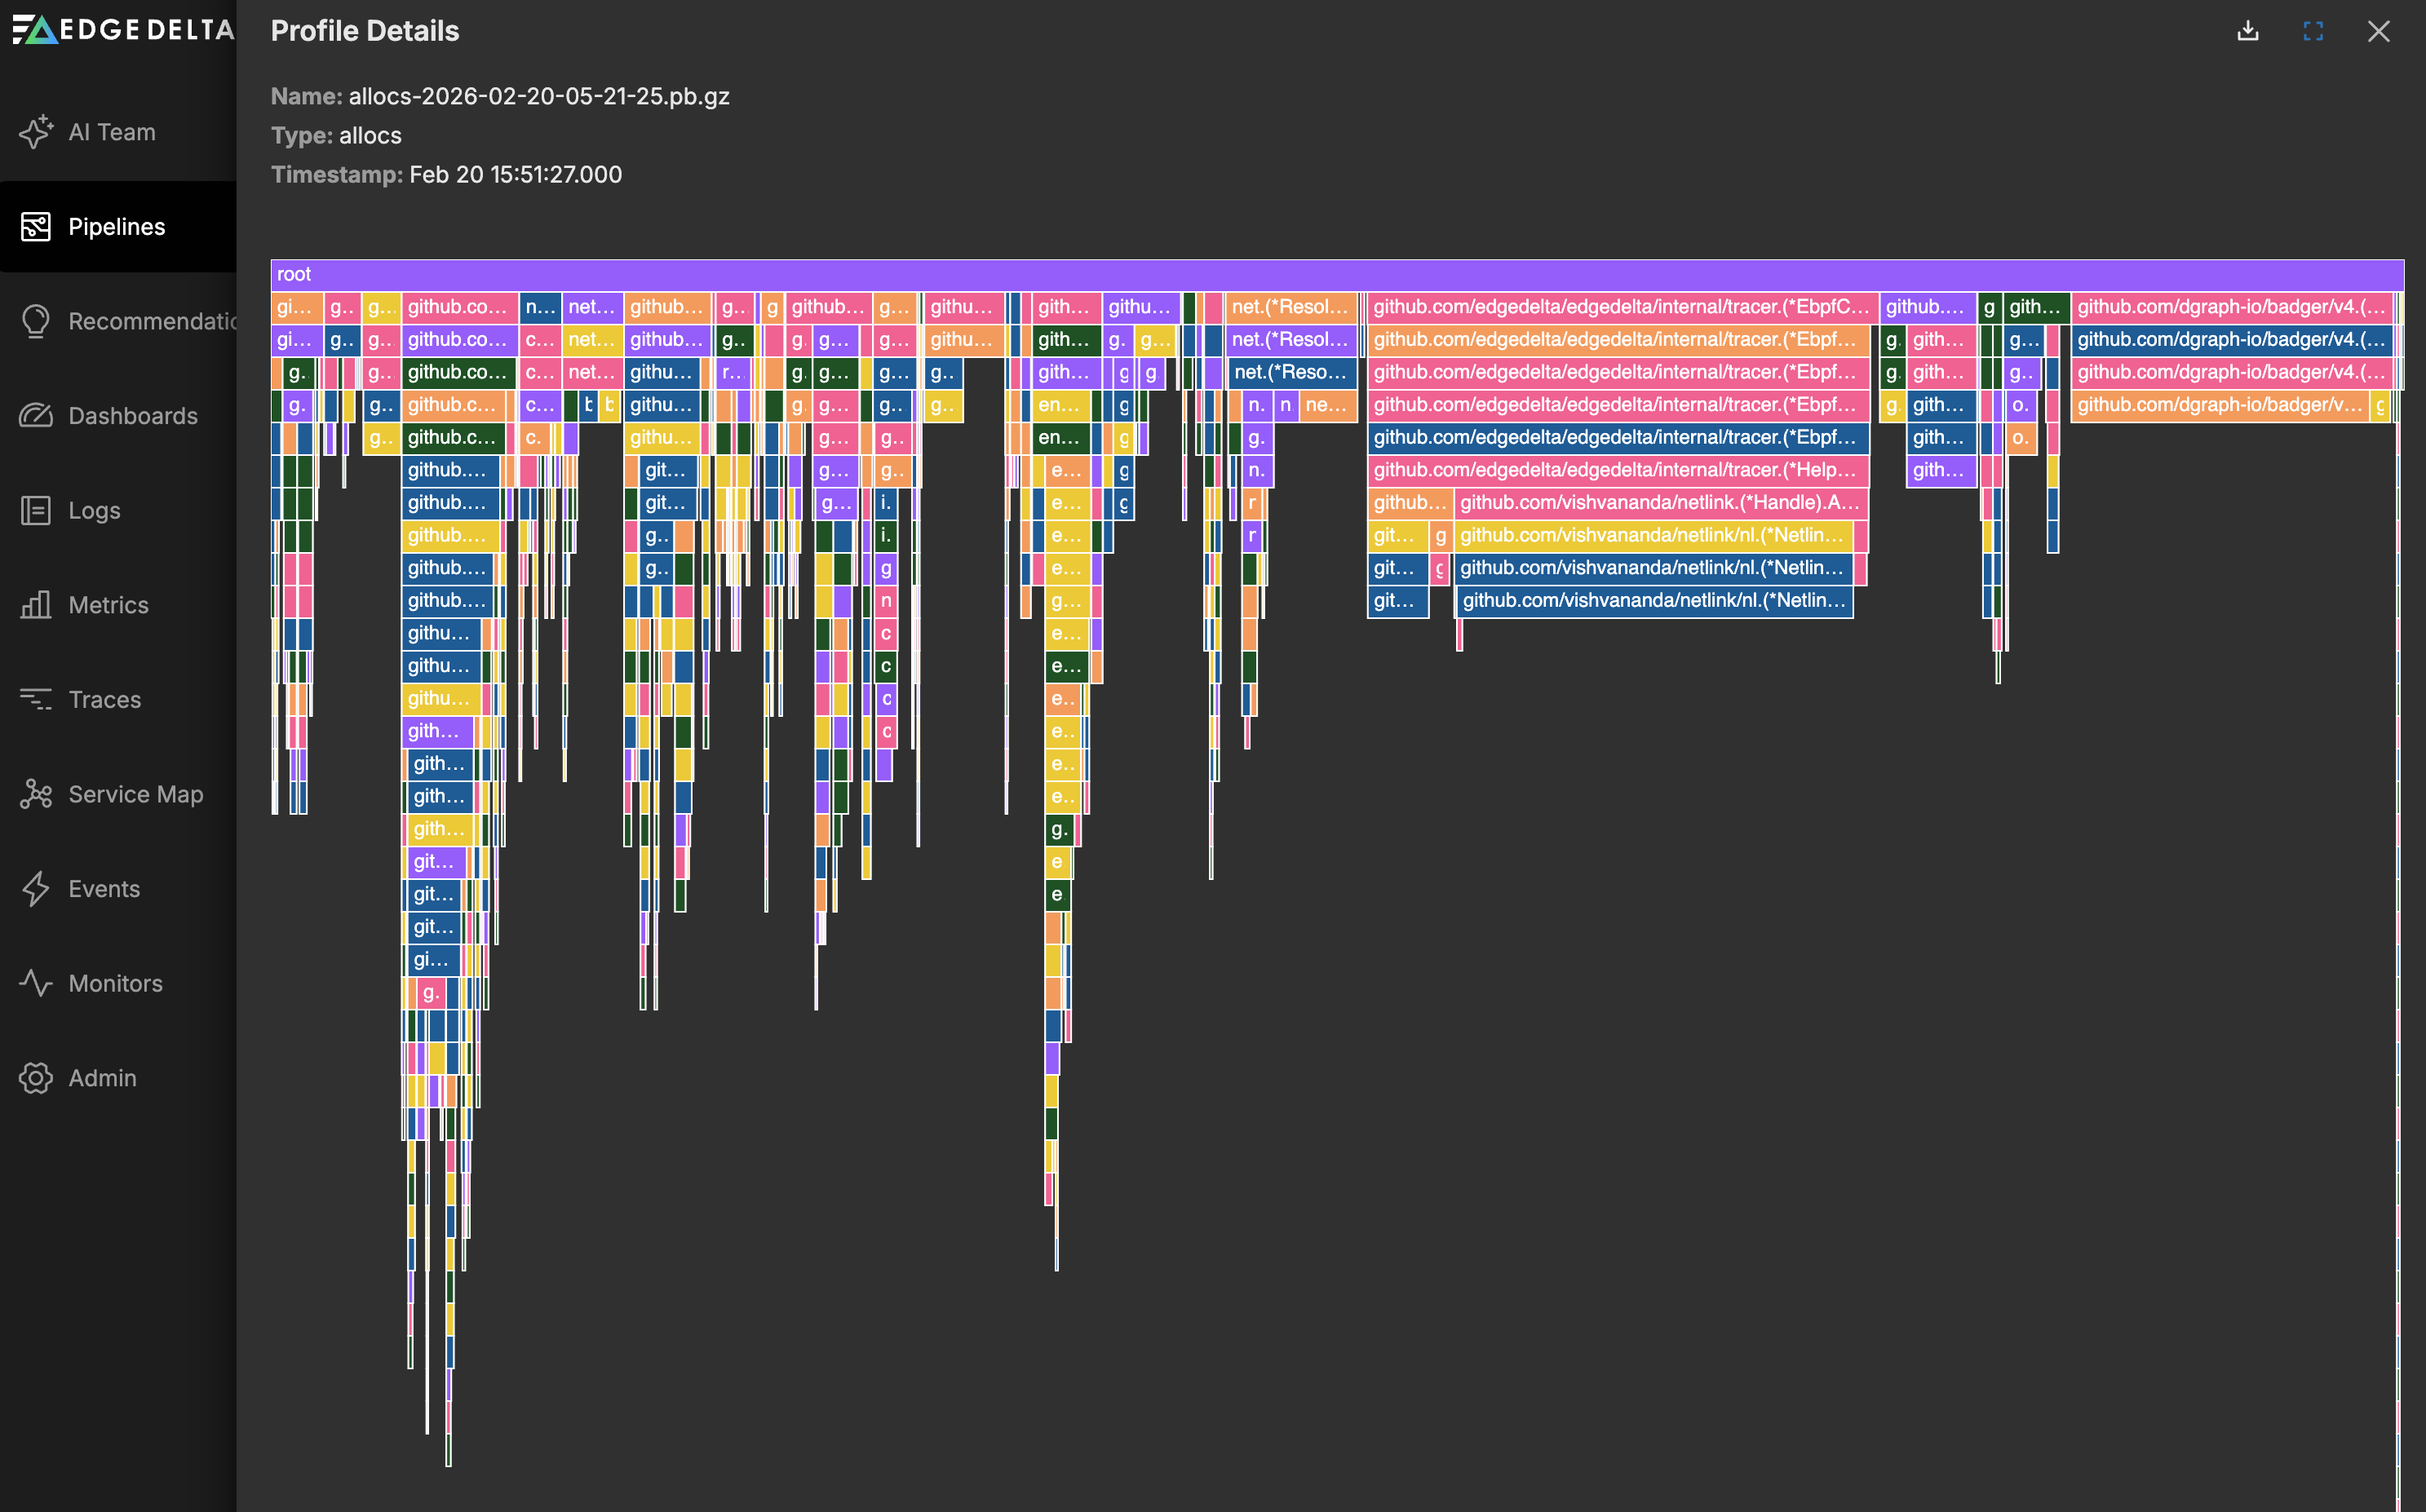
Interpret the Flame Graph
The graph indicates issues with the agent performance:
- For CPU flame graphs, hot code paths are wide, not tall.
- For Allocs, wide paths indicate a high alloc volume, while shallow and wide paths are potential targets for optimization.
- For Heap charts, wide blocks indicate higher memory usage. If they are also shallow this could indicate leaking or retaining memory too long. If the width increases across captures, this could indicate a memory leak or unbounded cache.
- For Goroutine charts, shallow and wide paths are lots of goroutines stuck at top level, indicating a potential goroutine leak or blocked start. Growth over time shows more goroutines doing the same work, indicating leaking goroutines or over-parallelization.
If you identify issues with the agents, contact support for assistance optimizing your pipeline configuration.