Send Alerts to Slack
5 minute read
Overview
Edge Delta can send alerts to Slack from pipeline threshold nodes or from centralized monitors. This guide covers pipeline-based alerting using either:
- Slack Destination Node: Simple configuration with automatic message formatting
- Webhook Destination with Block Kit: Rich, customizable message layouts
For centralized alerting, see Monitors and Send Events from Edge Delta Monitors to Slack.
Pipeline Flow
flowchart LR
classDef icon-metrics fill:#E7EEFC,stroke:#2563EB,color:#0F2169;
classDef icon-alert fill:#FDEAD7,stroke:#EA580C,color:#7C2D12;
classDef icon-destination fill:#FCEADB,stroke:#EA580C,color:#7C2D12;
classDef icon-notify fill:#EFE7FC,stroke:#7C3AED,color:#321059;
    Metrics[" Metric Source"]
    Threshold[" Threshold Node"]
    Slack[" Slack Destination"]
    Metrics --> Threshold
    Threshold --> Slack
class Metrics icon-metrics;
class Threshold icon-alert;
class Slack icon-notify;
Prepare Slack
Create a Slack app with an incoming webhook:
- Navigate to Slack API Apps
- Click Create New App → From scratch
- Name the app and select your Slack workspace
- Click Create App
- Click Incoming Webhooks and enable them
- Click Add New Webhook to Workspace
- Select a channel for notifications and click Allow
- Copy the webhook URL (format:
https://hooks.slack.com/services/T00000000/B00000000/XXXXXXXXXXXXXXXXXXXXXXXX)
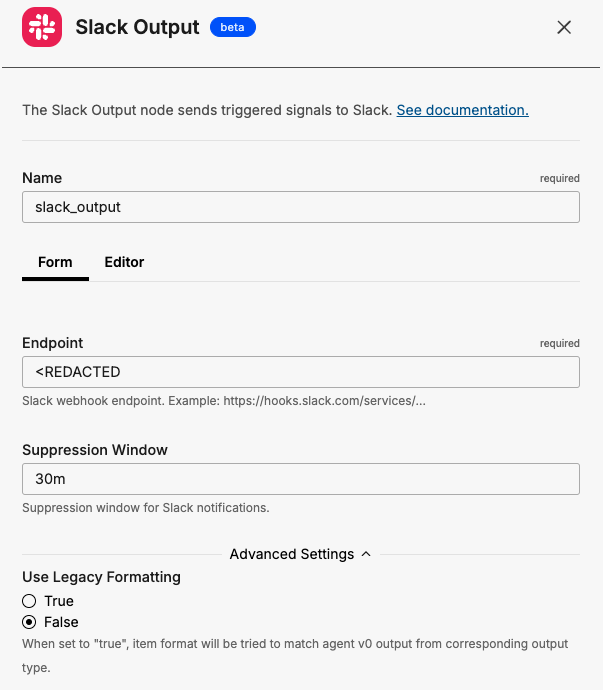
Option 1: Slack Destination Node
The Slack destination node provides automatic message formatting with signal data.
Configure in the UI
- Click Pipelines and select your pipeline
- Click Edit Mode → Add Node
- Select Slack Destination
- Enter the webhook URL from your Slack app
- Set a suppression window (e.g.,
20m) to prevent flooding - Connect the node to a threshold node
Example Configuration
nodes:
- name: kubernetes_logs
  type: kubernetes_input
  include:
  - k8s.deployment.name=myapp

- name: extract_and_aggregate
  type: sequence
  processors:
  - type: extract_metric
    keep_item: true
    data_types:
    - log
    extract_metric_rules:
    - name: error-logs
      unit: "1"
      conditions:
      - IsMatch(body, "error")
      gauge:
        value: "1"
  - type: aggregate_metric
    data_types:
    - metric
    aggregate_metric_rules:
    - name: error-logs-per-minute
      conditions:
      - name == "error-logs"
      interval: 1m0s
      aggregation_type: count
      group_by:
      - resource
      - attributes

- name: error_threshold
  type: threshold
  condition: value > 5
  filter: item.name == "error-logs-per-minute"

- name: slack_output
  type: slack_output
  endpoint: https://hooks.slack.com/services/T00000000/B00000000/XXXXXXXXXXXXXXXXXXXXXXXX
  suppression_window: 20m0s

links:
- from: kubernetes_logs
  to: extract_and_aggregate
- from: extract_and_aggregate
  to: error_threshold
- from: error_threshold
  to: slack_output
Example Output
The Slack destination automatically formats signal data:
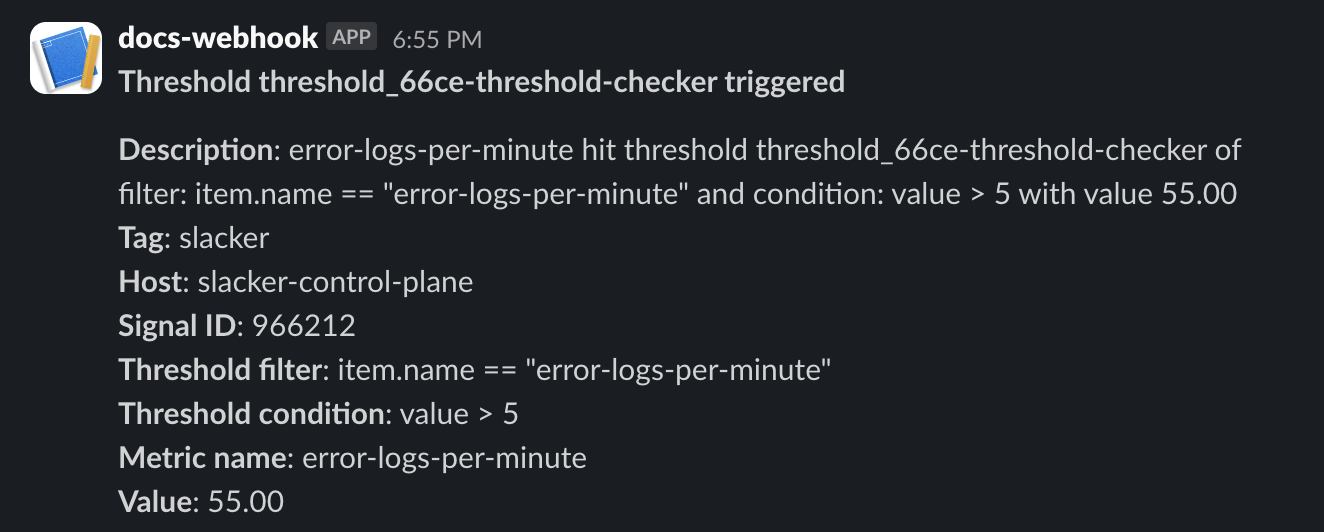
The message includes resource and attribute data from the signal:
{
  "_type": "signal",
  "signal": {
    "description": "error-logs-per-minute hit threshold with value 55.00",
    "name": "error-logs-per-minute",
    "signal_id": "111022",
    "title": "Threshold triggered",
    "value": 55
  },
  "resource": {
    "host.name": "node-01",
    "k8s.namespace.name": "production",
    "k8s.pod.name": "myapp-abc123"
  }
}
Option 2: Webhook Destination with Block Kit
For rich, customizable message layouts, use the webhook destination with Slack’s Block Kit.
Block Kit Configuration
- name: slack_alerts
  type: webhook_output
  endpoint: https://hooks.slack.com/services/${SLACK_WEBHOOK_PATH}
  headers:
  - header: Content-Type
    value: "application/json"
  suppression_window: 10m
  payload: |
    {
      "text": "EdgeDelta Alert: {{ .item.signal.title }}",
      "blocks": [
        {
          "type": "header",
          "text": {
            "type": "plain_text",
            "text": "{{ .item.signal.title }}",
            "emoji": true
          }
        },
        {
          "type": "section",
          "fields": [
            {
              "type": "mrkdwn",
              "text": "*Host:*\n{{ index .item.resource \"host.name\" }}"
            },
            {
              "type": "mrkdwn",
              "text": "*Source:*\n{{ index .item.resource \"ed.source_name\" }}"
            },
            {
              "type": "mrkdwn",
              "text": "*Current Value:*\n{{ .item.signal.value }}"
            },
            {
              "type": "mrkdwn",
              "text": "*Threshold:*\n{{ .item.signal.threshold_value }}"
            }
          ]
        },
        {
          "type": "section",
          "text": {
            "type": "mrkdwn",
            "text": "*Description:*\n{{ .item.signal.description }}"
          }
        },
        {
          "type": "context",
          "elements": [
            {
              "type": "mrkdwn",
              "text": "Signal ID: `{{ .item.signal.signal_id }}` | {{ .item.timestamp }}"
            }
          ]
        }
      ]
    }
Store the webhook path as an environment variable:
export SLACK_WEBHOOK_PATH="T00000000/B00000000/XXXXXXXXXXXXXXXXXXXXXXXX"
Block Kit Elements
| Block Type | Purpose | Example |
|---|---|---|
header | Main title of the message | Alert title |
section | Content with optional fields | Host, source, value details |
context | Secondary information in smaller text | Signal ID, timestamp |
divider | Visual separator between sections | Horizontal line |
actions | Interactive buttons | View, Acknowledge |
Adding Dividers
Insert dividers between sections:
{
  "type": "divider"
}
Adding Action Buttons
Include interactive buttons for incident response:
payload: |
  {
    "blocks": [
      ... existing blocks ...,
      {
        "type": "actions",
        "elements": [
          {
            "type": "button",
            "text": {
              "type": "plain_text",
              "text": "View in EdgeDelta"
            },
            "url": "https://app.edgedelta.com",
            "style": "primary"
          },
          {
            "type": "button",
            "text": {
              "type": "plain_text",
              "text": "Acknowledge"
            },
            "url": "https://your-ack-endpoint.com/ack?id={{ .item.signal.signal_id }}"
          }
        ]
      }
    ]
  }
Severity-Based Colors
Use conditional logic to adjust message colors based on alert severity:
payload: |
  {
    "text": "EdgeDelta Alert: {{ .item.signal.title }}",
    "attachments": [
      {
        "color": "{{ if gt .item.signal.value (mul .item.signal.threshold_value 2) }}#FF0000{{ else if gt .item.signal.value .item.signal.threshold_value }}#FFA500{{ else }}#36A64F{{ end }}",
        "blocks": [
          ... your blocks ...
        ]
      }
    ]
  }
Color mapping:
#FF0000(red): Critical - value exceeds 2x threshold#FFA500(orange): Warning - value exceeds threshold#36A64F(green): Normal
Testing
Validate Block Kit Payloads
Use Slack’s Block Kit Builder to preview your payload:
- Copy your JSON payload (substitute sample values for template variables)
- Paste into the Block Kit Builder
- Preview how it will render in Slack
- Adjust formatting as needed
Test with a Local Endpoint
Before connecting to Slack, test your payload structure:
endpoint: http://localhost:8080/webhook-test
Troubleshooting
| Issue | Solution |
|---|---|
| Message not appearing | Verify webhook URL and channel permissions |
| Formatting broken | Validate JSON syntax in Block Kit Builder |
invalid_blocks error | Check Block Kit schema compliance |
no_text error | Ensure top-level text field is present (required for Block Kit) |
| Rate limited | Increase suppression window |
| Duplicate messages | Verify suppression window is set |
Best Practices
- Use suppression windows: Prevent channel flooding with 10-30 minute windows
- Always include fallback text: The top-level
textfield appears in notifications and accessibility tools - Keep blocks concise: Slack has a 50-block limit per message
- Test formatting: Use Block Kit Builder before deploying
- Store credentials securely: Use environment variables for webhook paths
- Choose the right destination: Use Slack destination for simple alerts, webhook destination for customized layouts
See Also
- Webhook Destination - Full webhook reference
- Slack Destination - Slack destination node reference
- Trigger a Metric Threshold - Configure threshold alerts
- Pipeline Triggers - Overview of edge-based alerting