Send Events from Edge Delta Monitors to Slack
3 minute read
Overview
You can configure Edge Delta to send alerts to Slack. They can originate from either the edge within a pipeline configuration, or they can originate from a centralized monitor. See Monitors for an overview of centralized alerting, or see Pipeline Triggers for edge-based alerts. Also see Send Events from an Edge Delta Pipeline to Slack for configuring the edge.
Prepare Slack
You need to create a Slack app and configure it with an incoming webhook to receive notifications from Edge Delta.
- Navigate and log in to Your Apps on the Slack API website:
https://api.slack.com/apps. - Click Create New App.
- Select From scratch.
- Name the app and select your Slack workspace.
- Click Create App.
- Click Incoming Webhooks and select Activate Incoming Webhooks.
- Click Add New Webhook.
- Select a channel you want the app to post notifications to and click Allow.
- Copy the webhook URL
Send Events from Monitors
With the Slack app configured, you can trigger notifications from monitors.
To send a notification from a monitor to Slack, you need to first configure a Slack Integration.
- In Edge Delta, click Admin.
- Click Legacy Integrations.
- Click Available.
- Search for and select Slack.
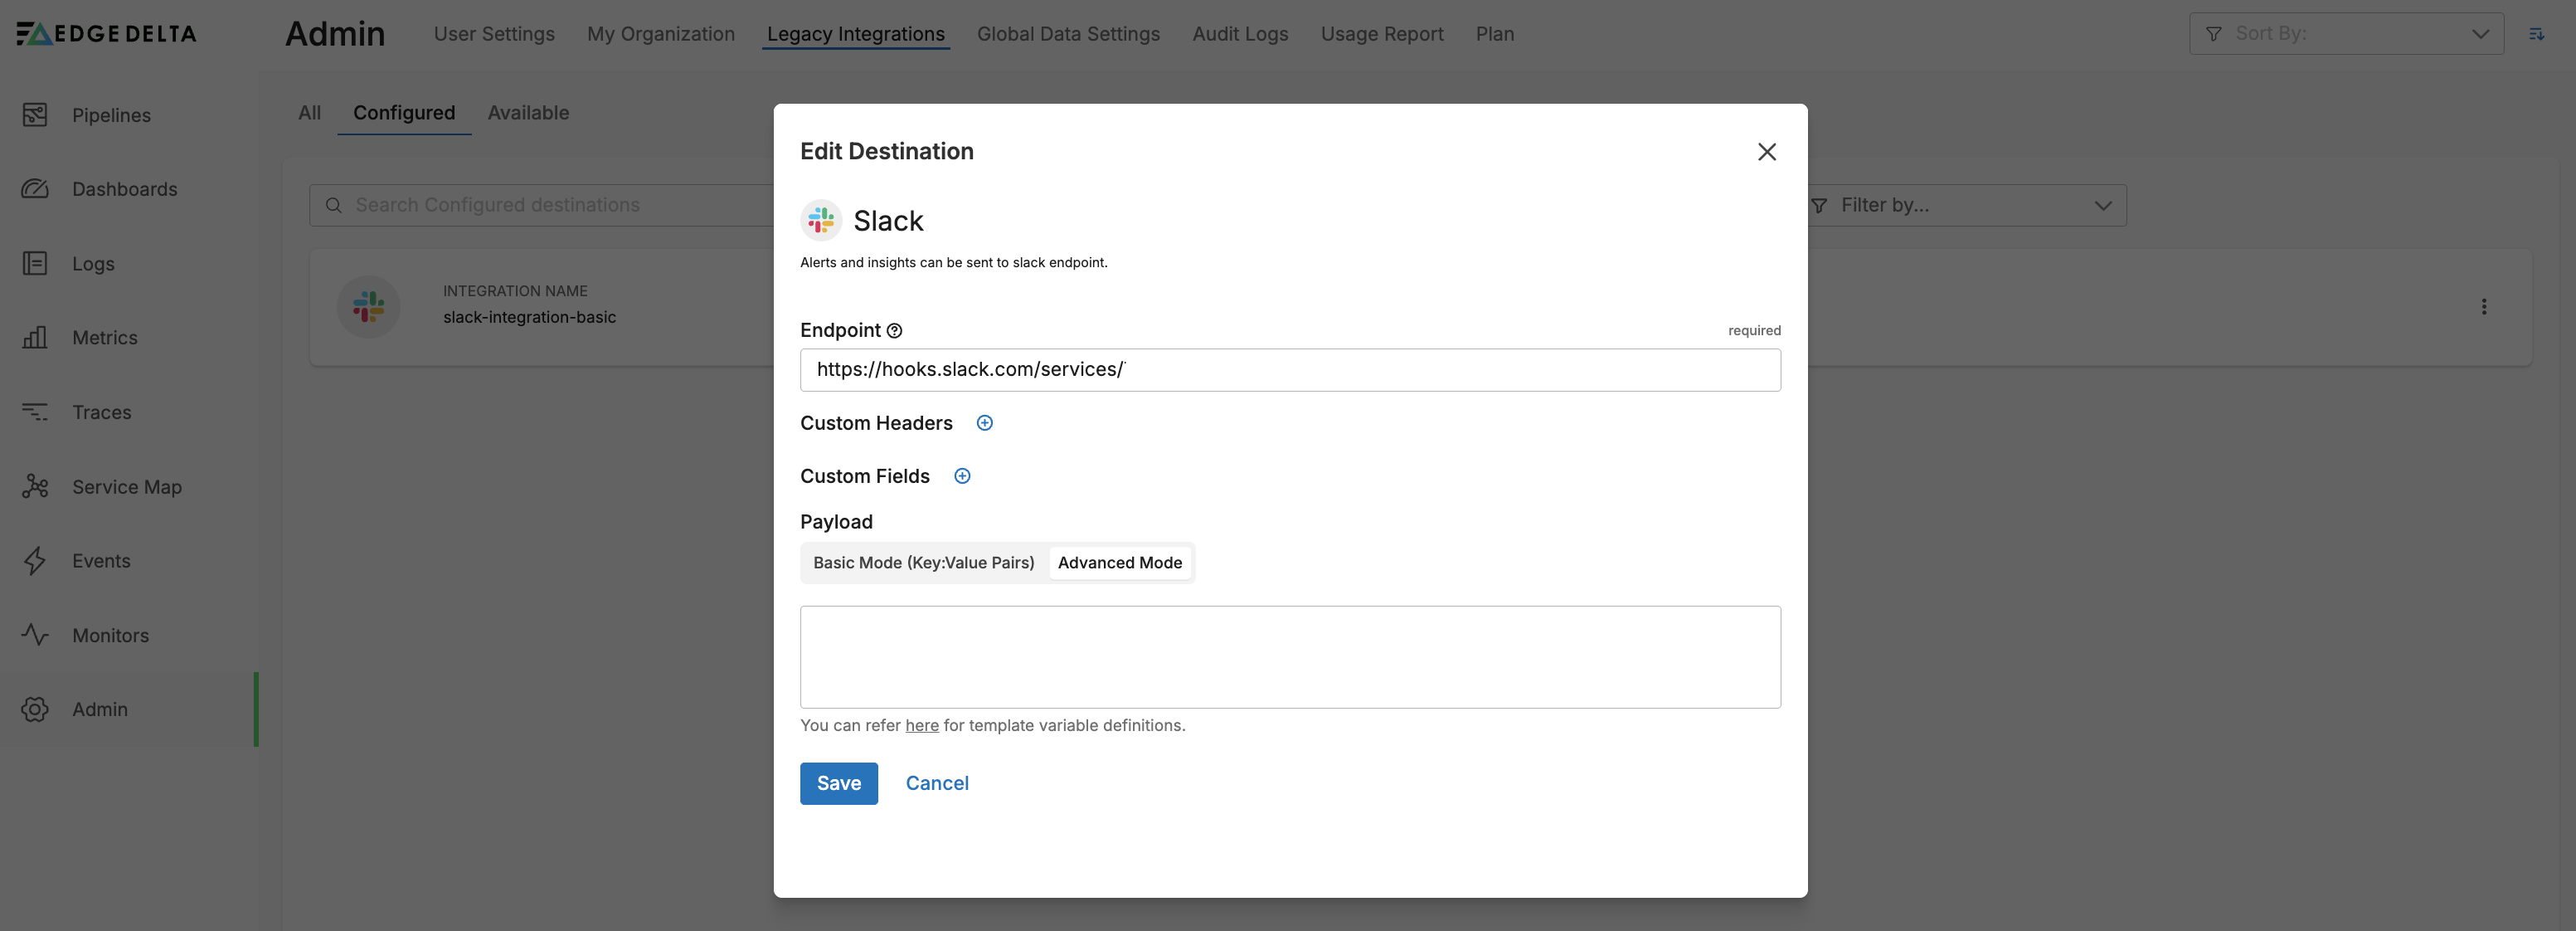
- Enter a name for the integration.
- Enter the webhook URL you copied earlier as the endpoint.
- Leave the other fields blank and click Save.
Next you configure a monitor. In this example, a metric threshold monitor will be configured. It will monitor a metric generated in the node pipelines called error-logs-per-minute, which counts the number of error logs per minute, across all pipelines.
While configuring the Notifications section, you type @ and use autocomplete to select the Slack integration you created earlier.
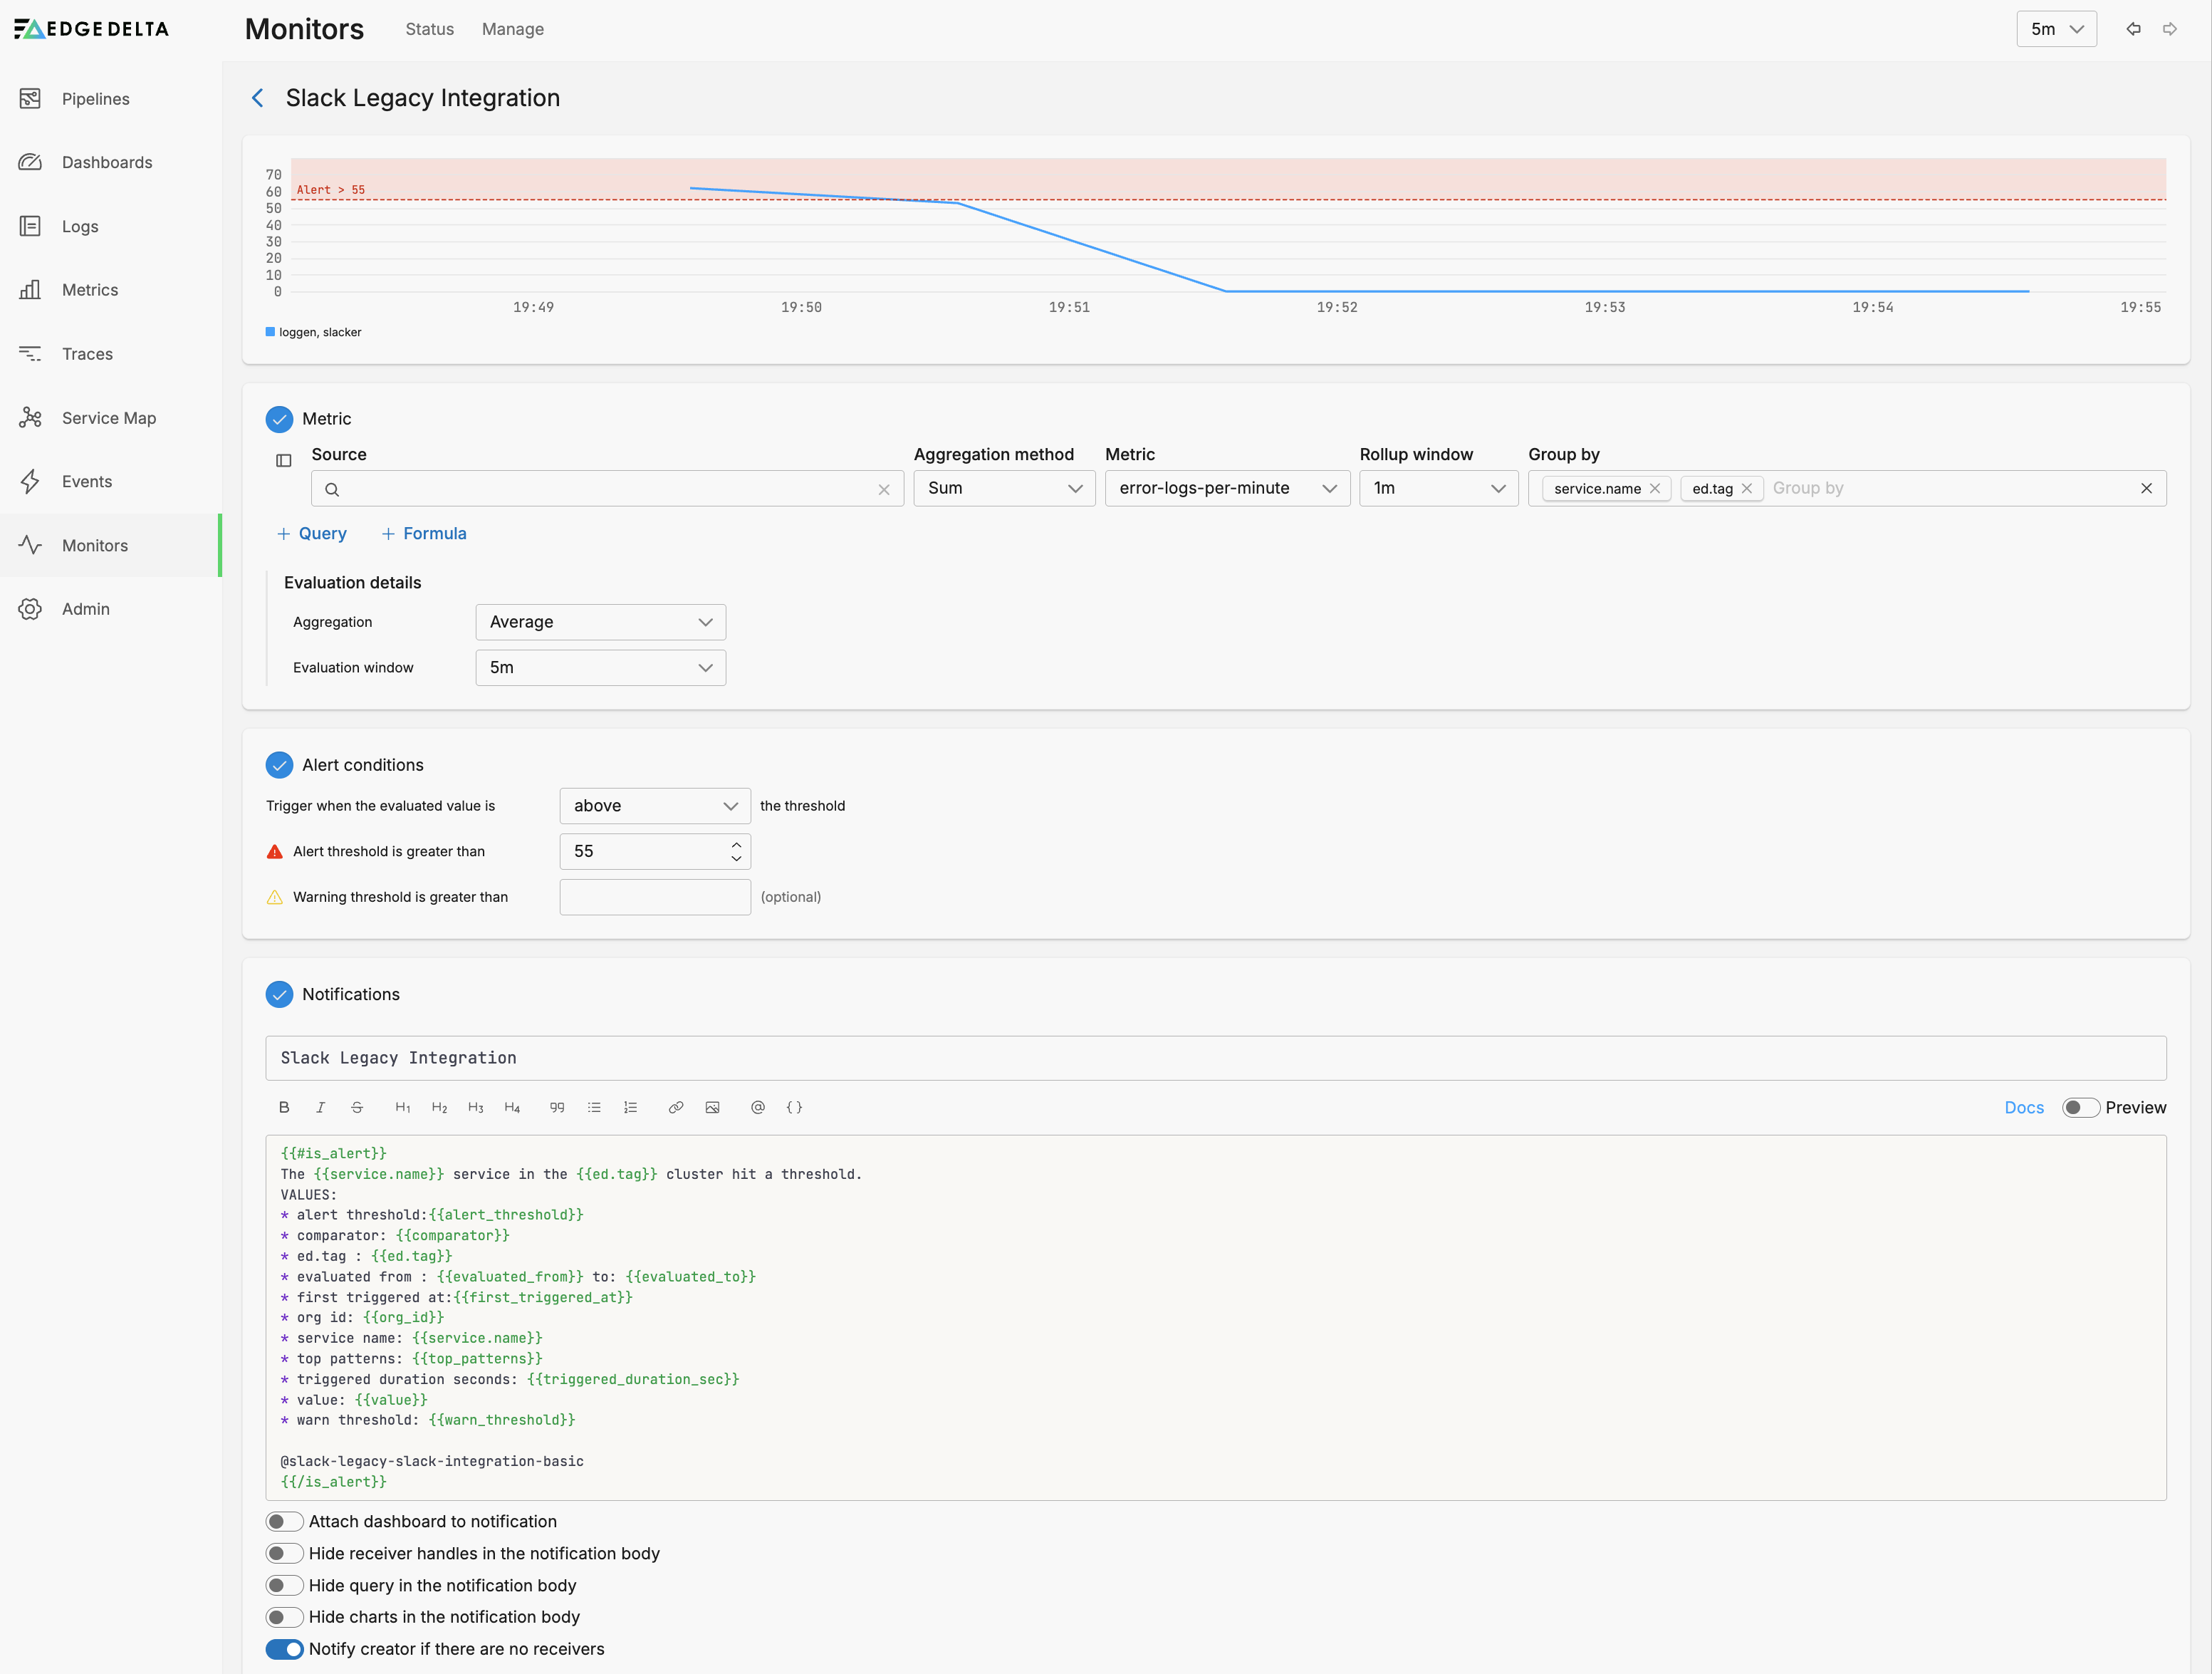
In this instance, a number of notification values are specified along with the Slack destination:
{{#is_alert}}
The {{service.name}} service in the {{ed.tag}} cluster hit a threshold.
VALUES:
* alert threshold:{{alert_threshold}}
* comparator: {{comparator}}
* ed.tag : {{ed.tag}}
* evaluated from : {{evaluated_from}} to: {{evaluated_to}}
* first triggered at:{{first_triggered_at}}
* org id: {{org_id}}
* service name: {{service.name}}
* top patterns: {{top_patterns}}
* triggered duration seconds: {{triggered_duration_sec}}
* value: {{value}}
* warn threshold: {{warn_threshold}}

@slack-legacy-slack-integration-basic
{{/is_alert}}
When the monitor generates an event, it sends an alert to Slack. The event itself can be seen in the Monitor Events page:
{
  "timestamp": 1749031618893,
  "event_domain": "Monitor Alerts",
  "event_type": "metric_threshold",
  "severity_text": "ALERT",
  "body": "Slack Legacy Integration for ed.tag:slacker,service.name:loggen",
  "resource": {
    "ed.monitor.id": "2y2B1q3XZrvz0rOZuLLxVaneU4T",
    "event.name": "Slack Legacy Integration",
    "service.name": "loggen"
  },
  "attributes": {
    "ed.monitor.evaluated.from": "2025-06-04T09:58:00.000Z",
    "ed.monitor.evaluated.to": "2025-06-04T10:03:00.000Z",
    "ed.monitor.evaluated.value": "55.60",
    "ed.monitor.group.id": "MhdBMl8aEW+QxHRoRtBZVWDLNTiD0sIyojWPRoOtV+o=",
    "ed.monitor.group.name": "ed.tag:slacker,service.name:loggen",
    "ed.monitor.notification.message": "**error-logs-per-minute** for **ed.tag:slacker,service.name:loggen** **>** **55** **avg** within the last **5m0s** evaluated from **2025-06-04T09:58:00.000Z** to **2025-06-04T10:03:00.000Z**.\n The monitor was last triggered at **2025-06-04T10:06:58.893Z**",
    "ed.monitor.observation.url": "https://app.edgedelta.com/metrics/explorer?query=sum:error-logs-per-minute{ed.tag:\"slacker\" AND service.name:\"loggen\"}&from=2025-06-04T09:43:00.000Z&to=2025-06-04T10:03:00.000Z",
    "ed.monitor.priority": "NOT DEFINED",
    "ed.monitor.query": "sum:error-logs-per-minute{*} by {service.name,ed.tag}.rollup(60)",
    "ed.monitor.screenshot.url": "https://p.edgedelta.com/d27fe6c2-5fc5-4ef8-8750-e1feaf94daa3/plots/2025-06-04/1cb4ed87-5607-483a-99af-69b7b8da7be5.png",
    "ed.monitor.type": "metric_threshold",
    "event.id": "2y2TNDdF0aKe5ijl8bfhoirPIKR"
  }
}
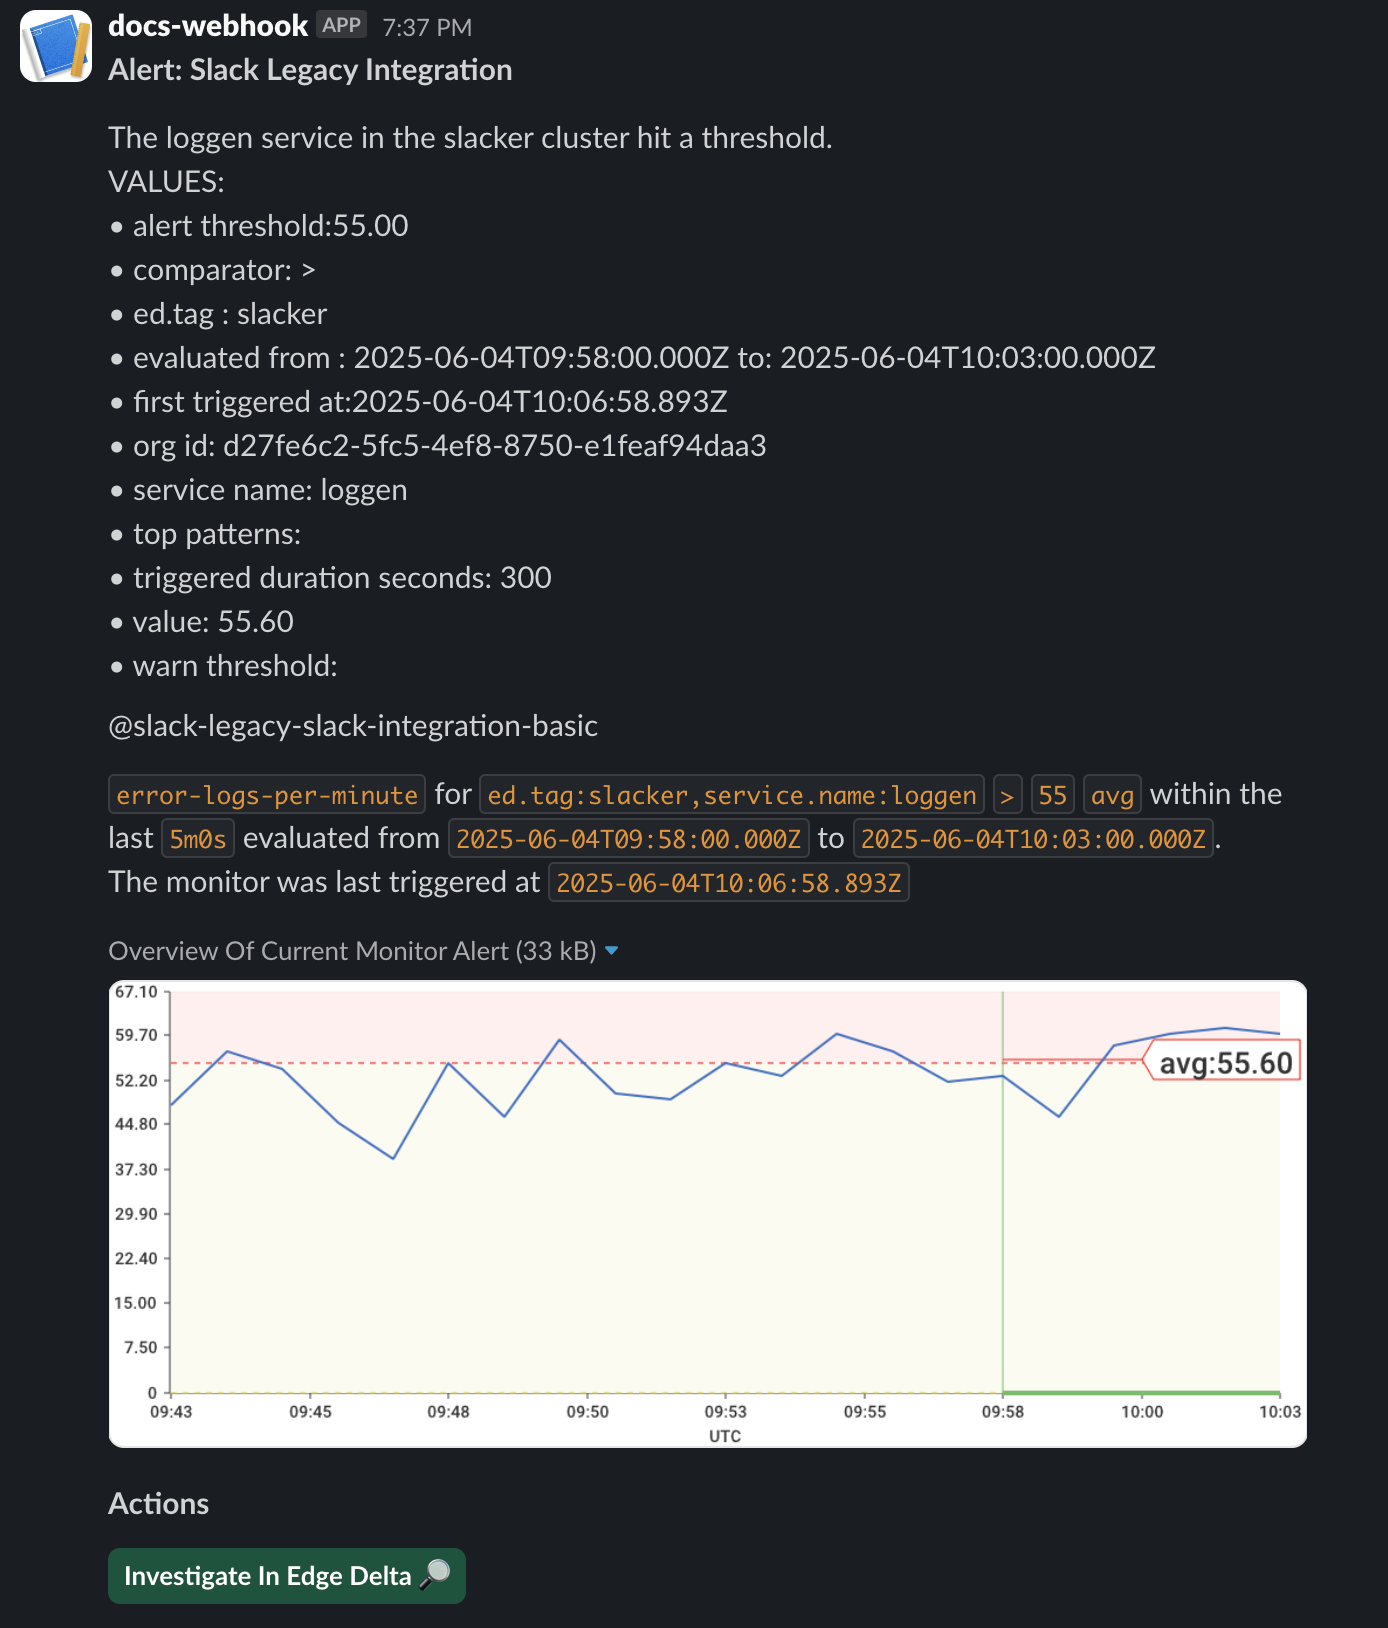
In Slack, the message appears along with the monitor values populated where possible: