Pipeline Quickstart: Filter Data Items
3 minute read
Overview
This is the second step in the Pipeline Quickstart guide. In the previous step, you learned how to Add a Telemetry Generator Node.
In this section, you start to configure the processor that is attached to to the Telemetry Generator.
To start, you exclude any log with a low severity keyword in the body:
debuginfotracenotice
1. Open the Processor
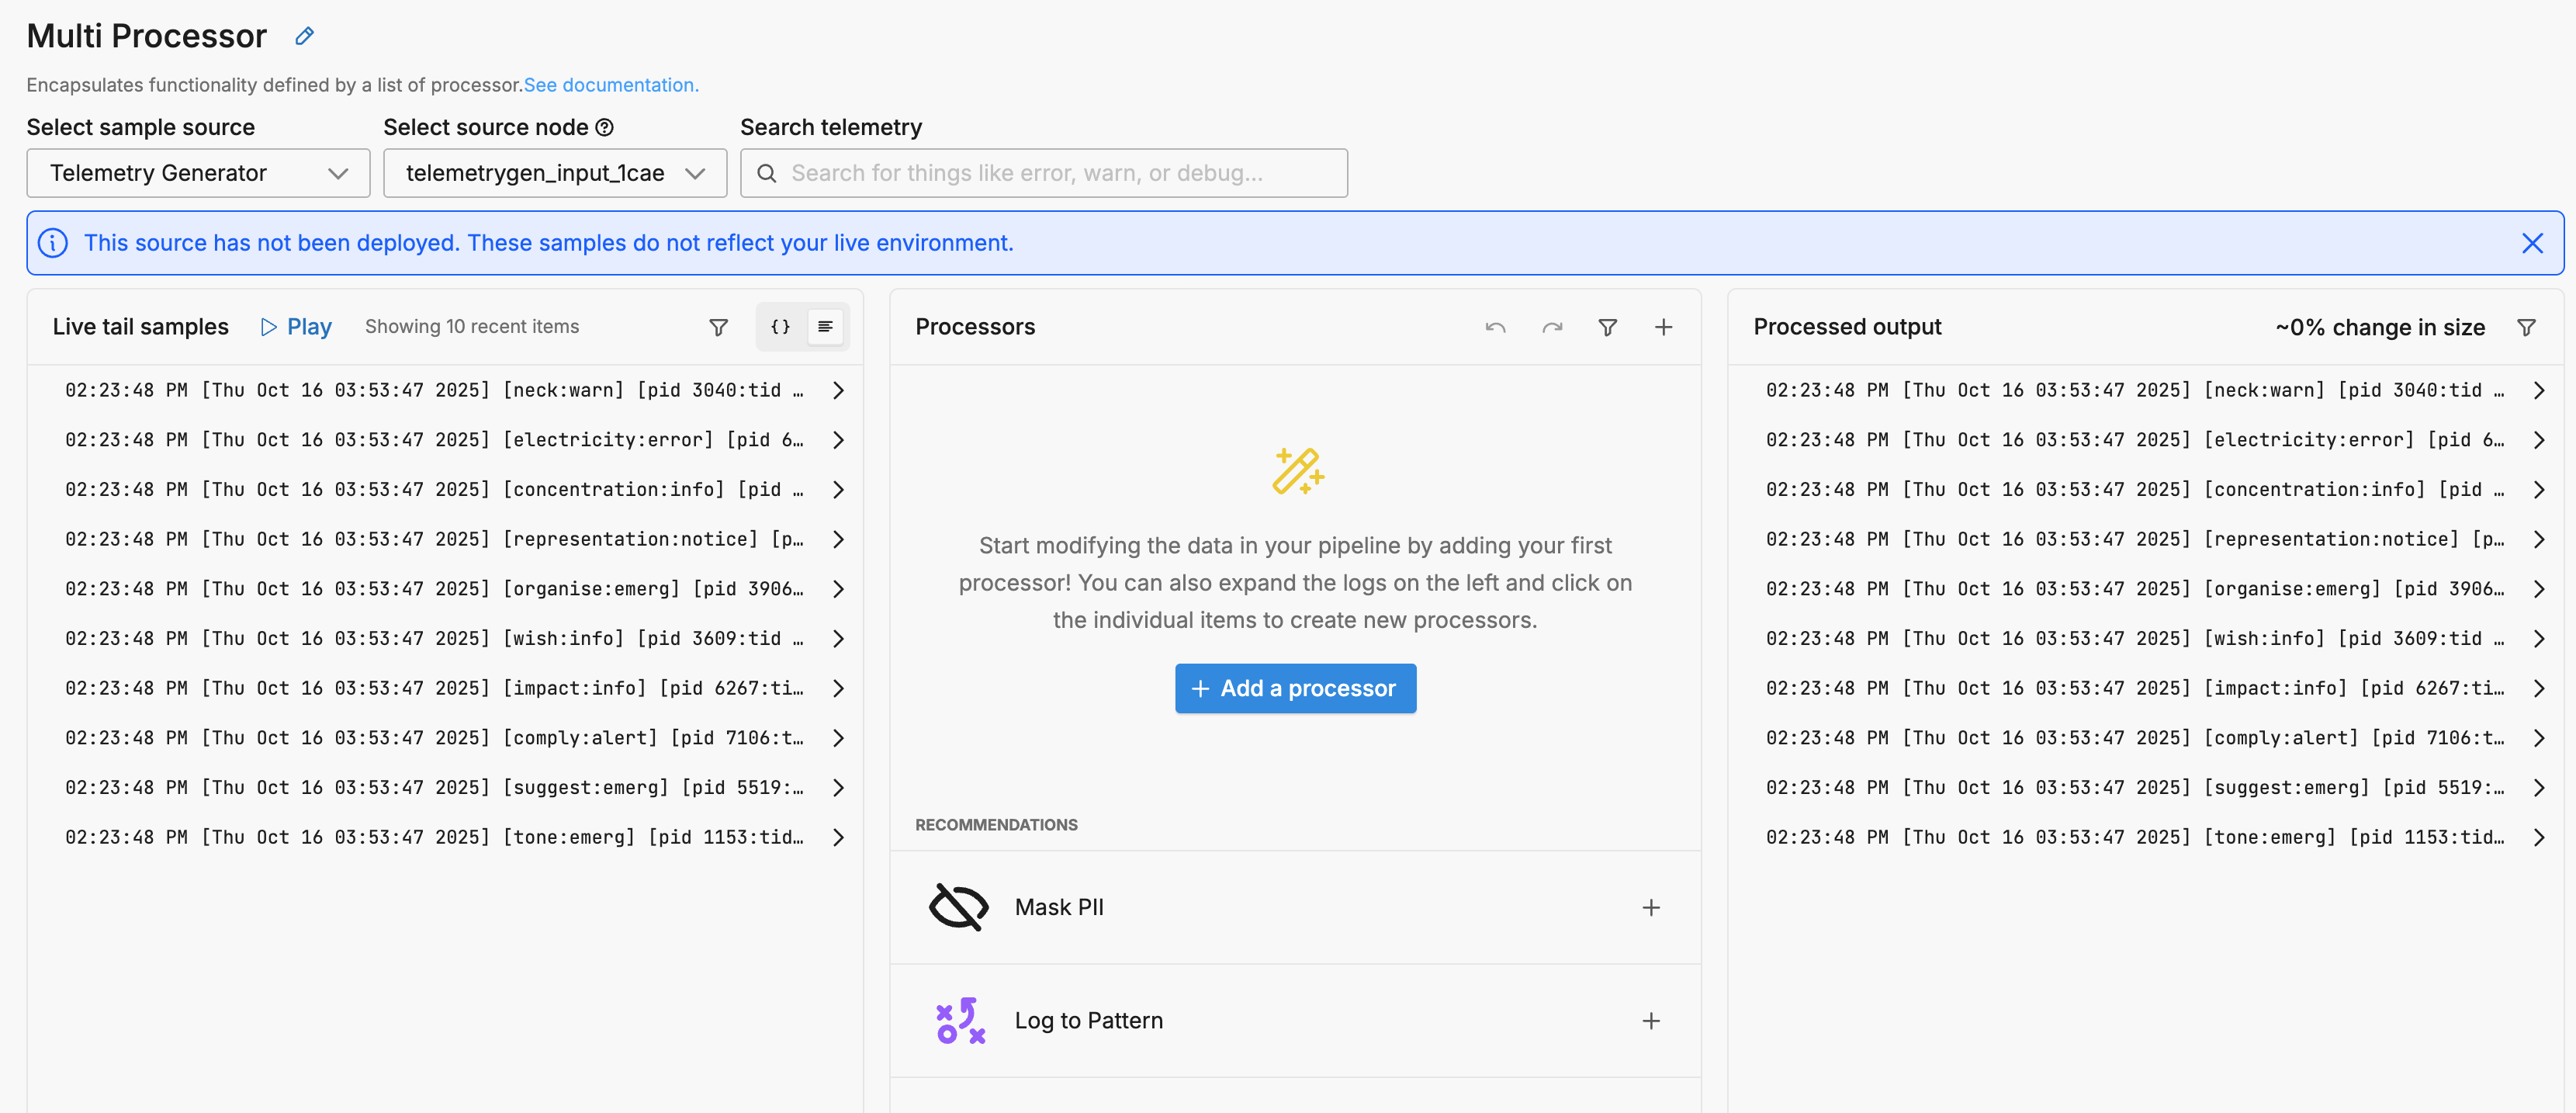
Double-click the processor attached to the Telemetry Generator.
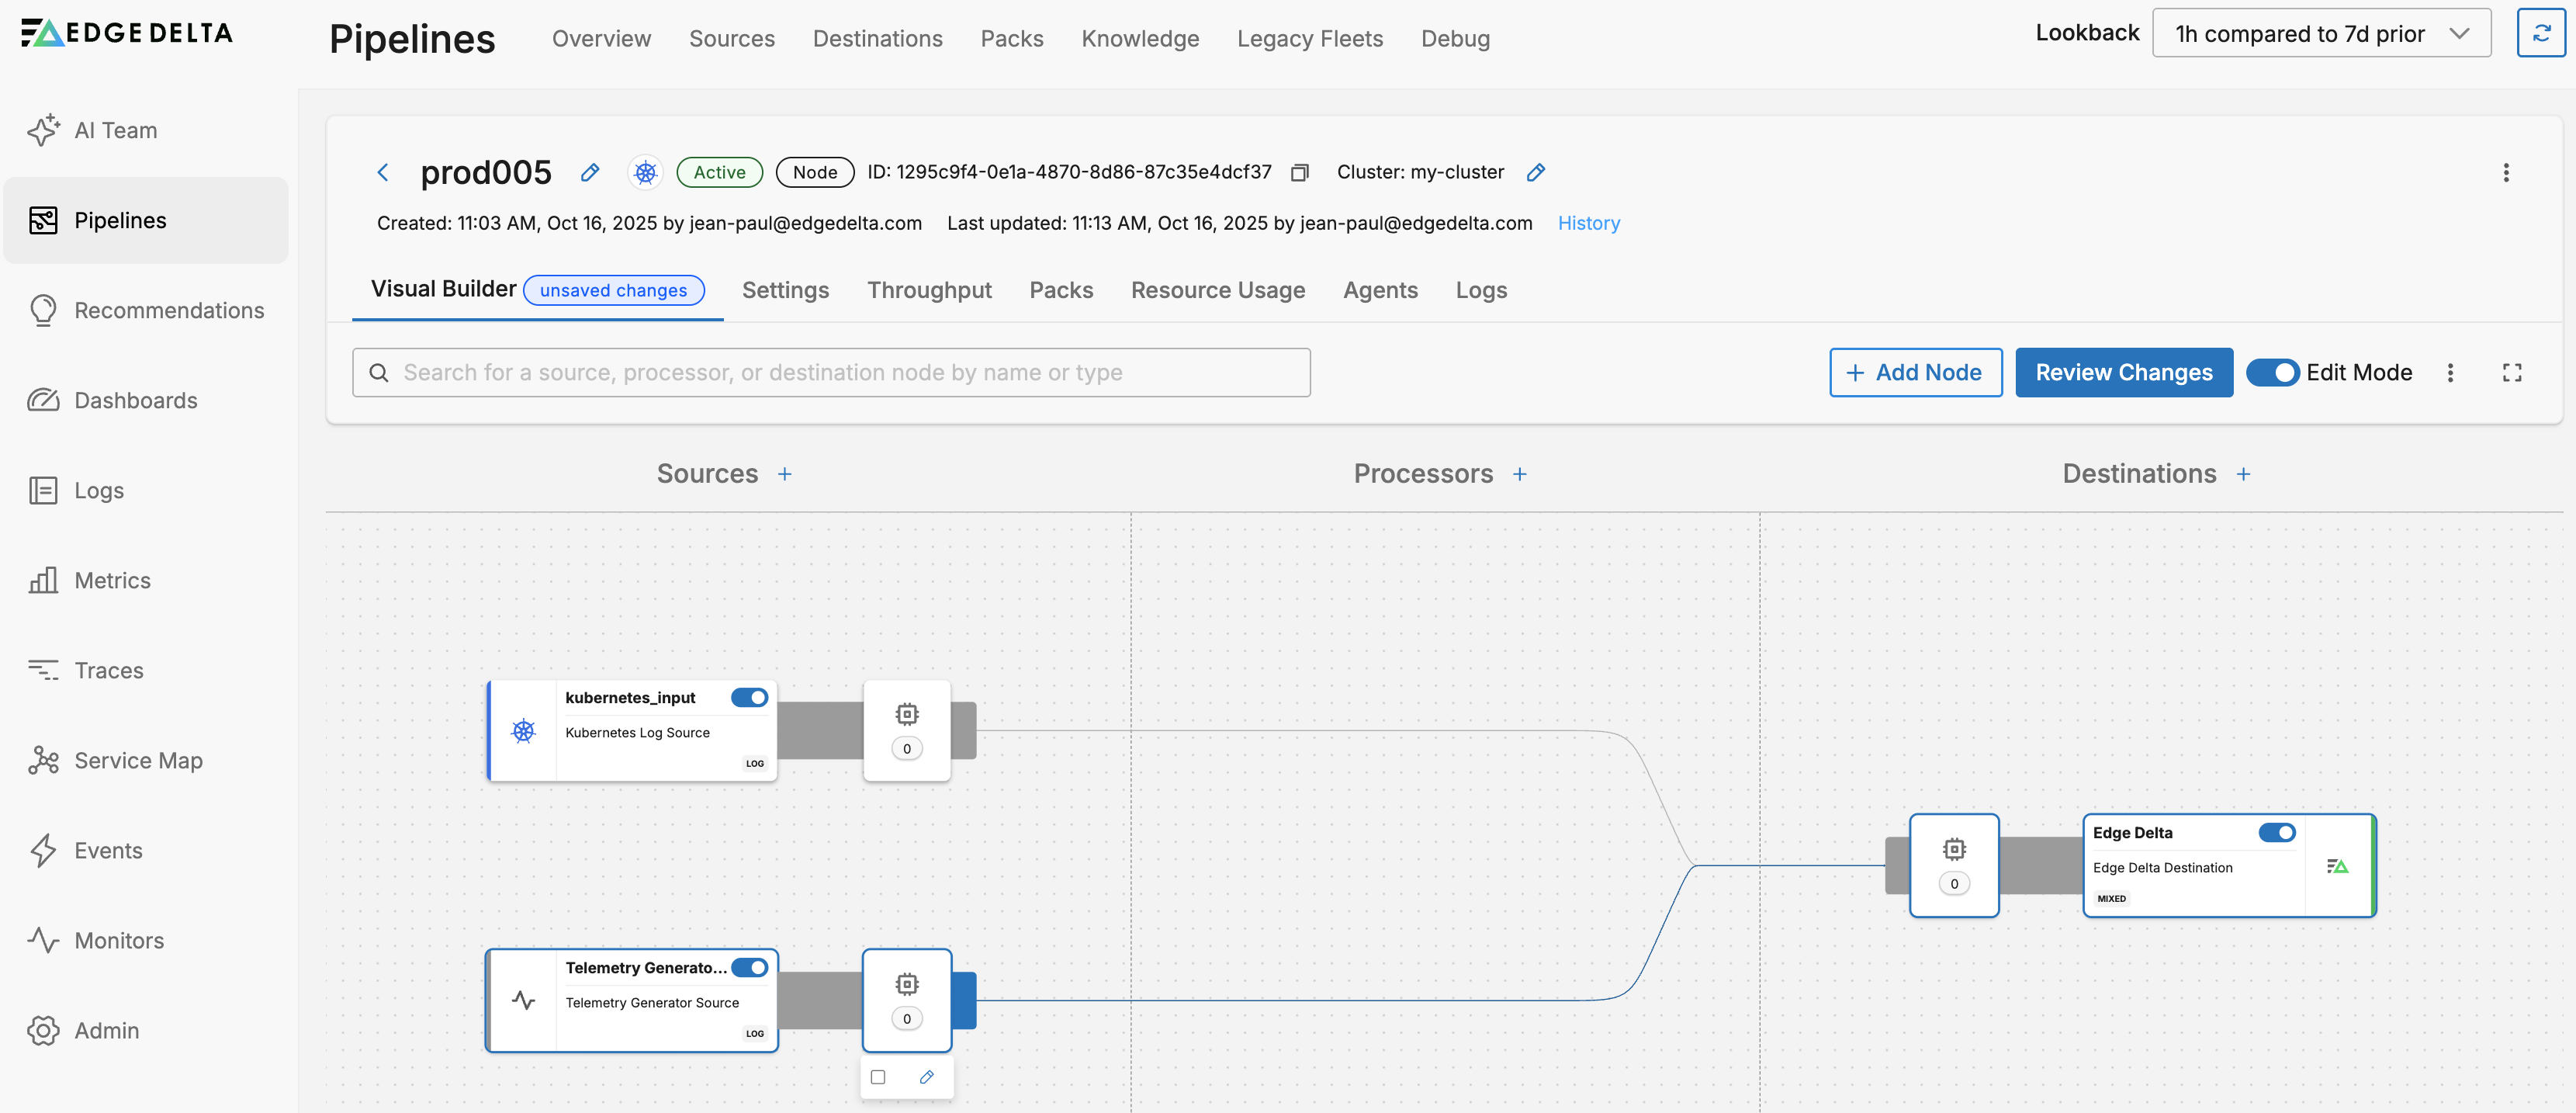
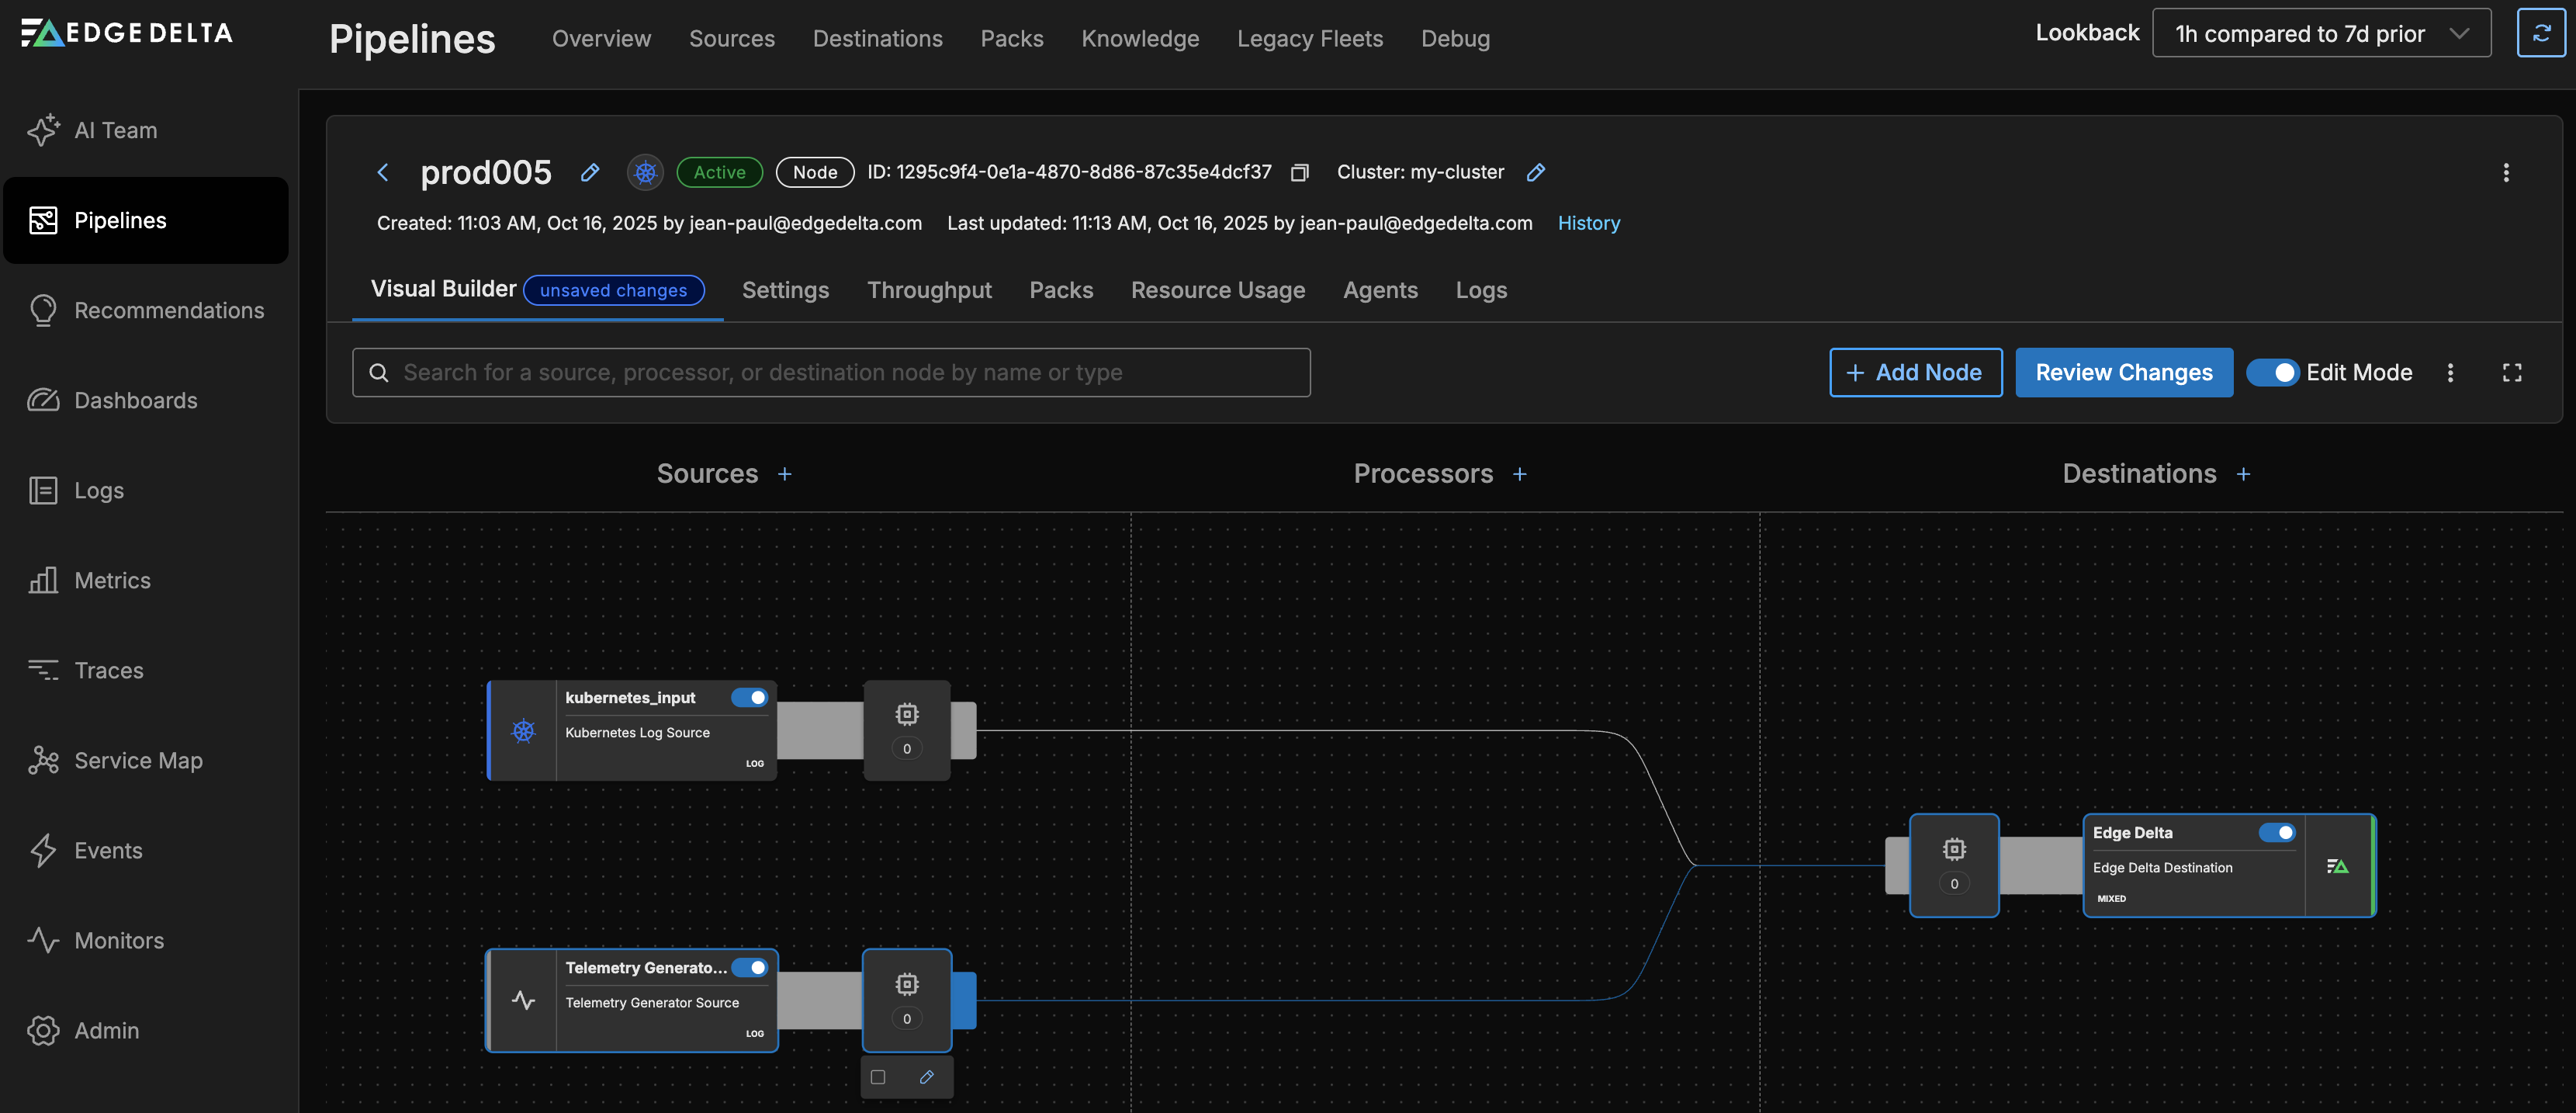
The processor configuration page opens.
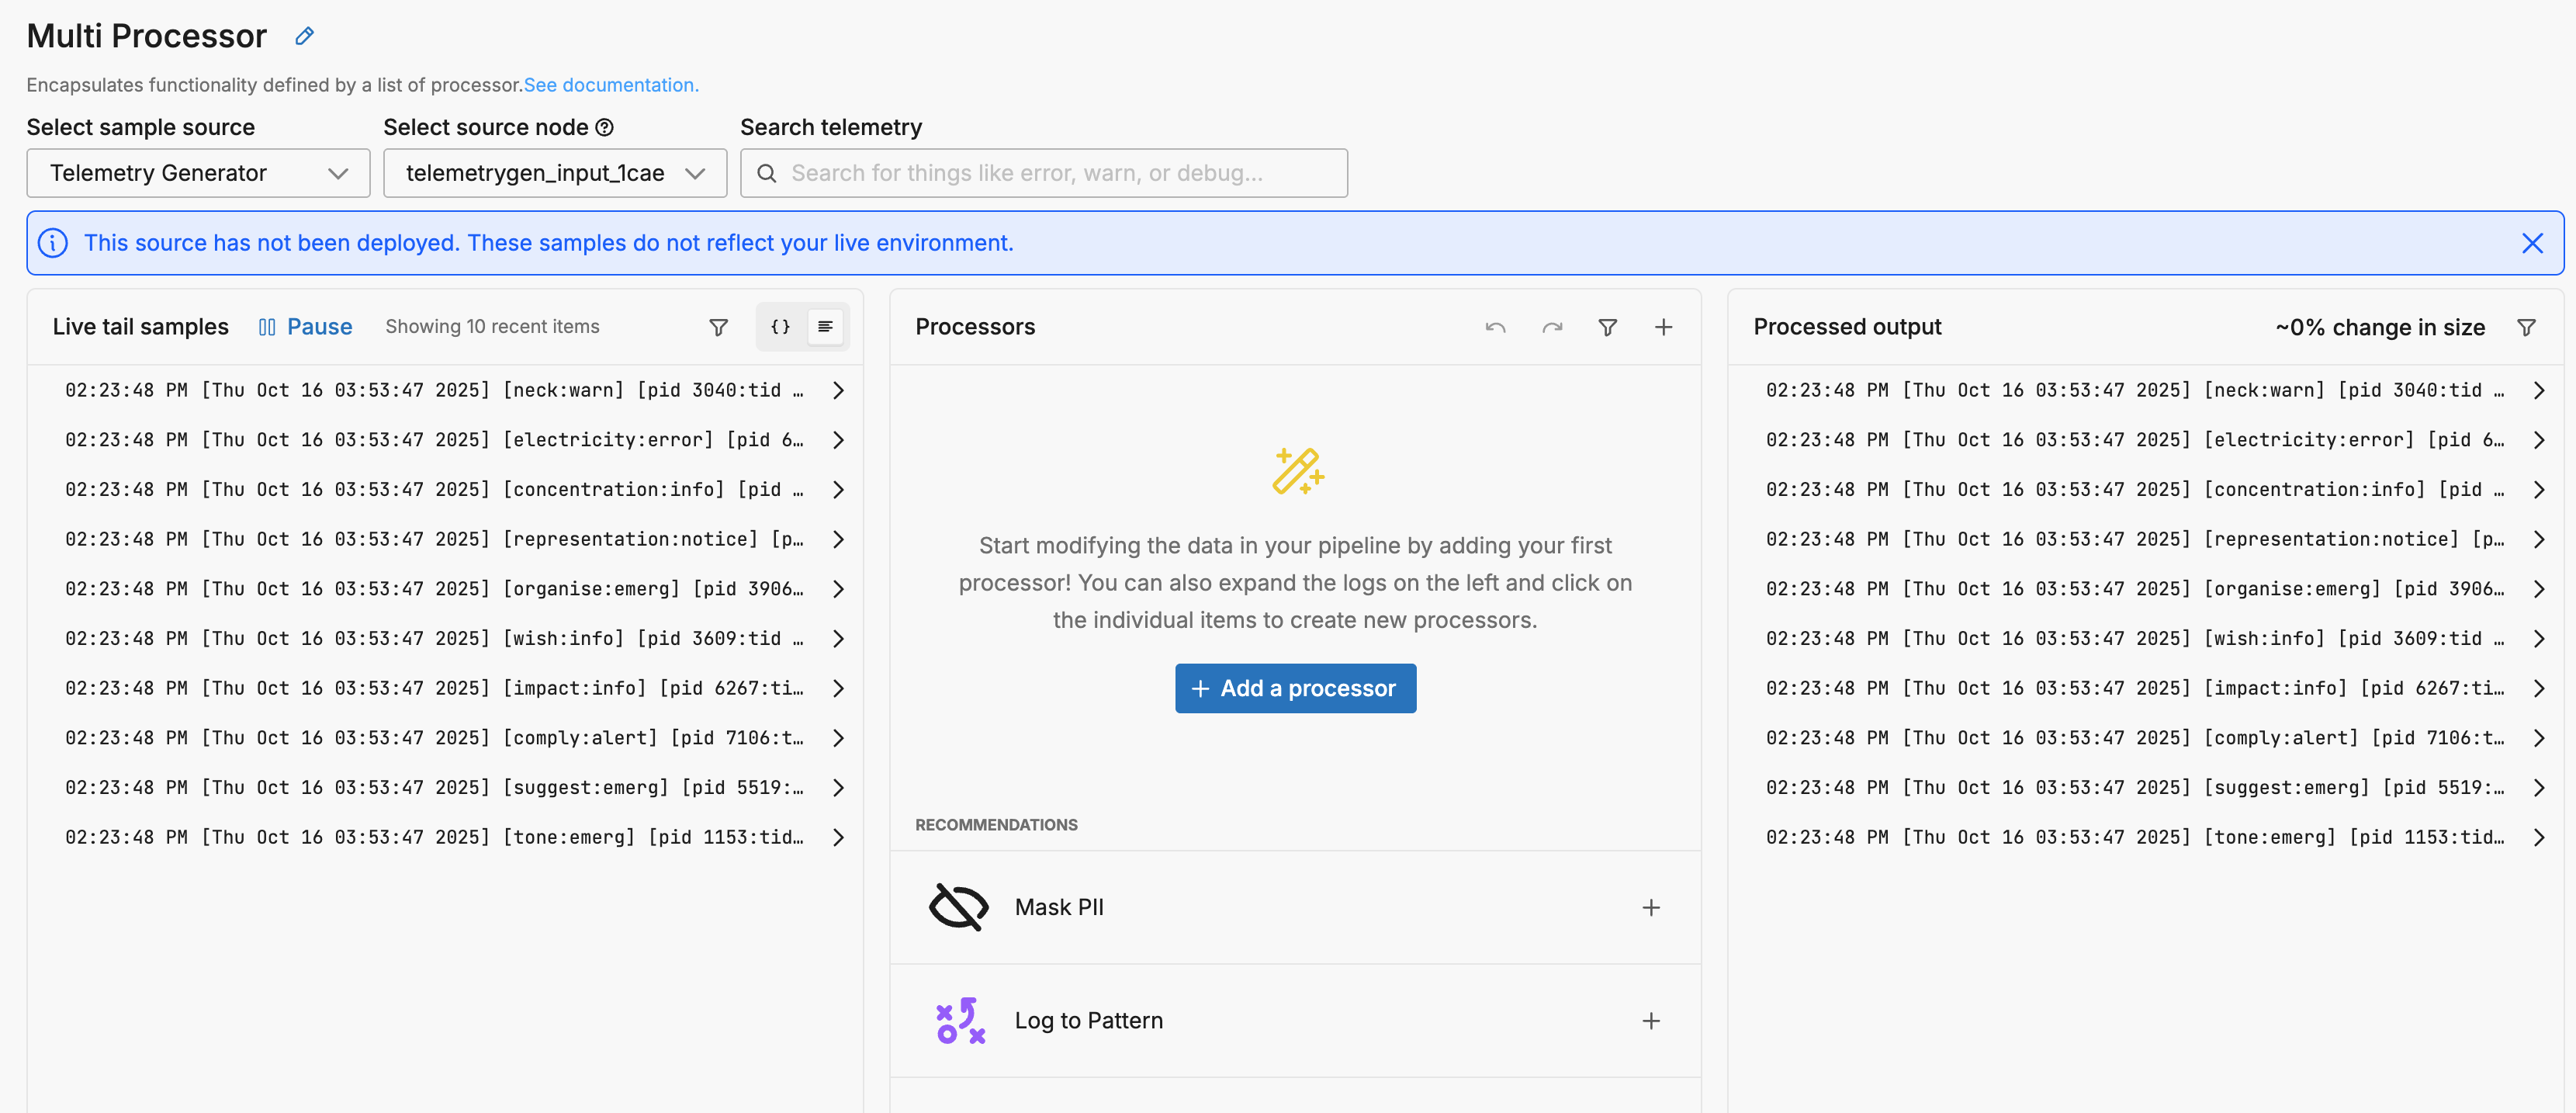
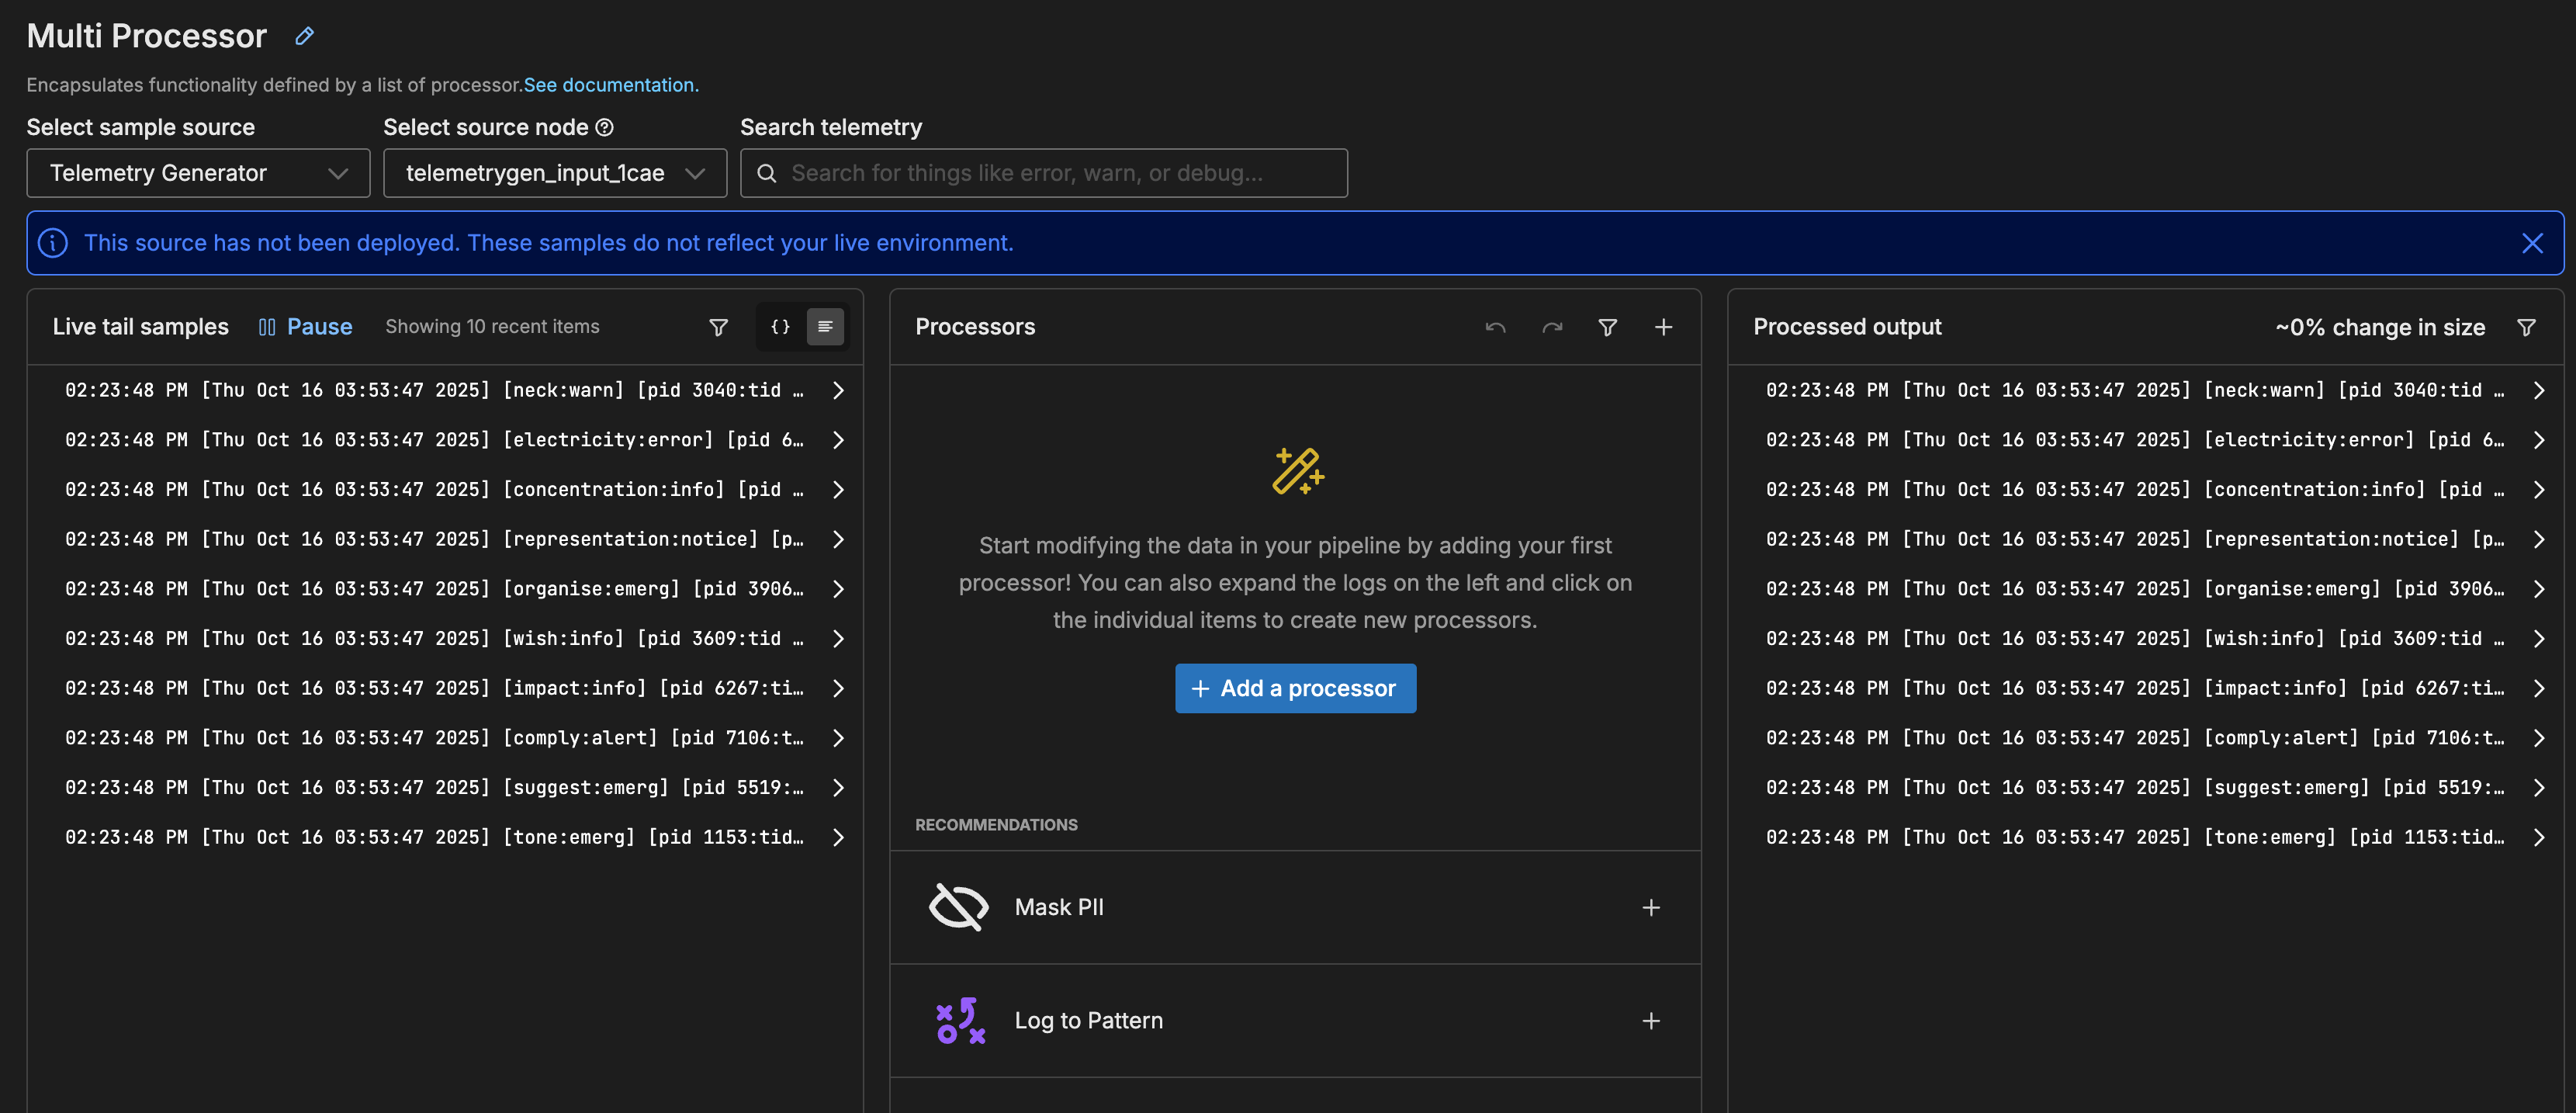
It shows the live preview of data items coming into this processor in the left pane, and data items leaving the processor in the right pane. In this case, all the data items are logs.
Here is an example of one of the logs:
[Thu Oct 16 03:53:47 2025] [wish:info] [pid 3609:tid 8820] [client: 146.124.109.152] We need to input the cross-platform PCI alarm!
2. Add a Filter Processor
Now you start to define the actions that are taken in this node by adding processors. Each processor performs a specific task in order. You add a filter processor to drop specific logs.
- Click Add a processor.

- Search for
filterand select the Filter processor.
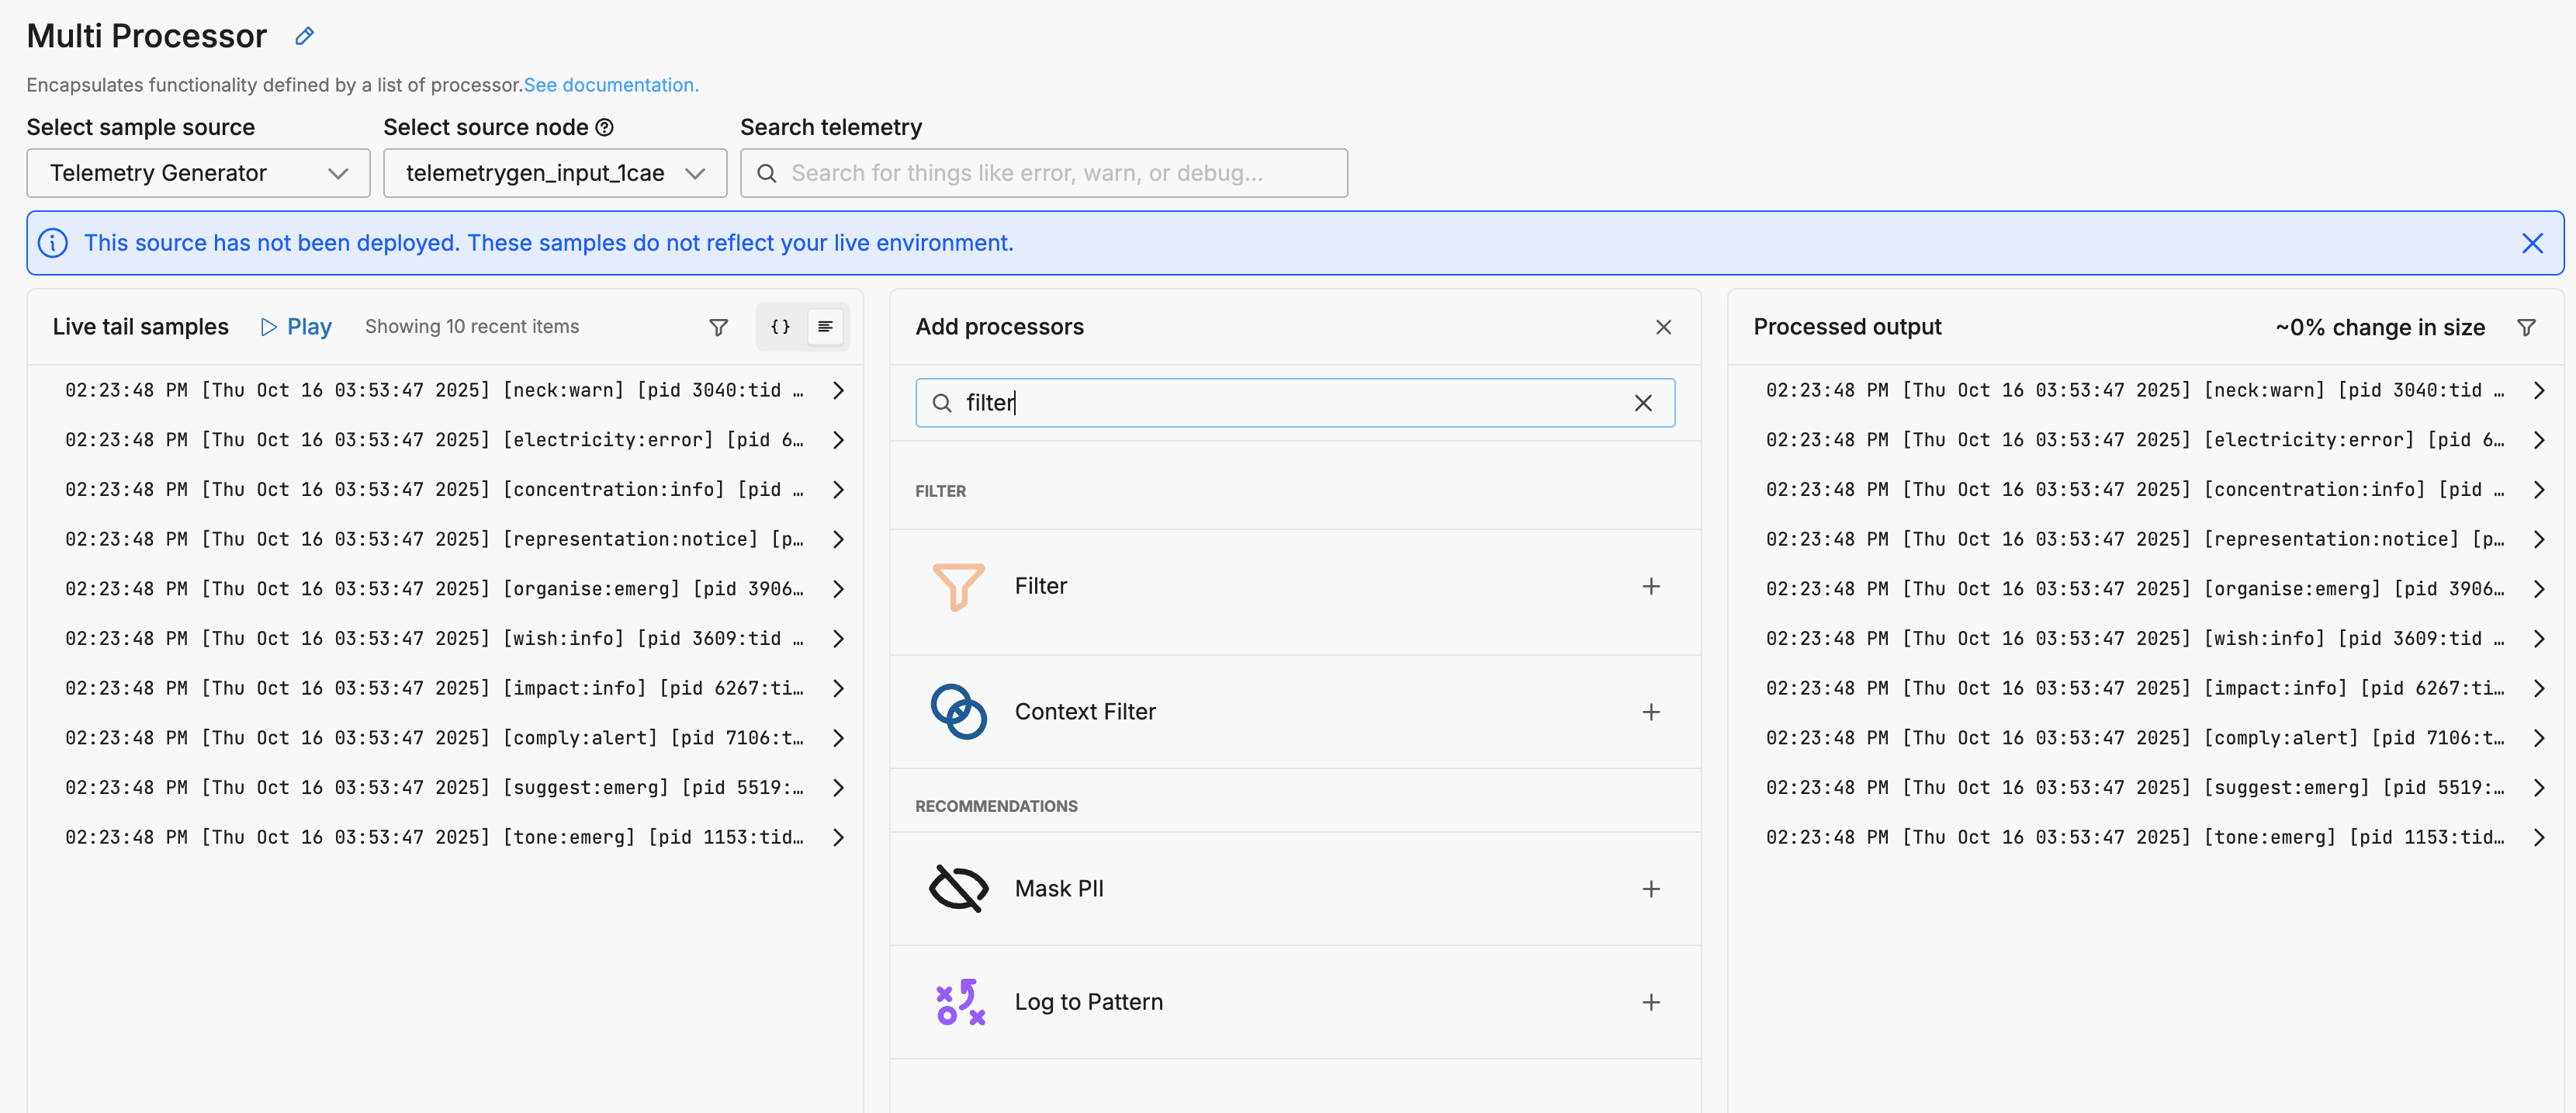
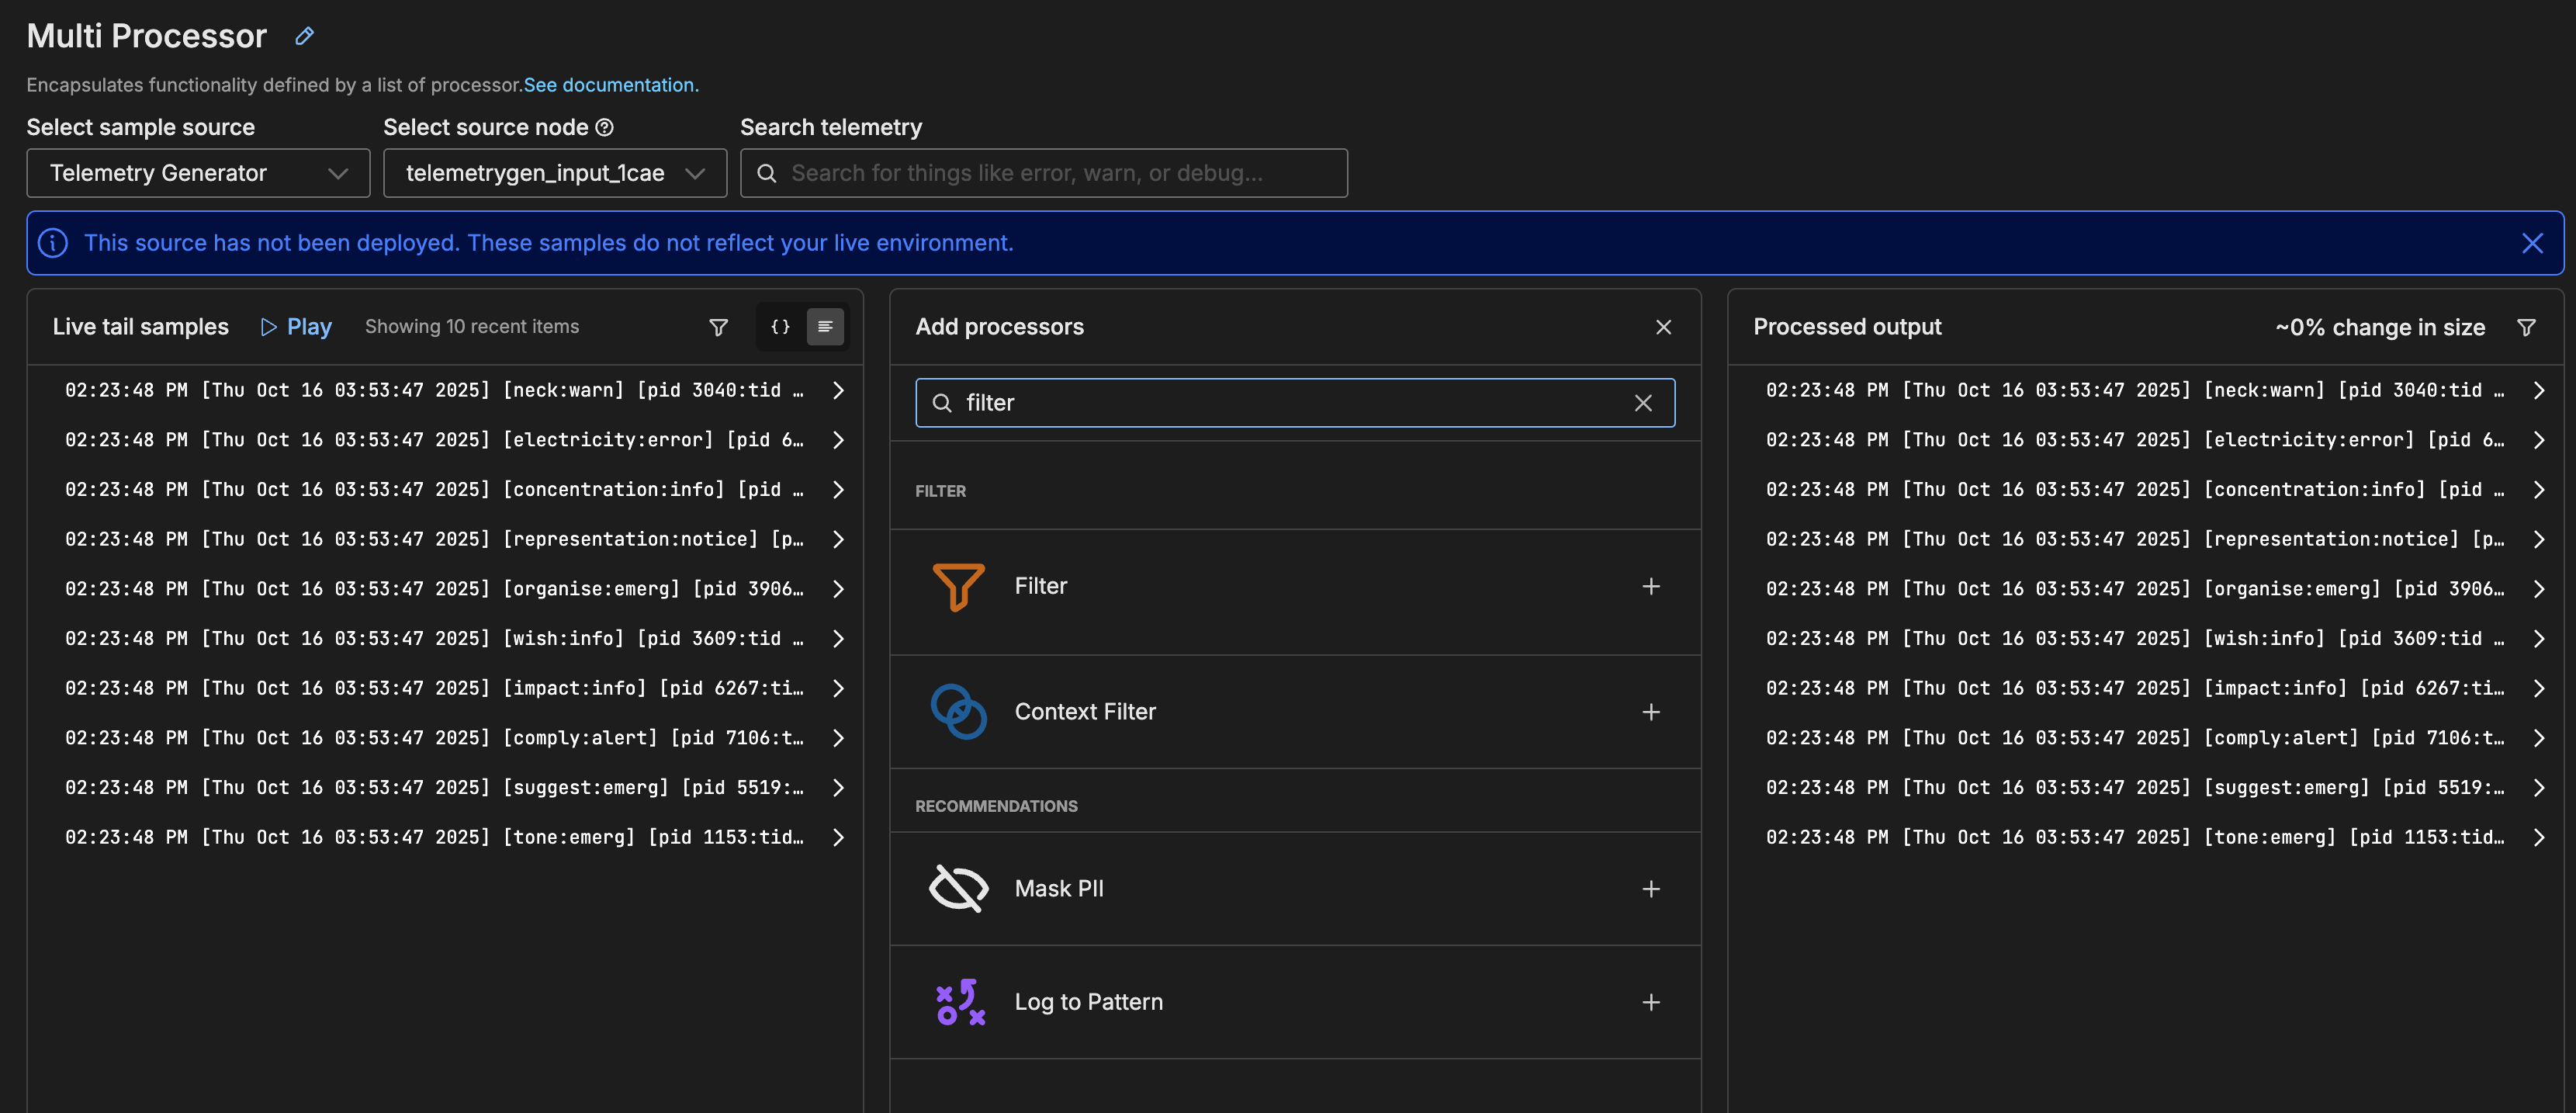
Note that Exclude is selected as the action by default. This means that matching items will be excluded.
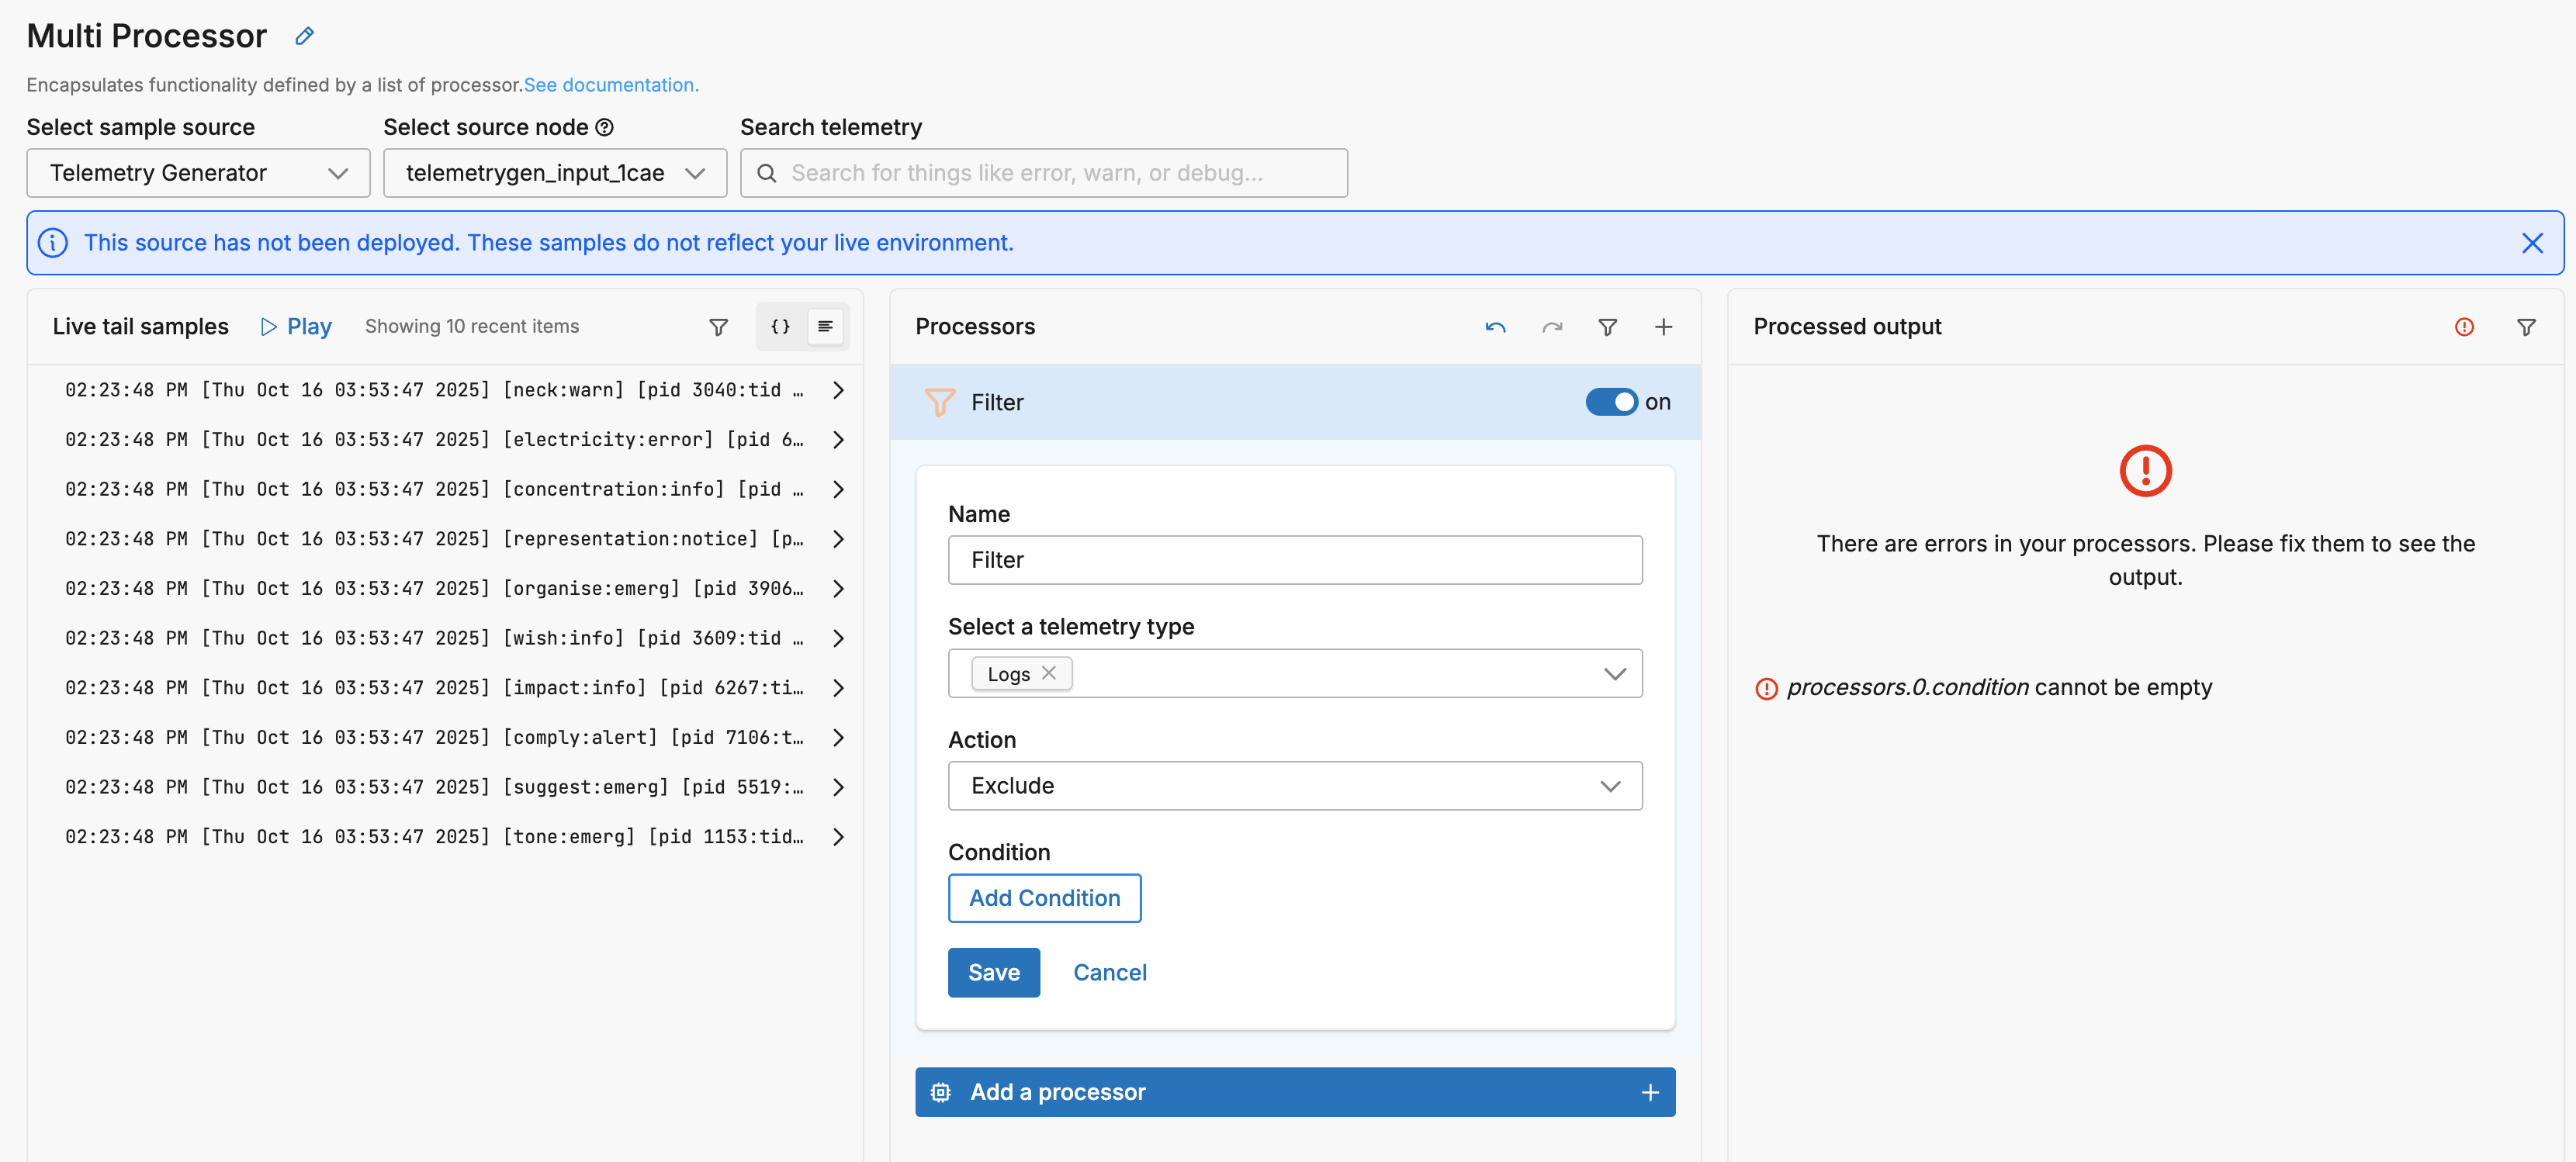
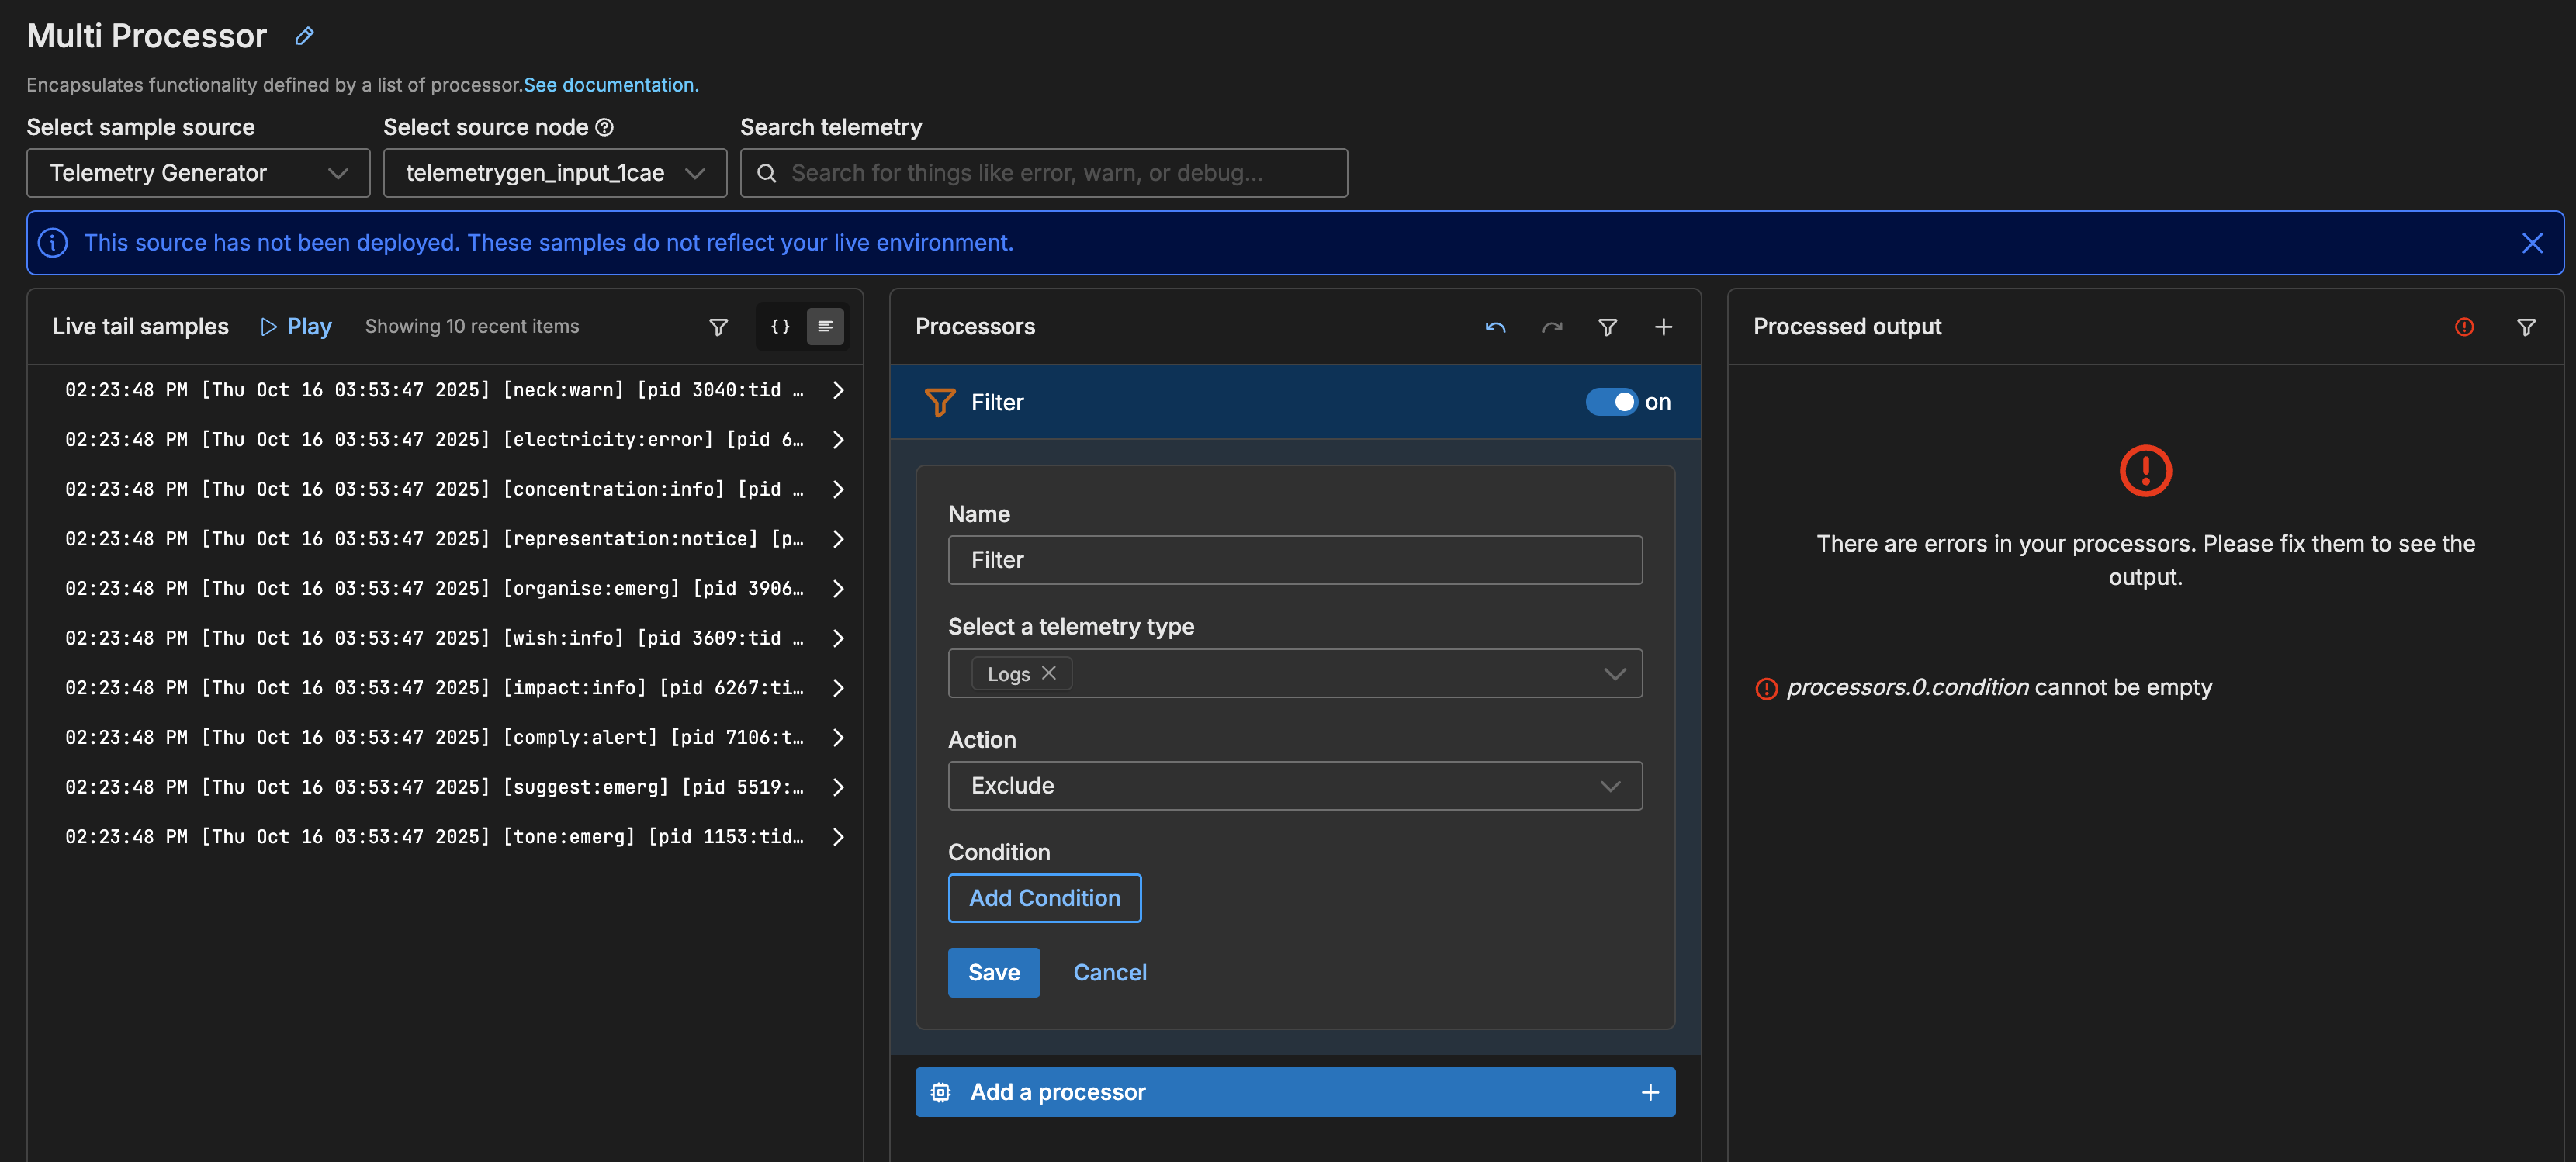
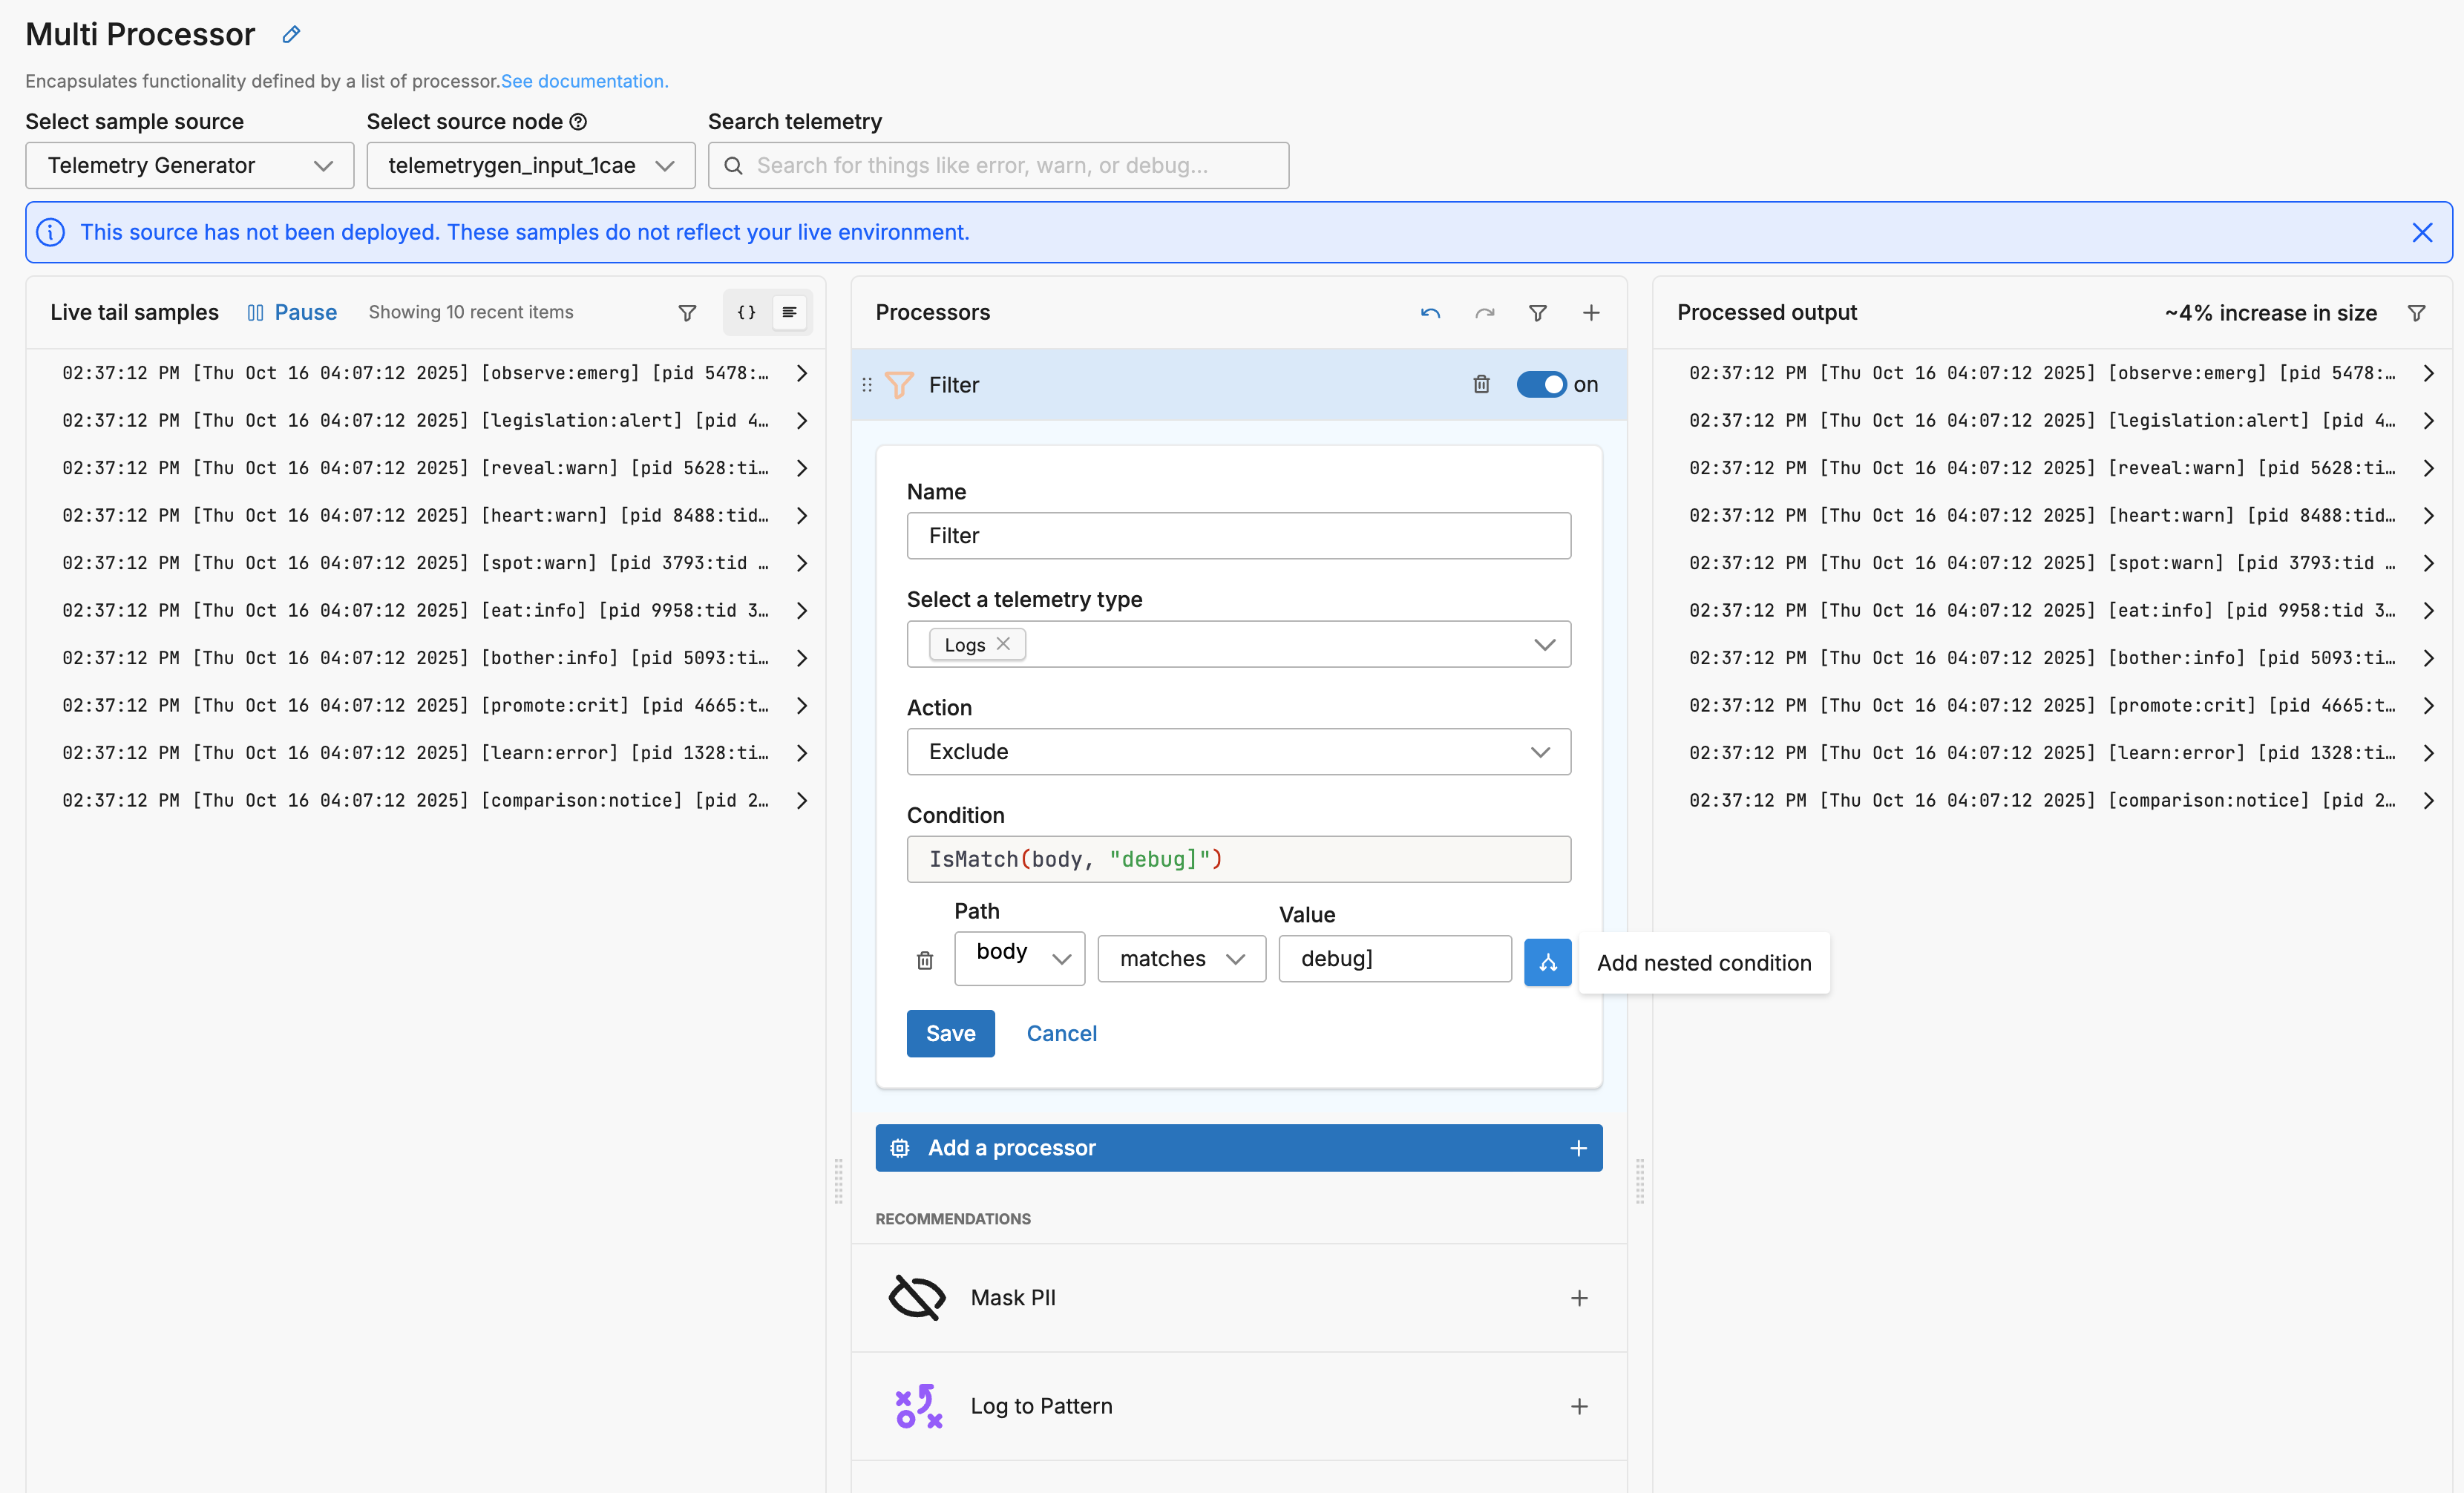
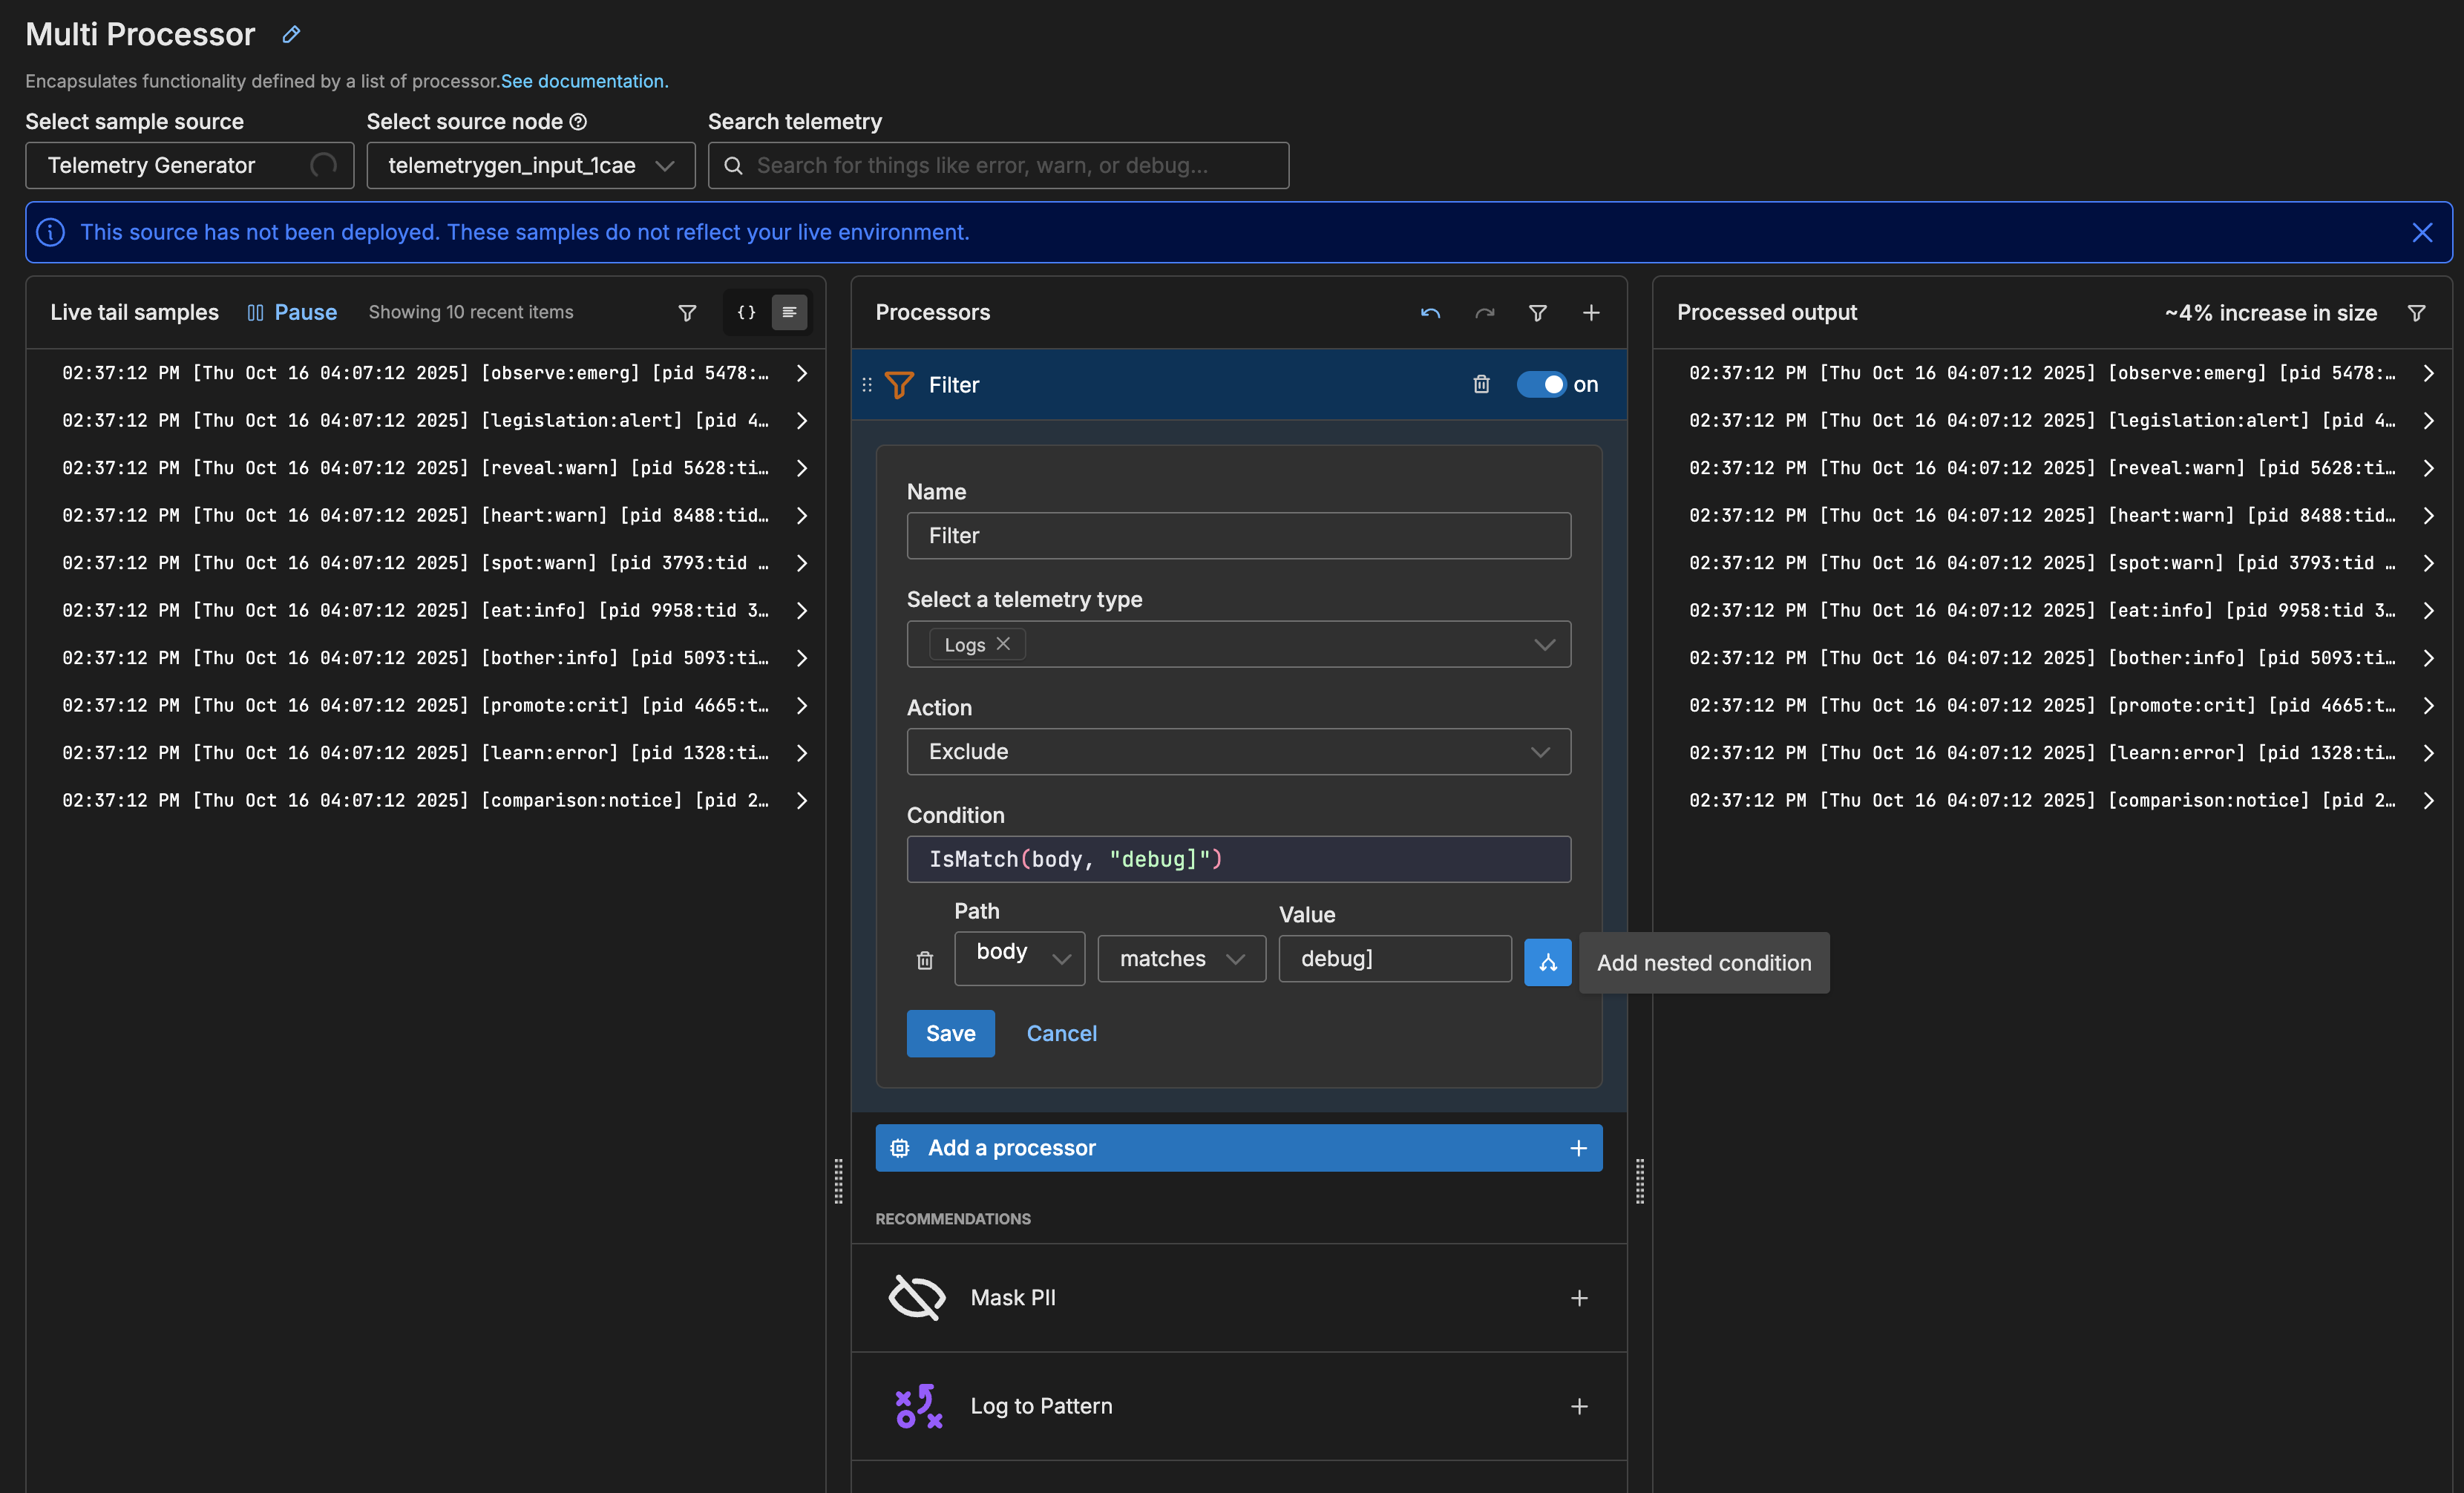
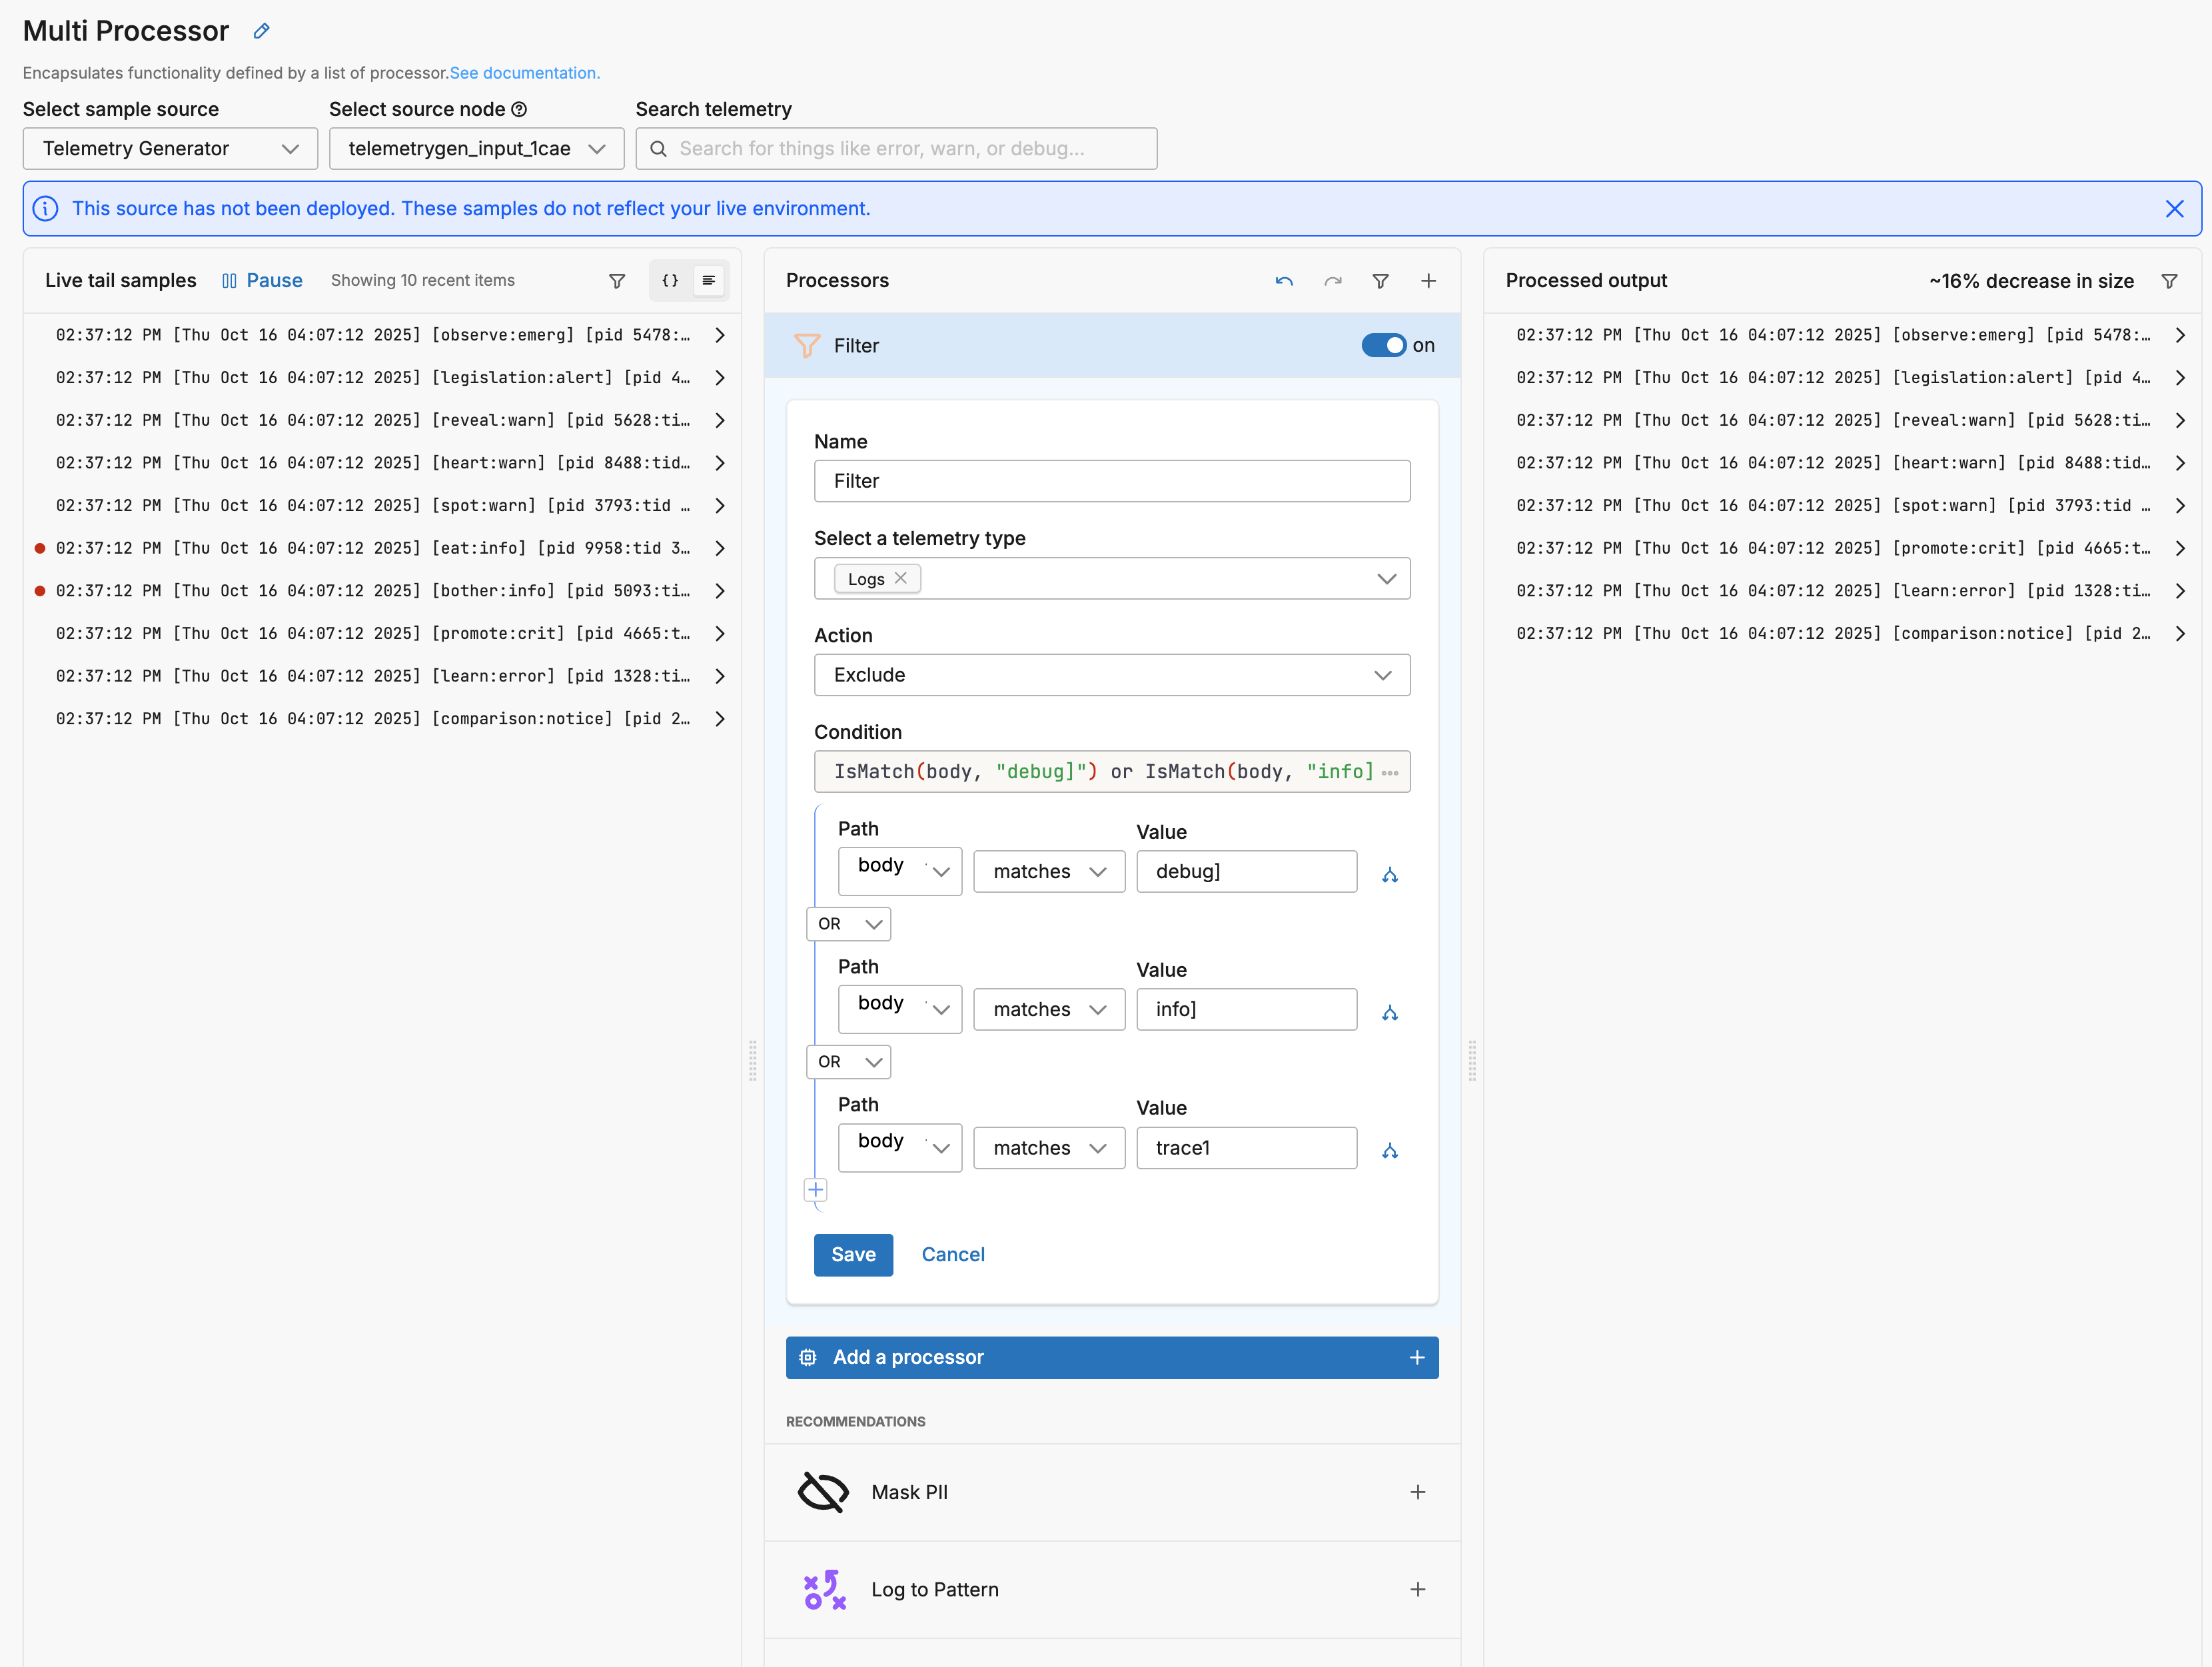
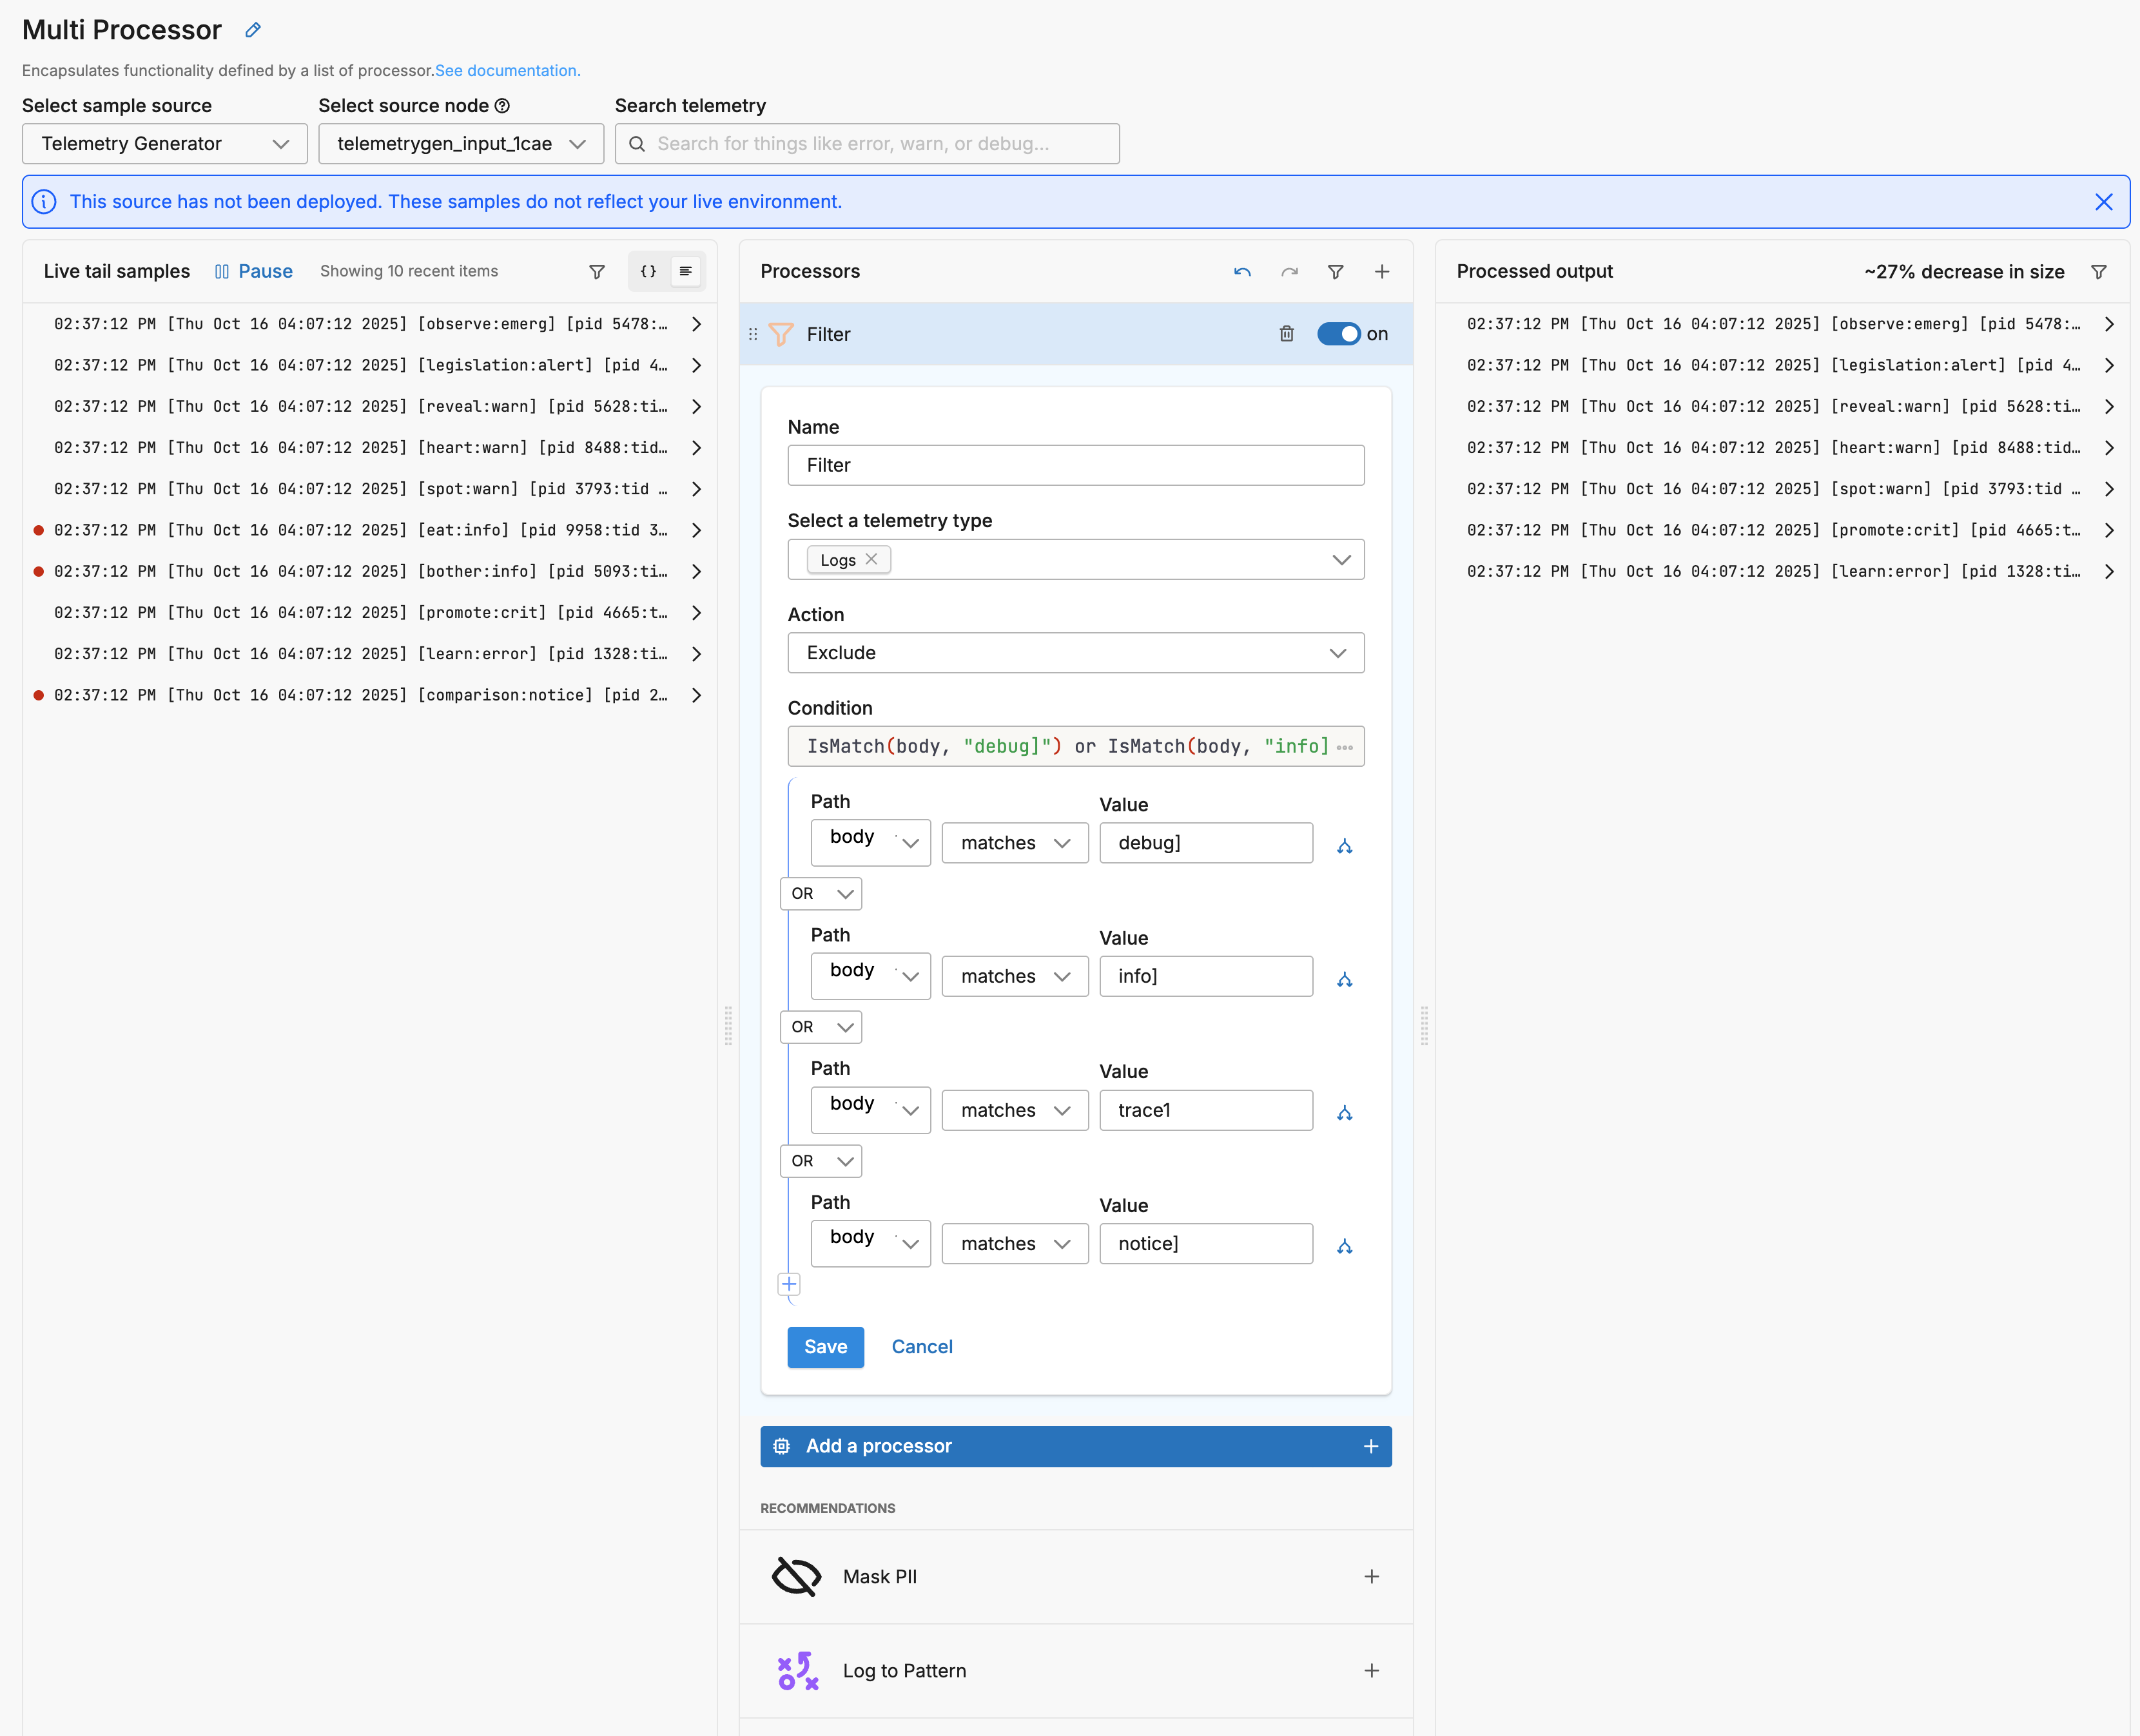
3. Define Filter Conditions.
- Click Add Condition. This is the section that will define which logs to drop.
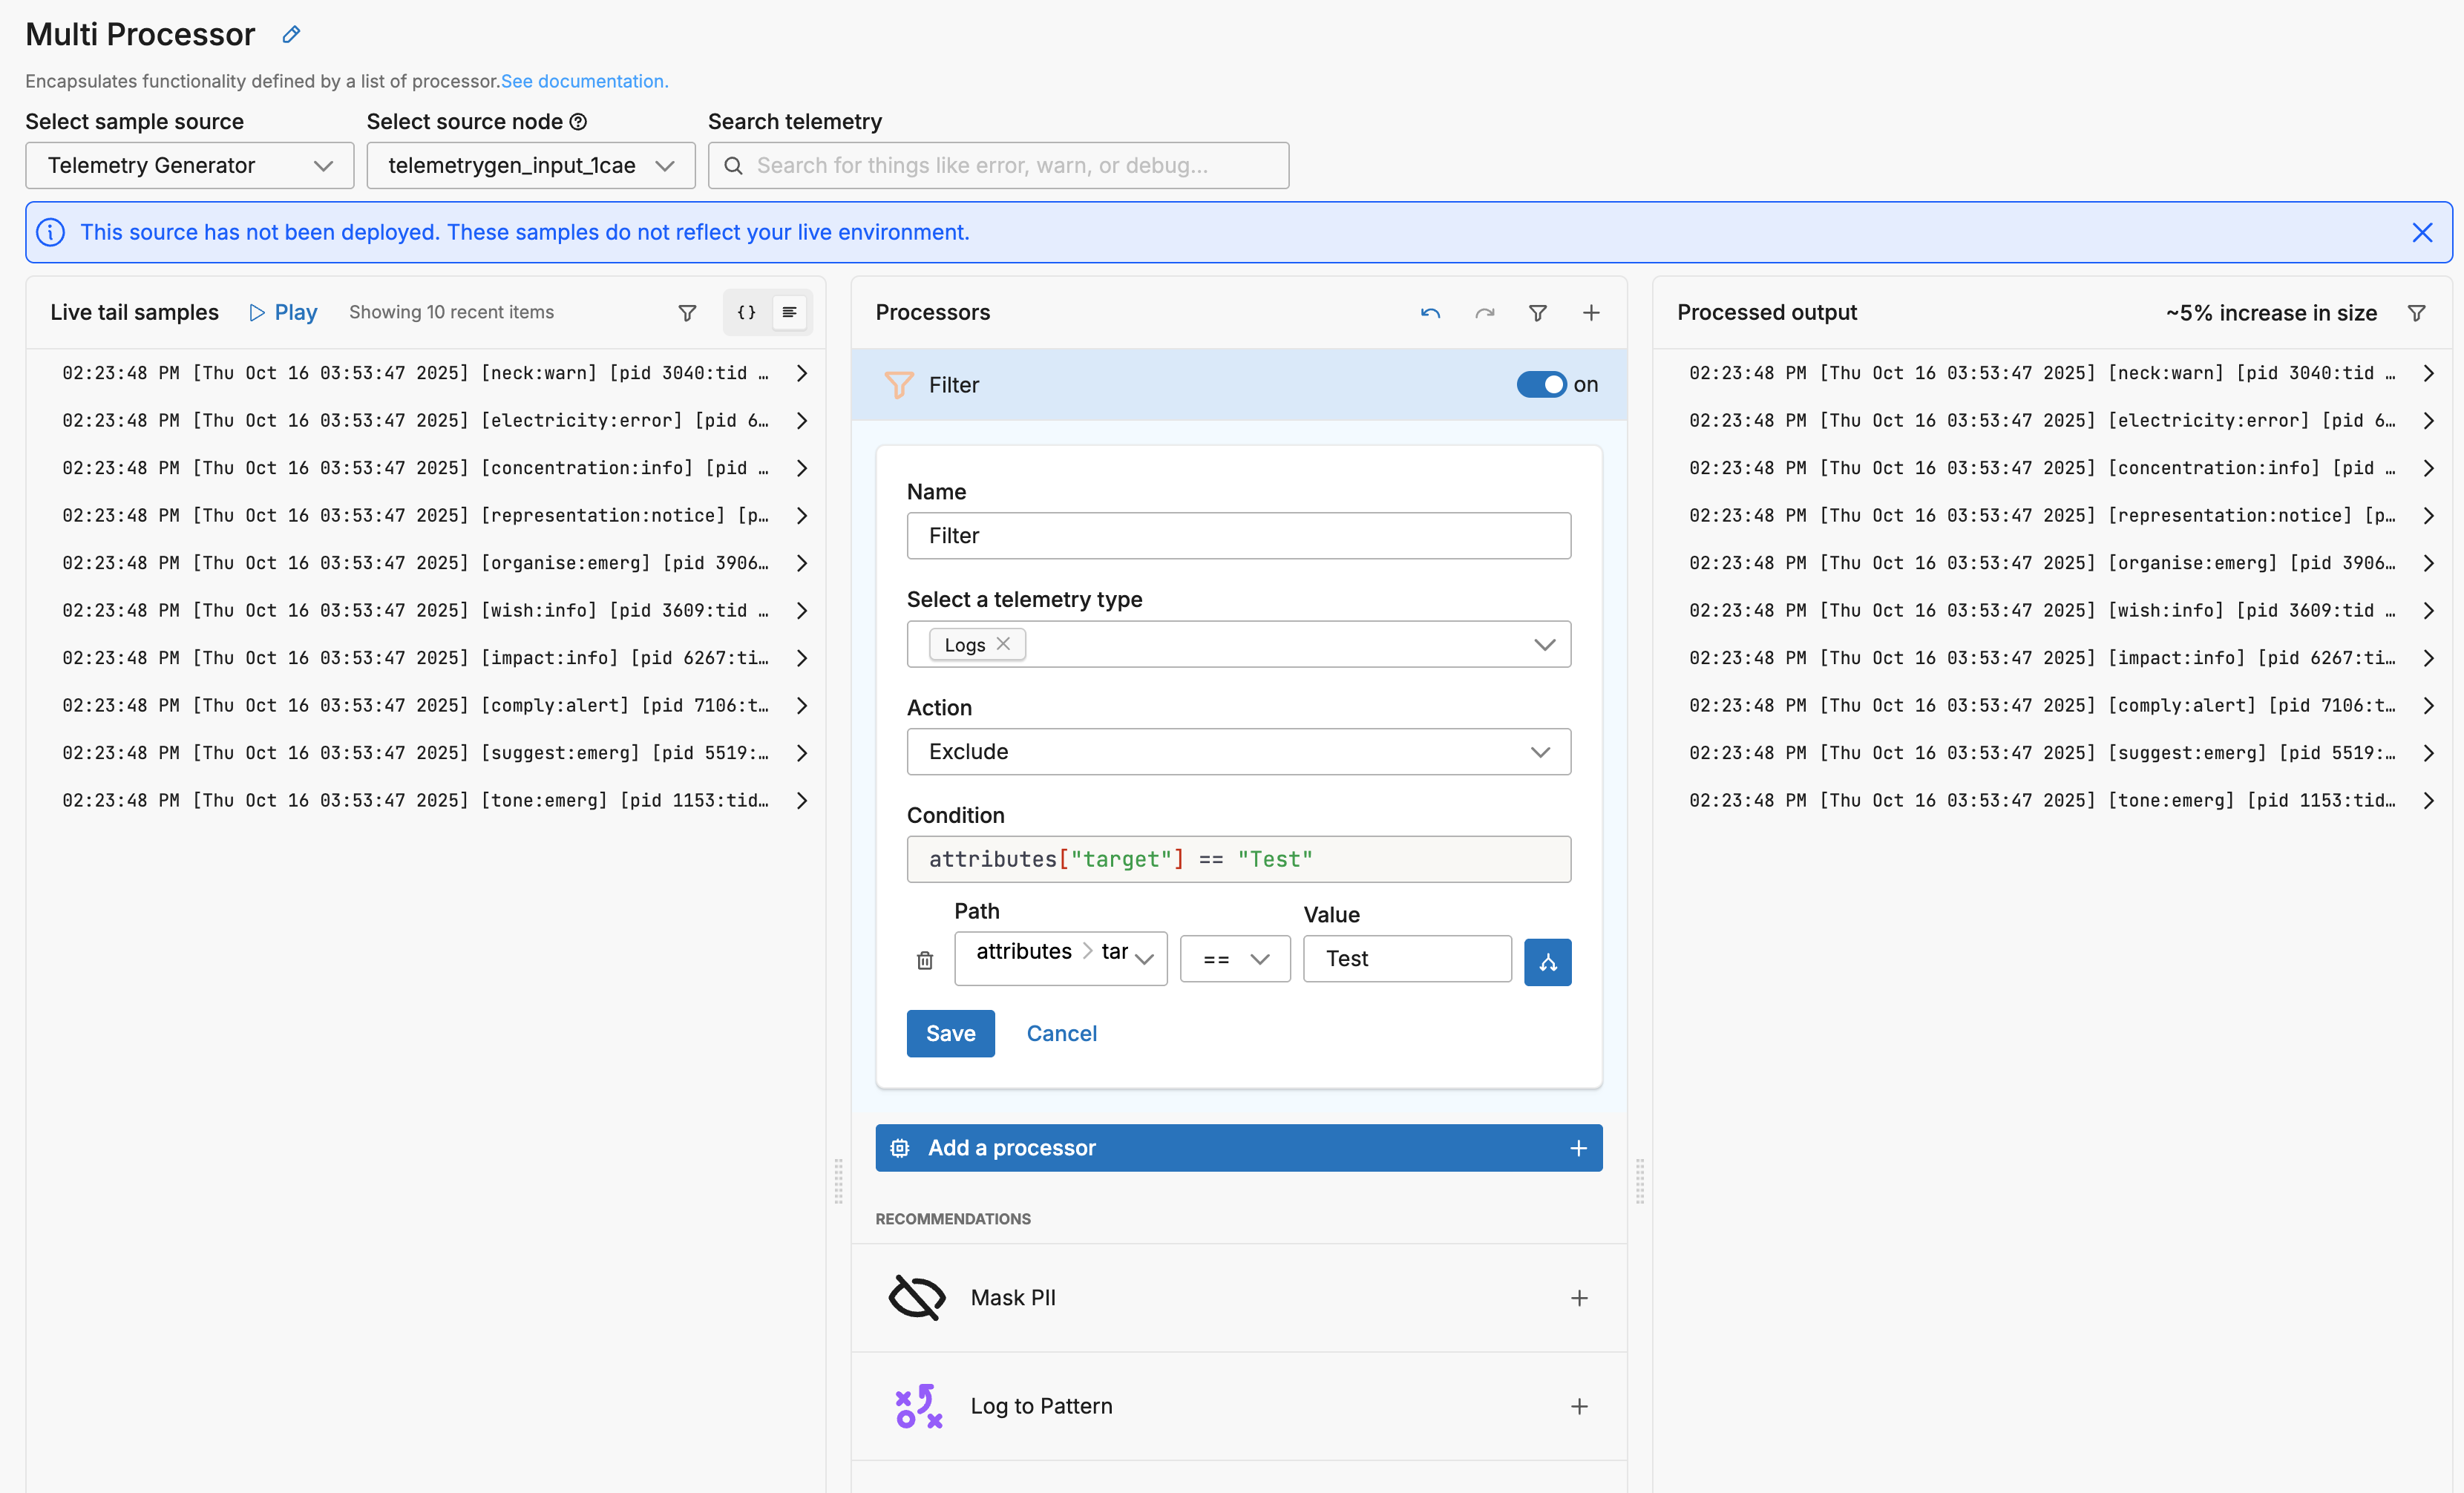
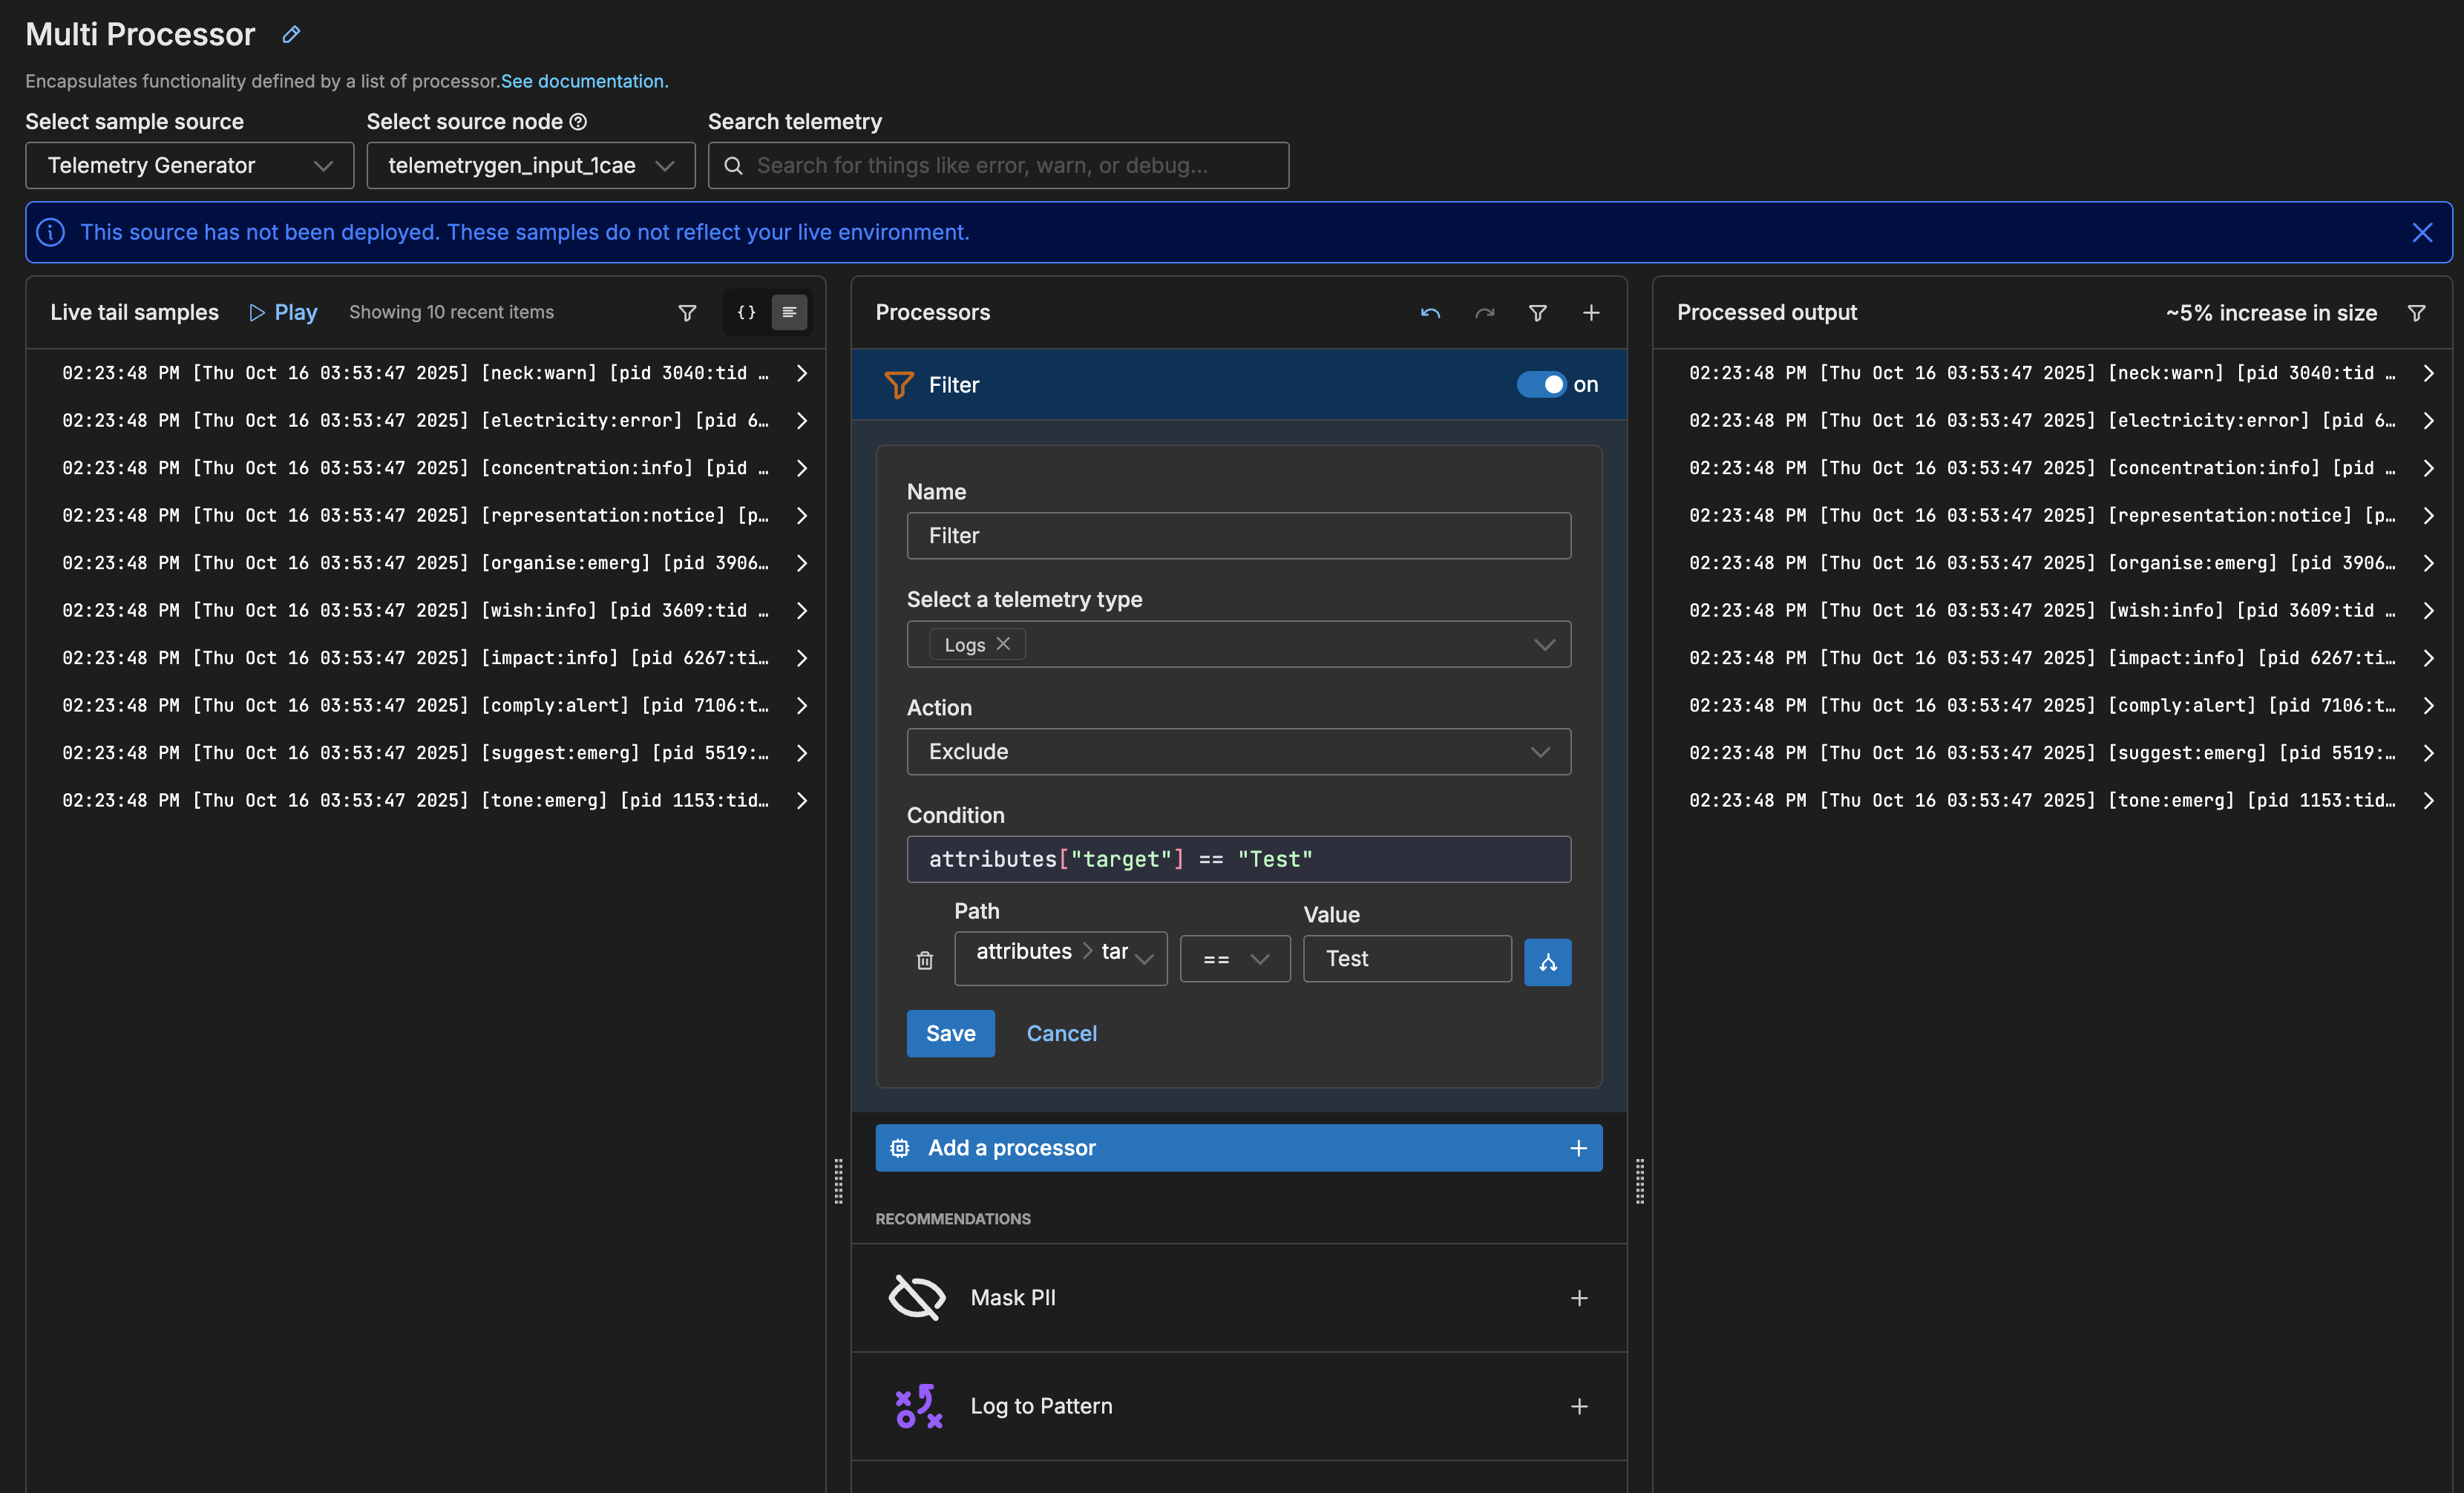
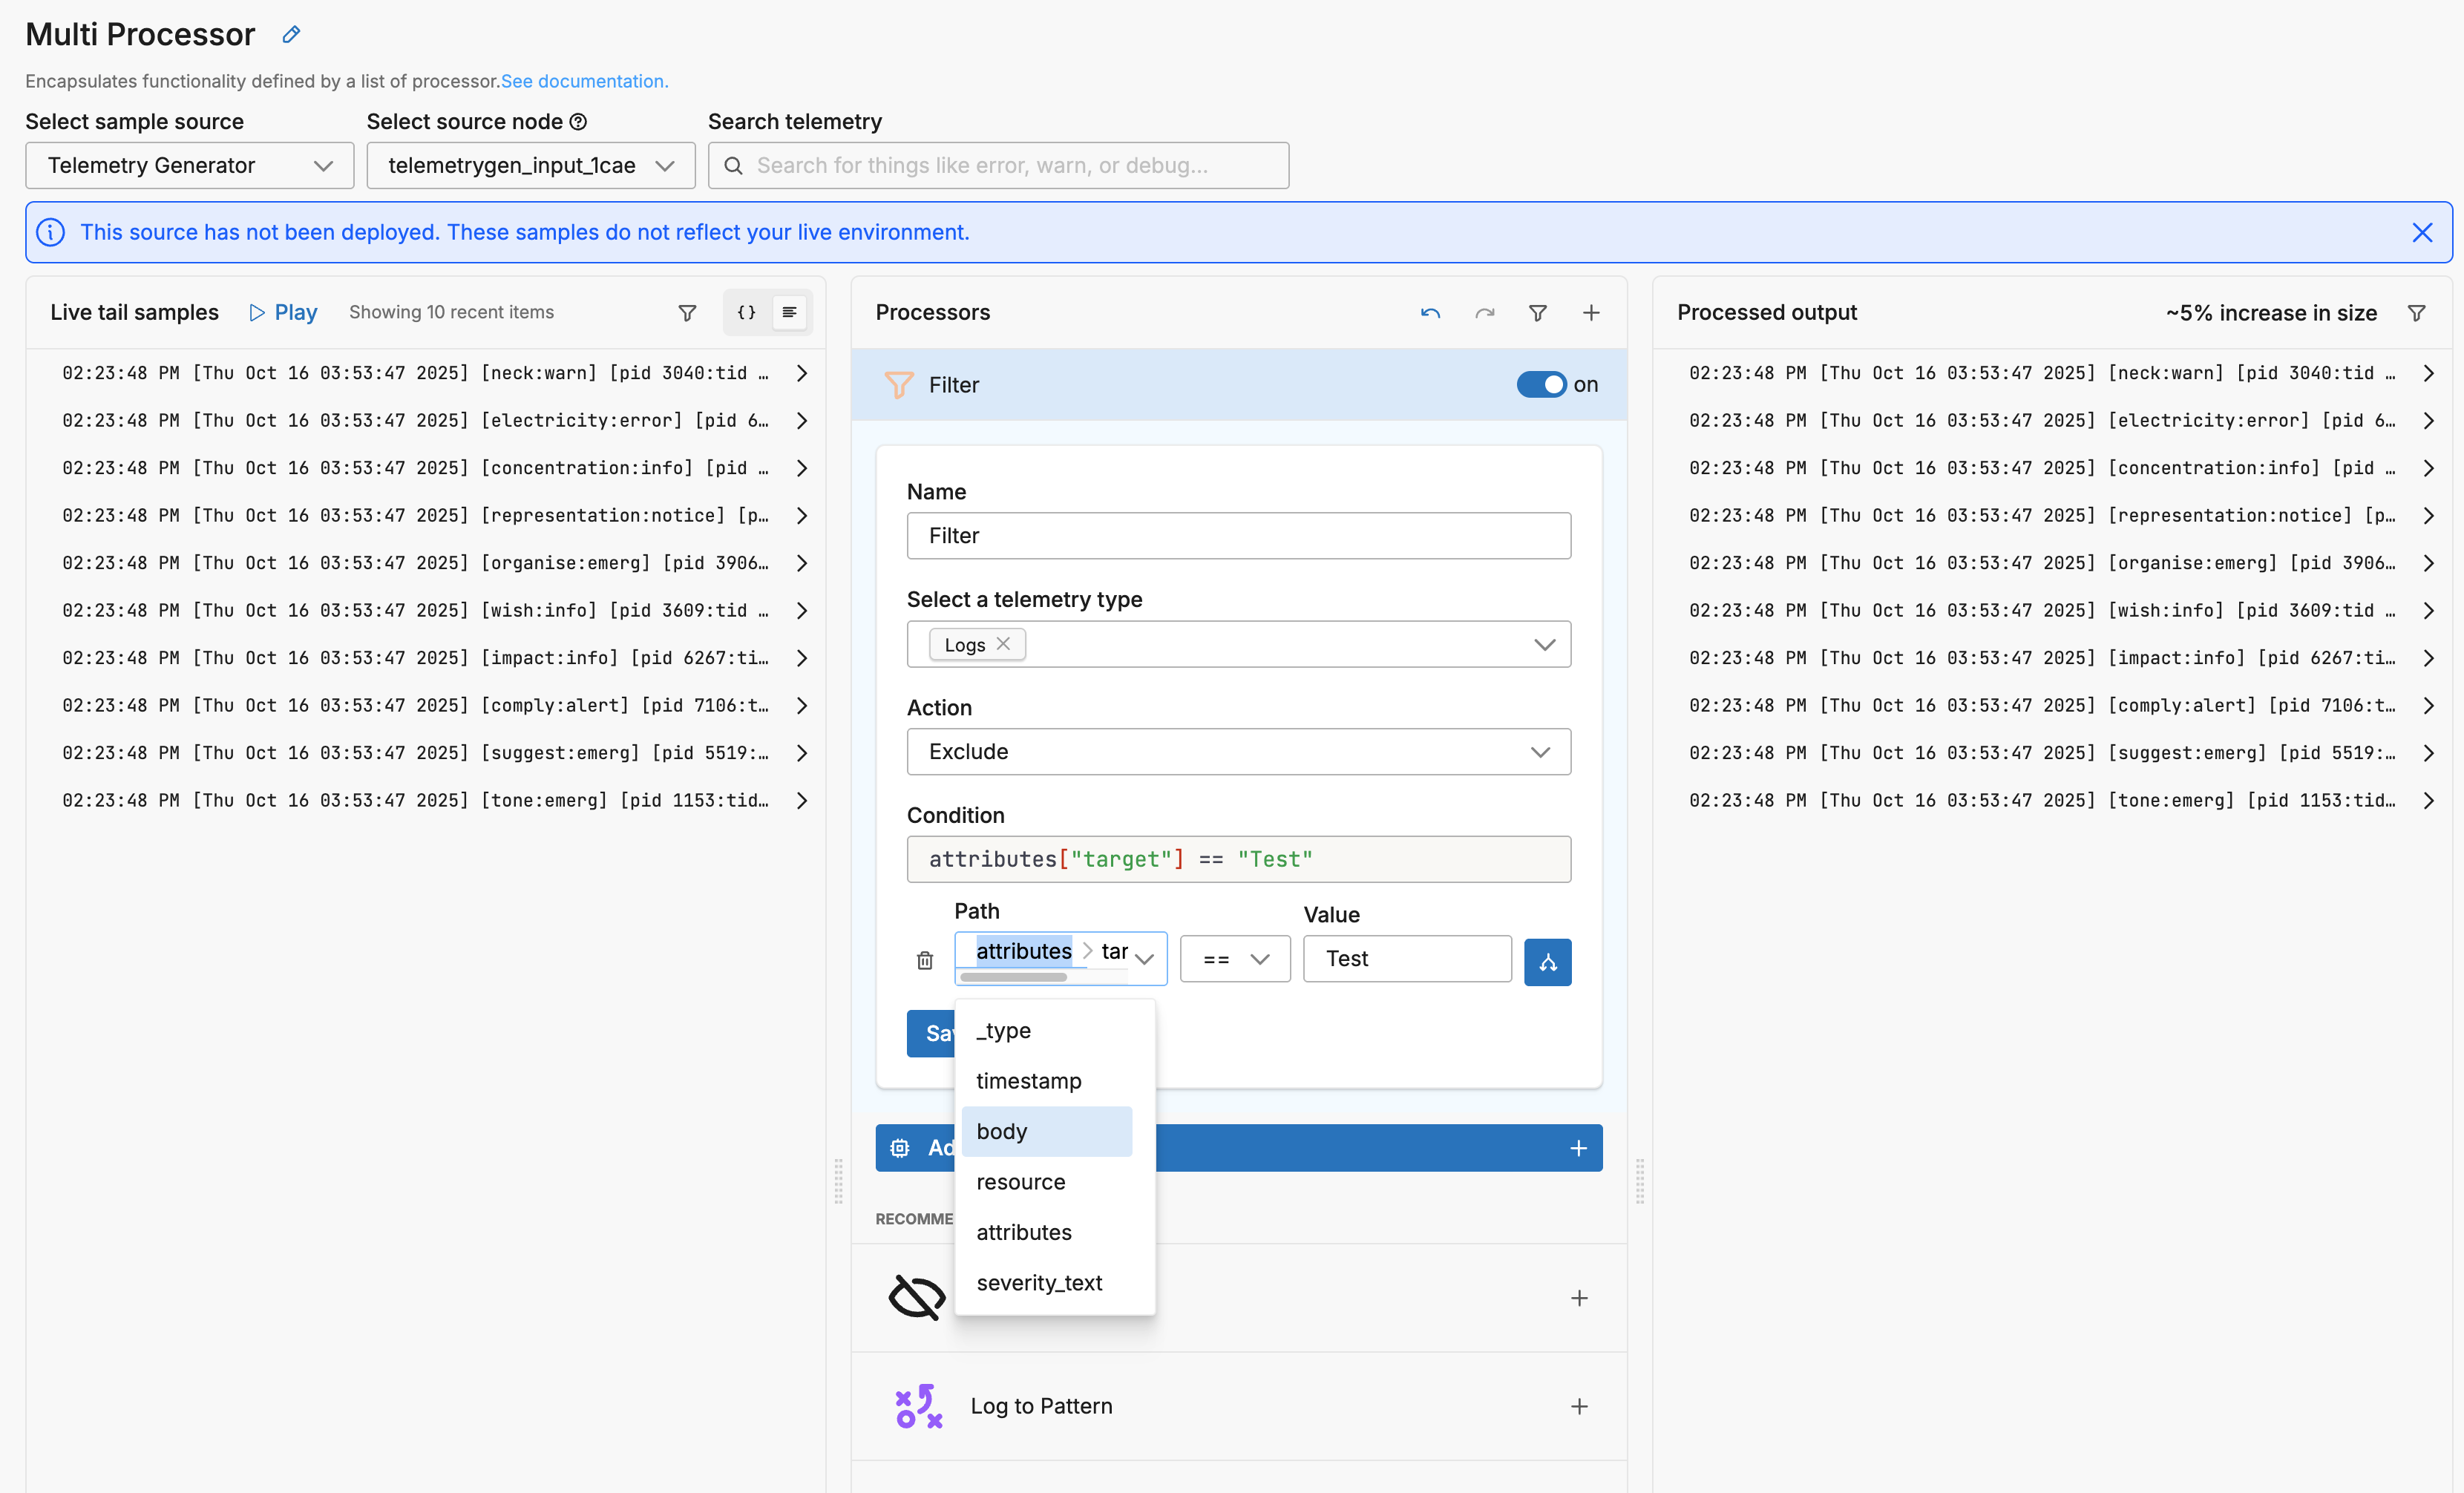
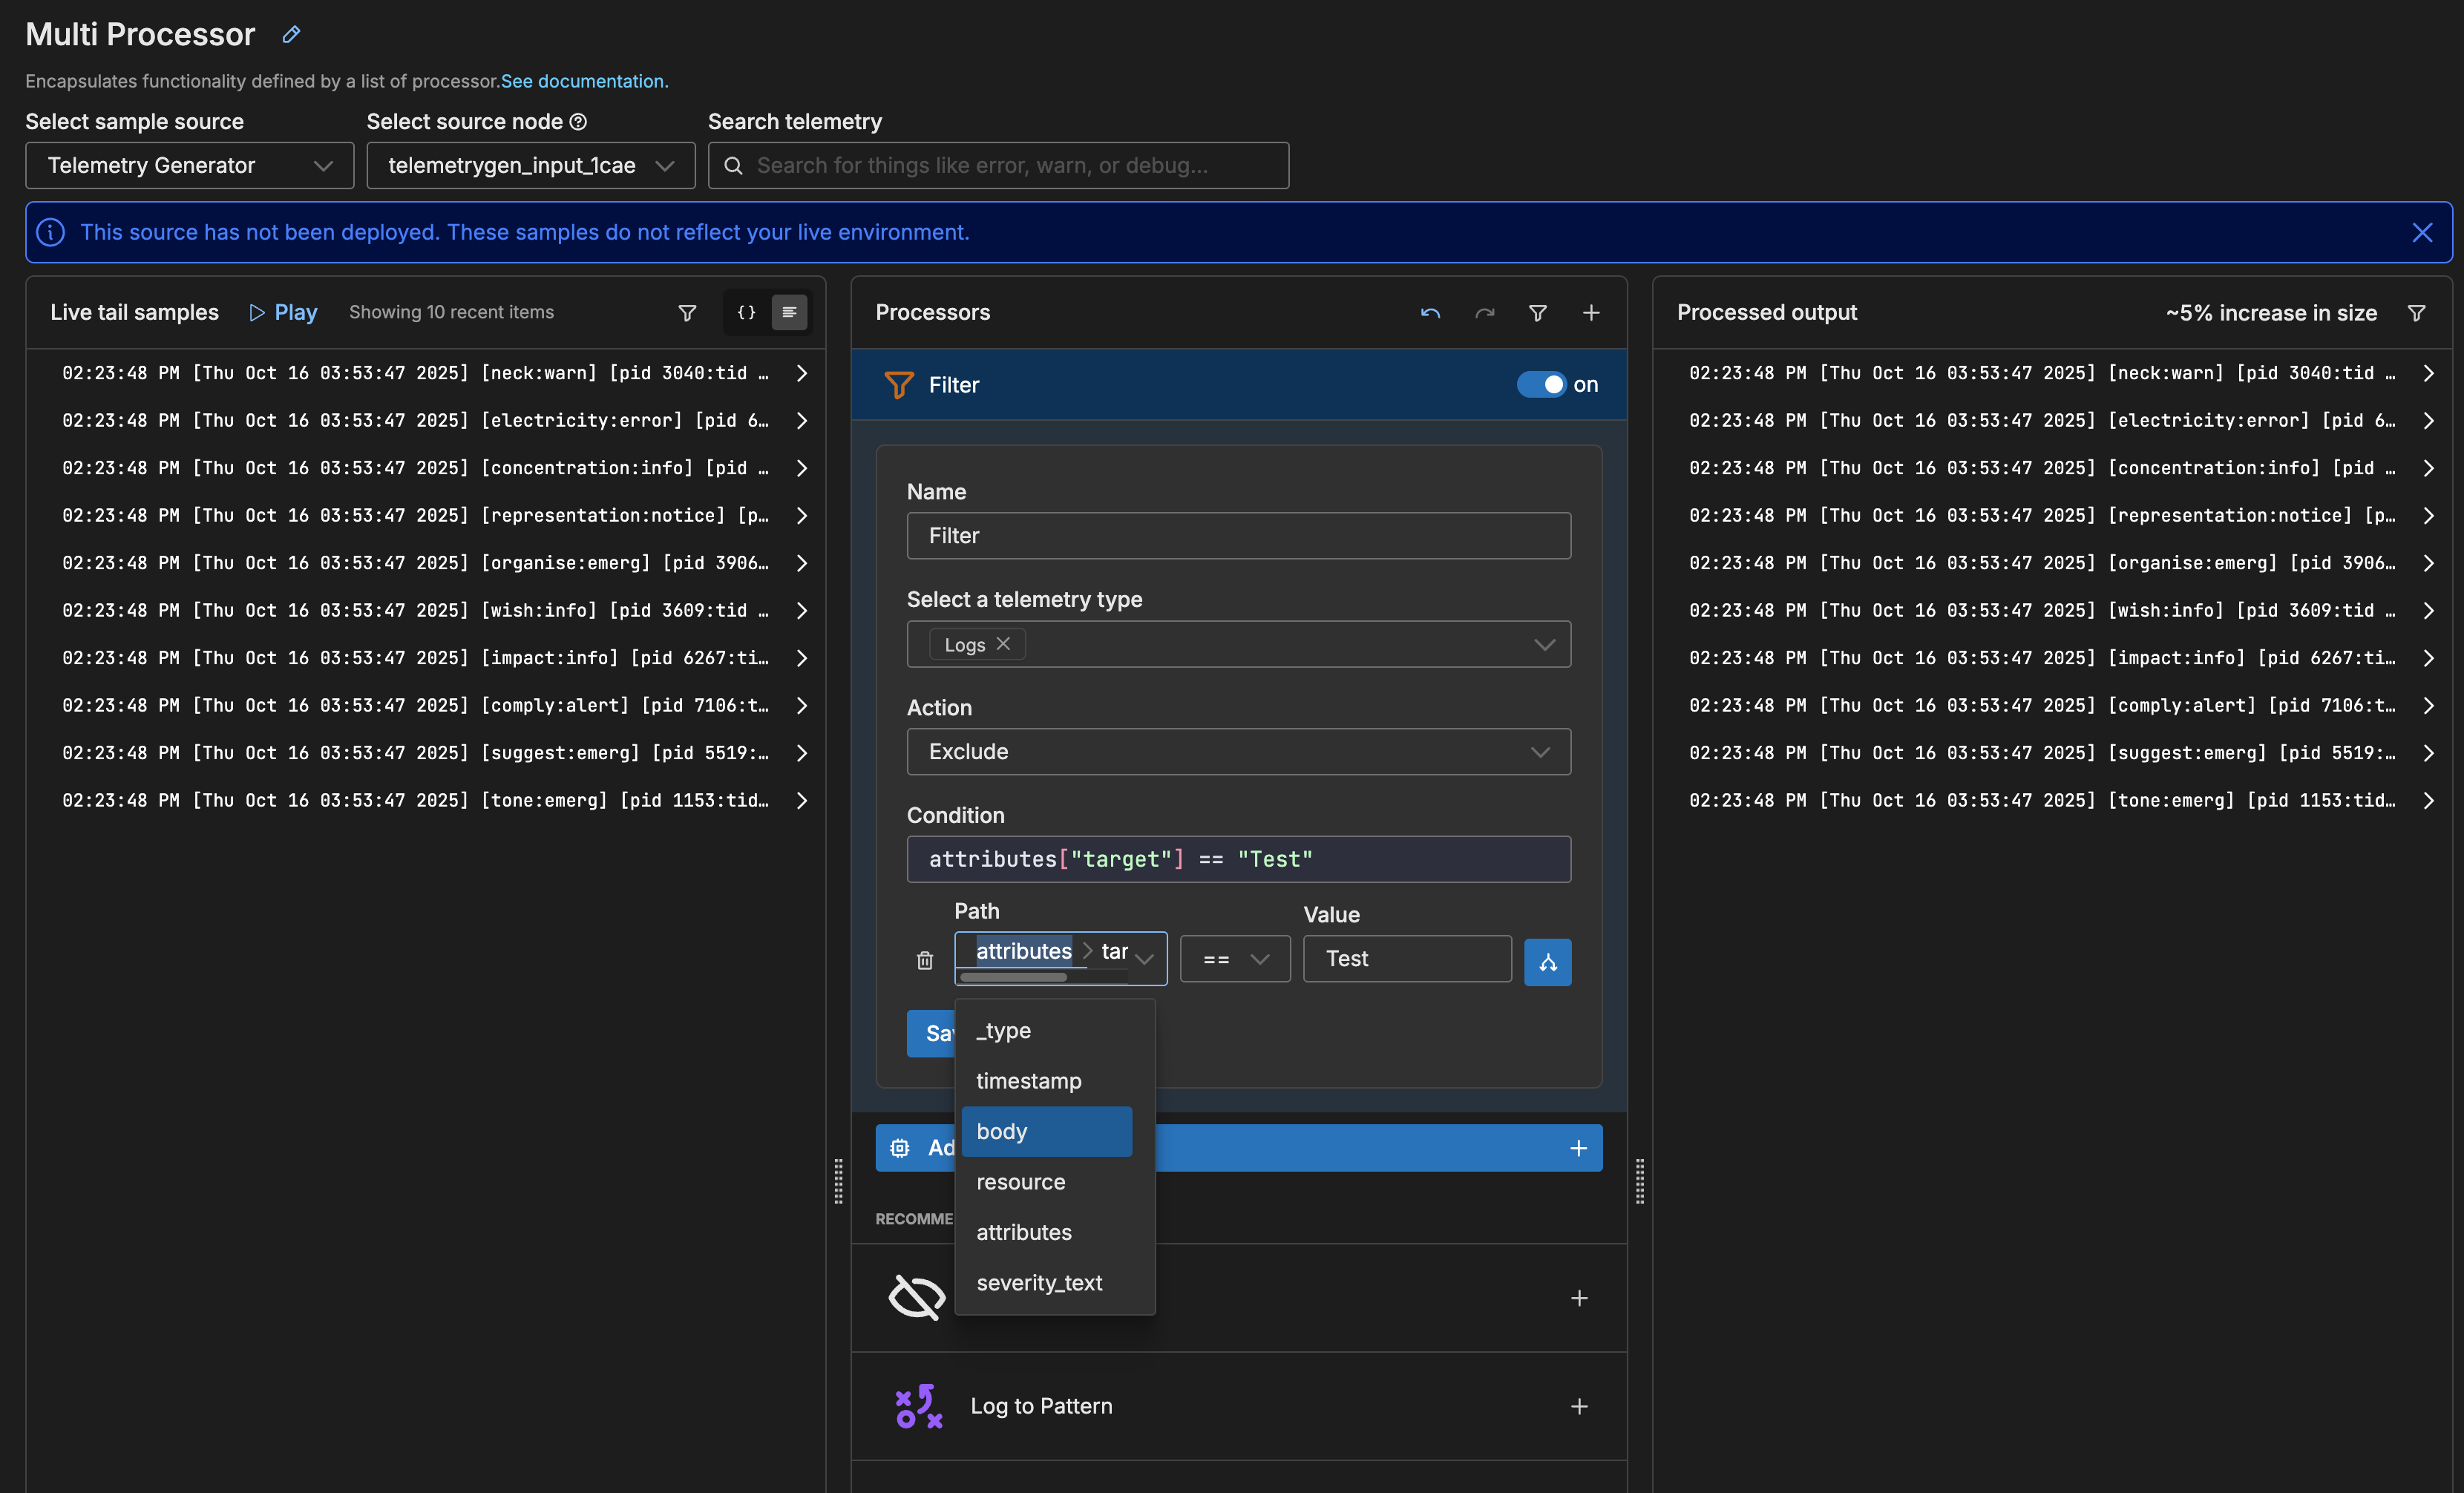
- Next, define the first condition. Set the processor to evaluate the body. Click Path and select Body.
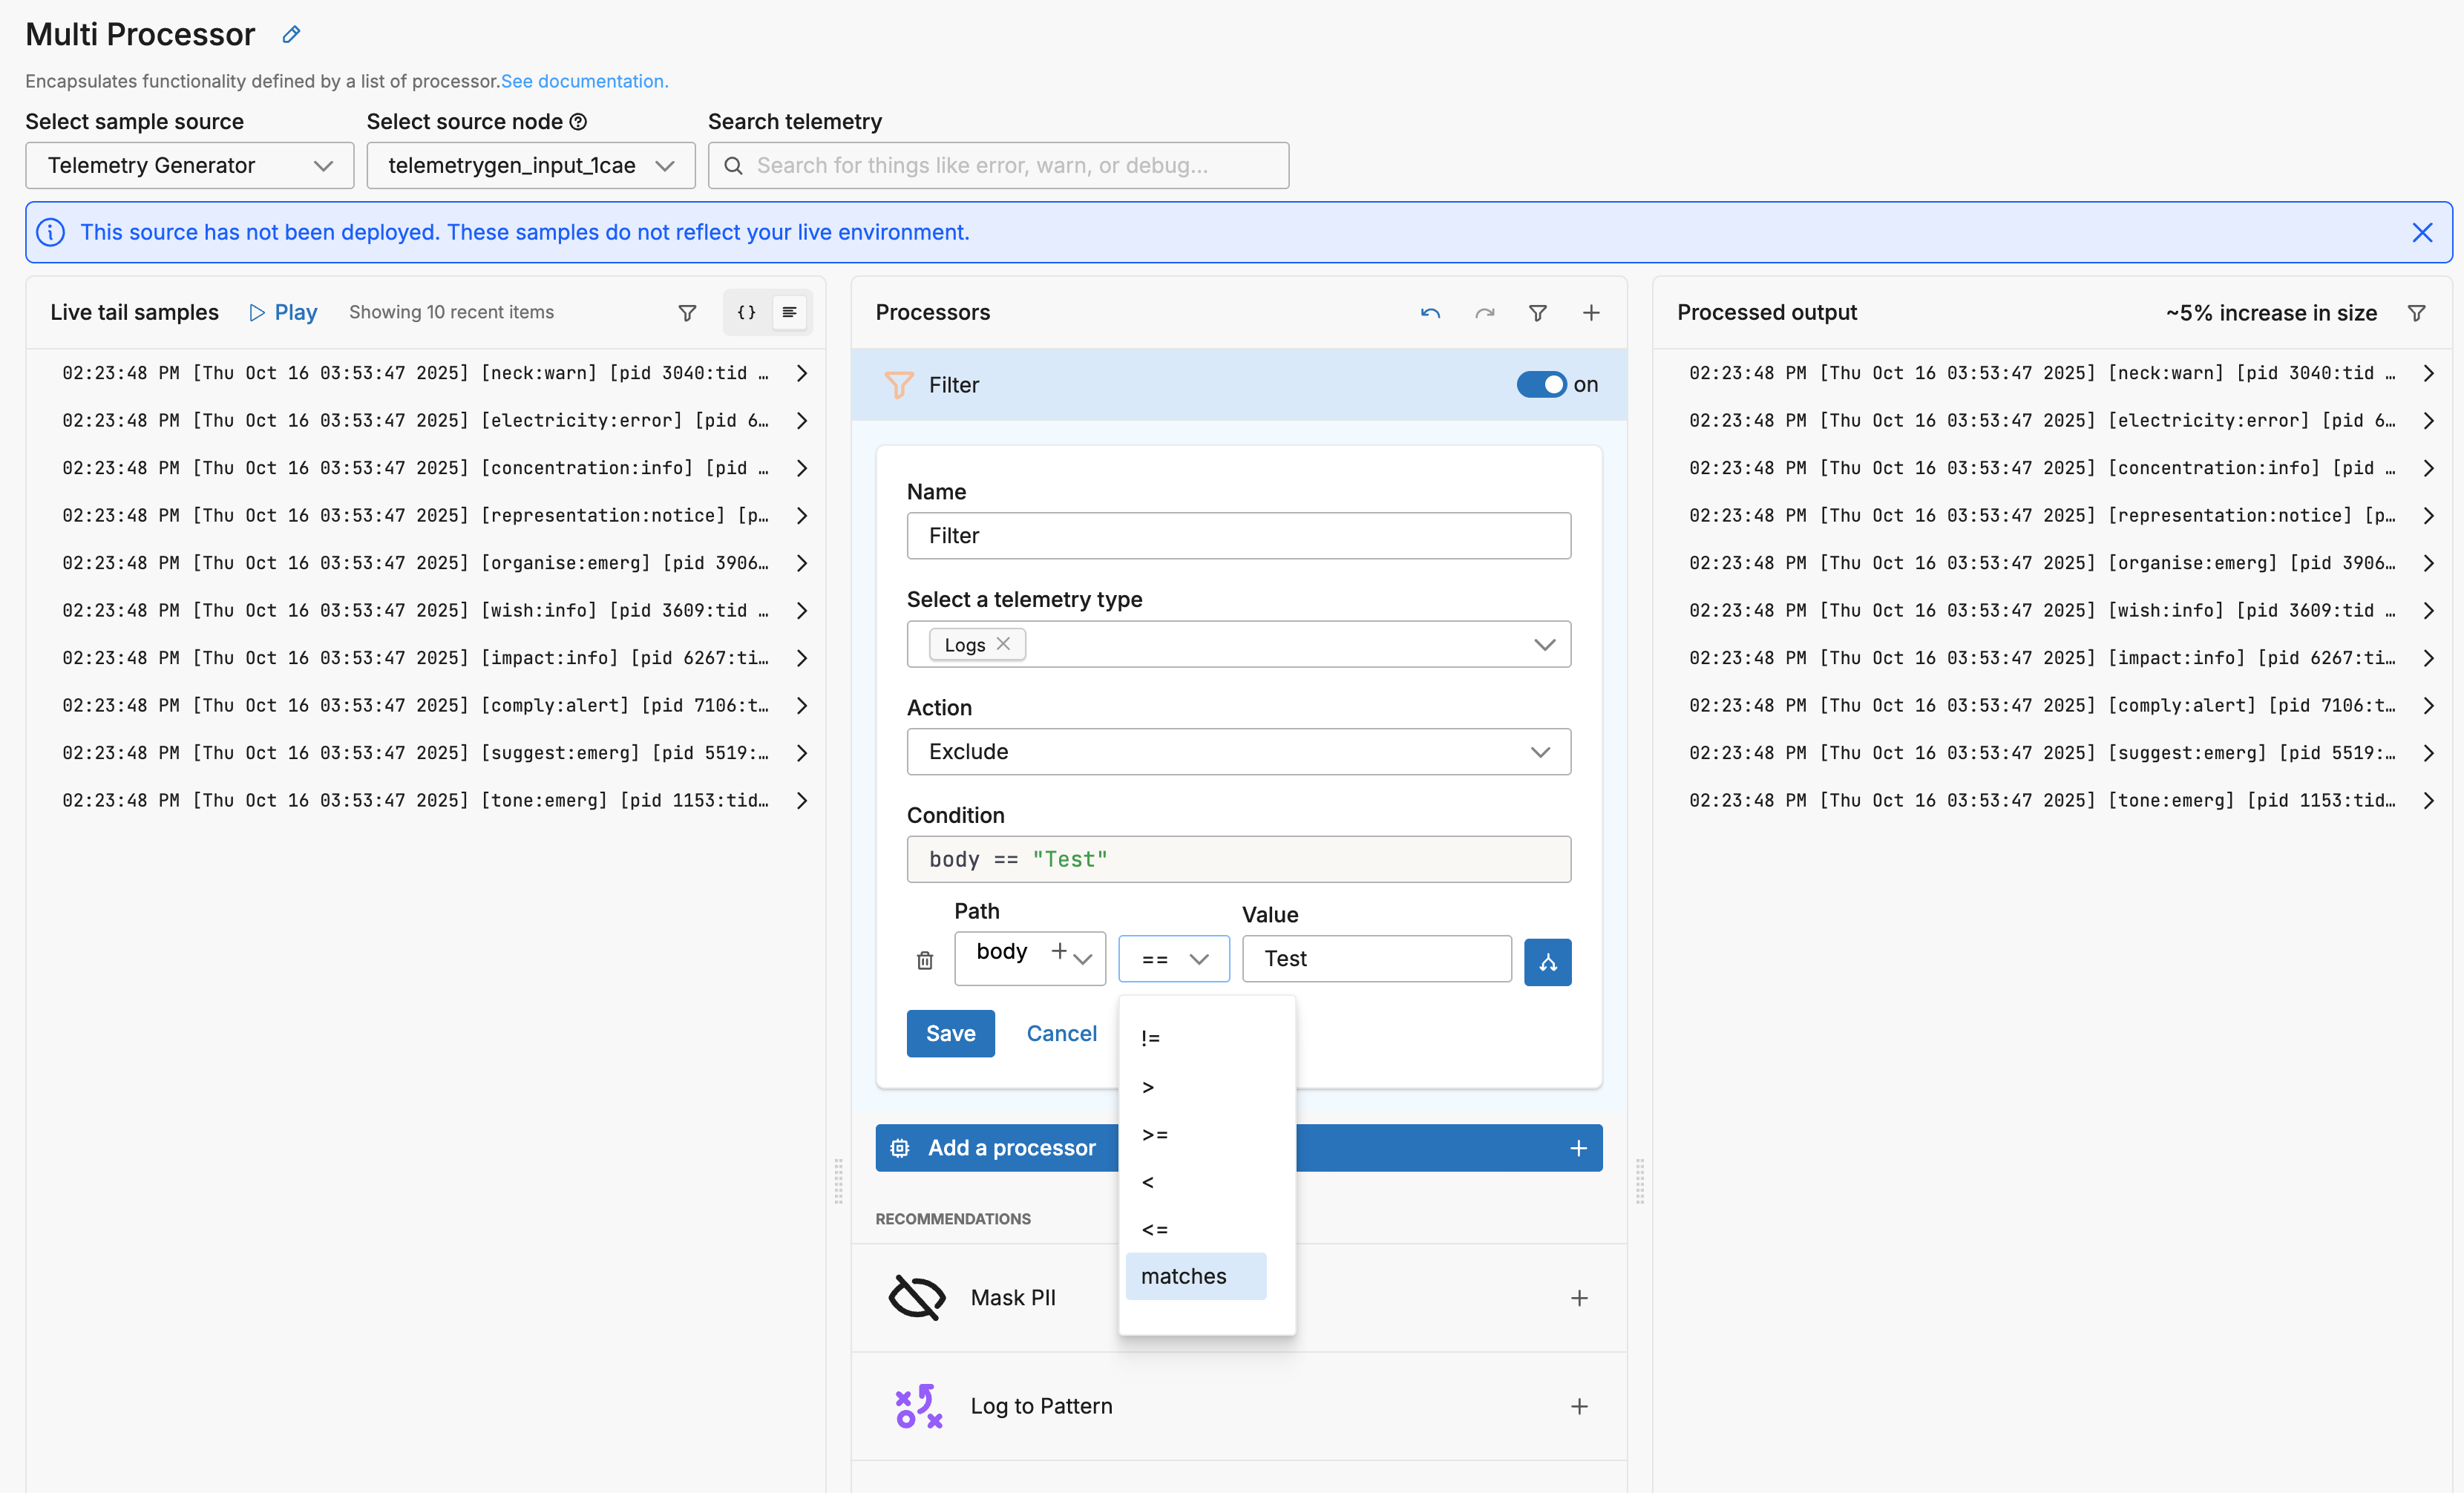
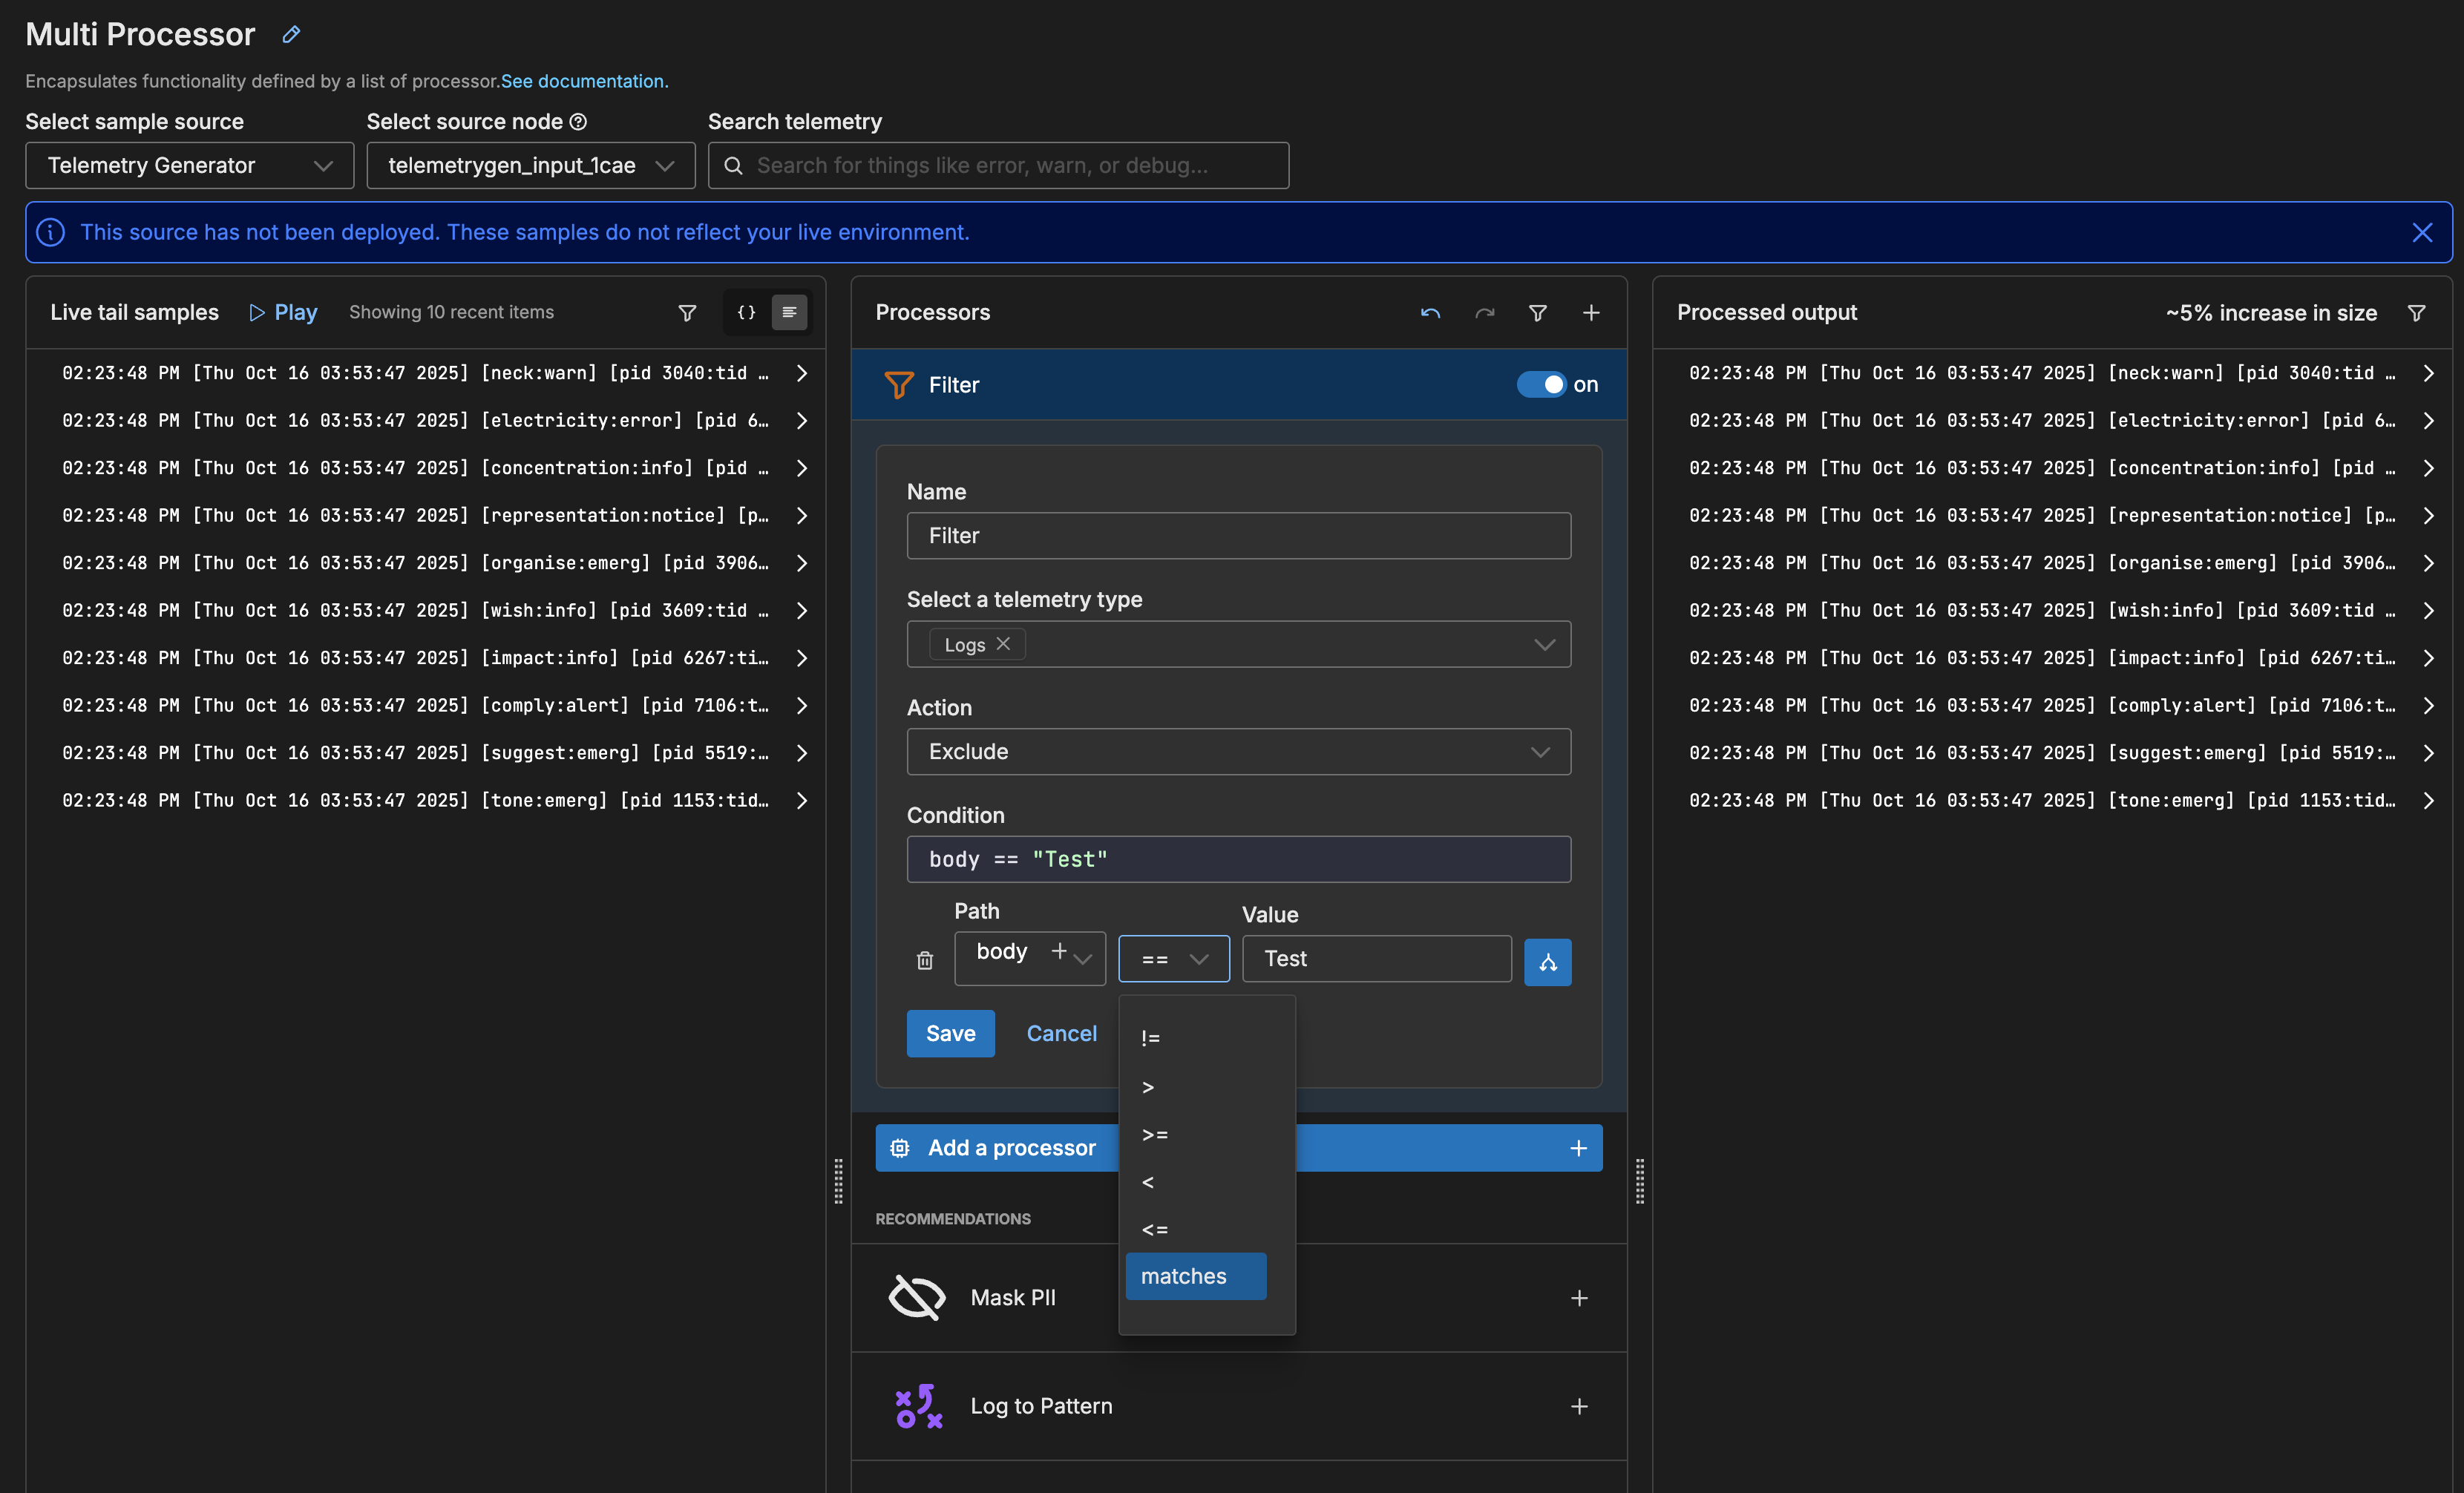
- Select matches as the operation. This configures the processor to use a regex match to find the value within the body field.
- Enter
debug]as the value. Autocomplete shows a preview of matching logs.
Note addition of the square brackets after the severity text and 1 after
trace. This regex context ensures that only the actual severity text is matched, and any mentions of these words in the message, for example, do not create false matches.

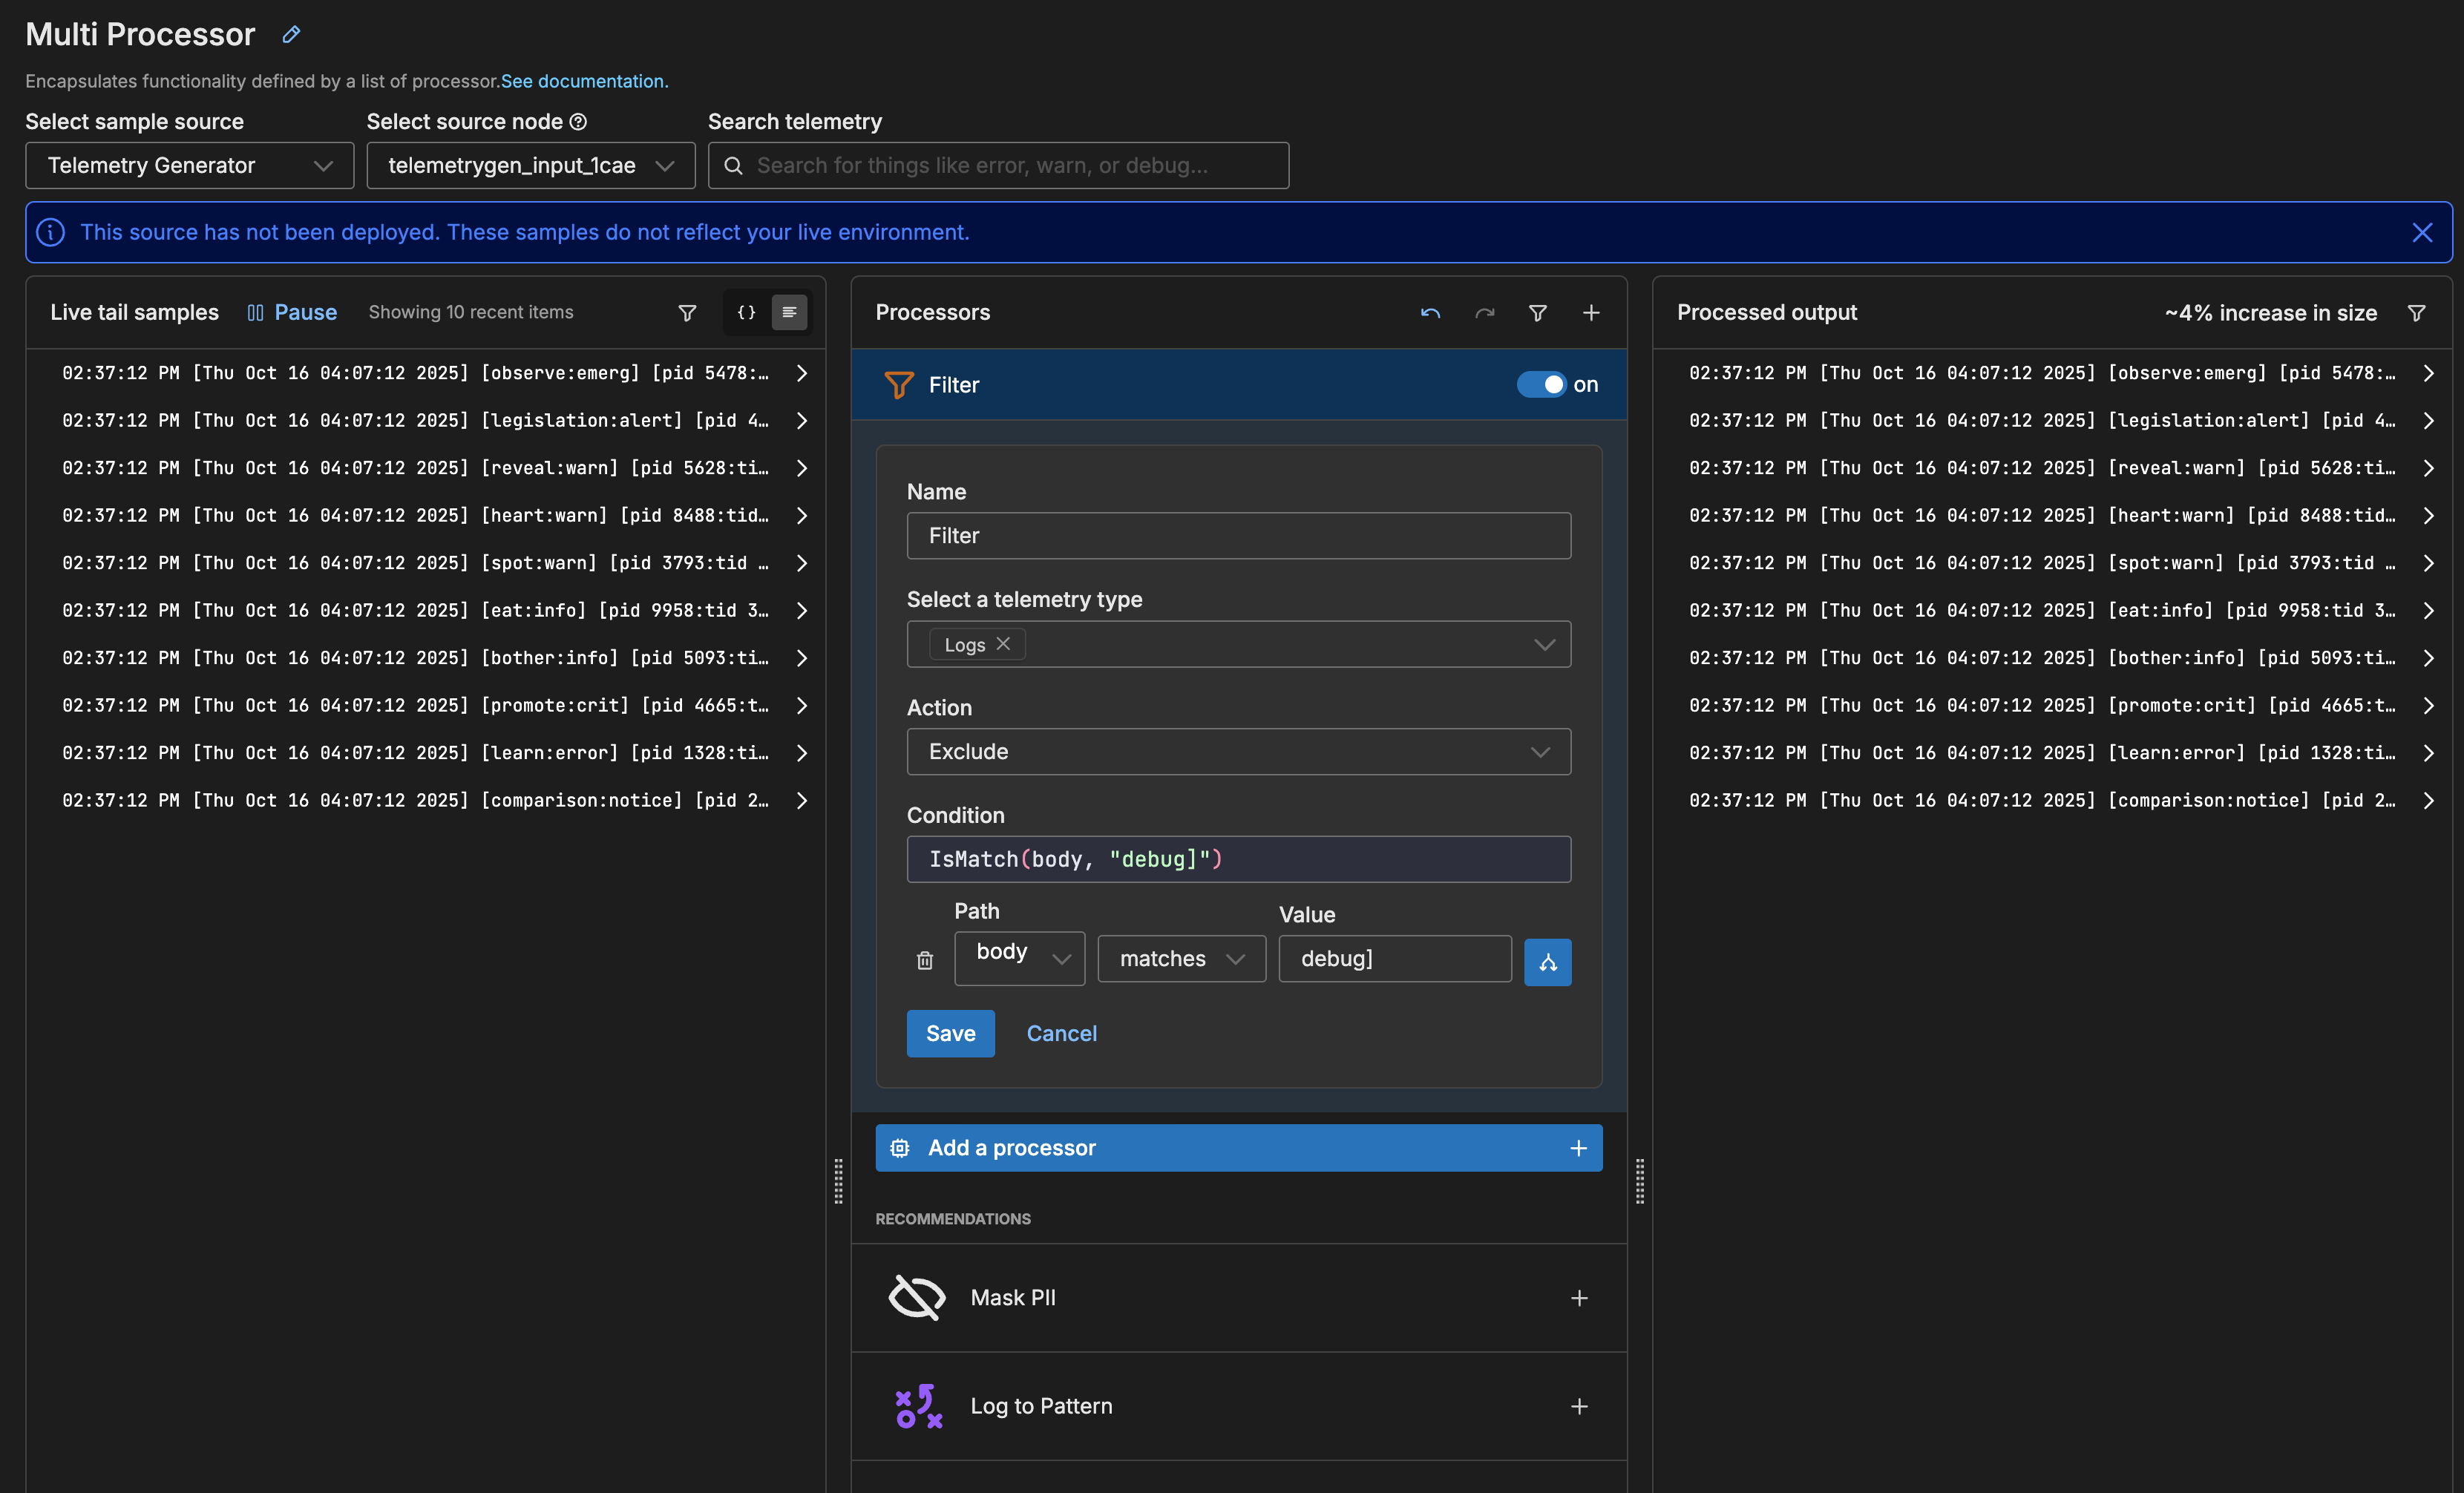
In the left pane, any visible logs containing debug] are marked red to show they are dropped. At the top of the right pane, an 4% decrease in size after processing is predicted.
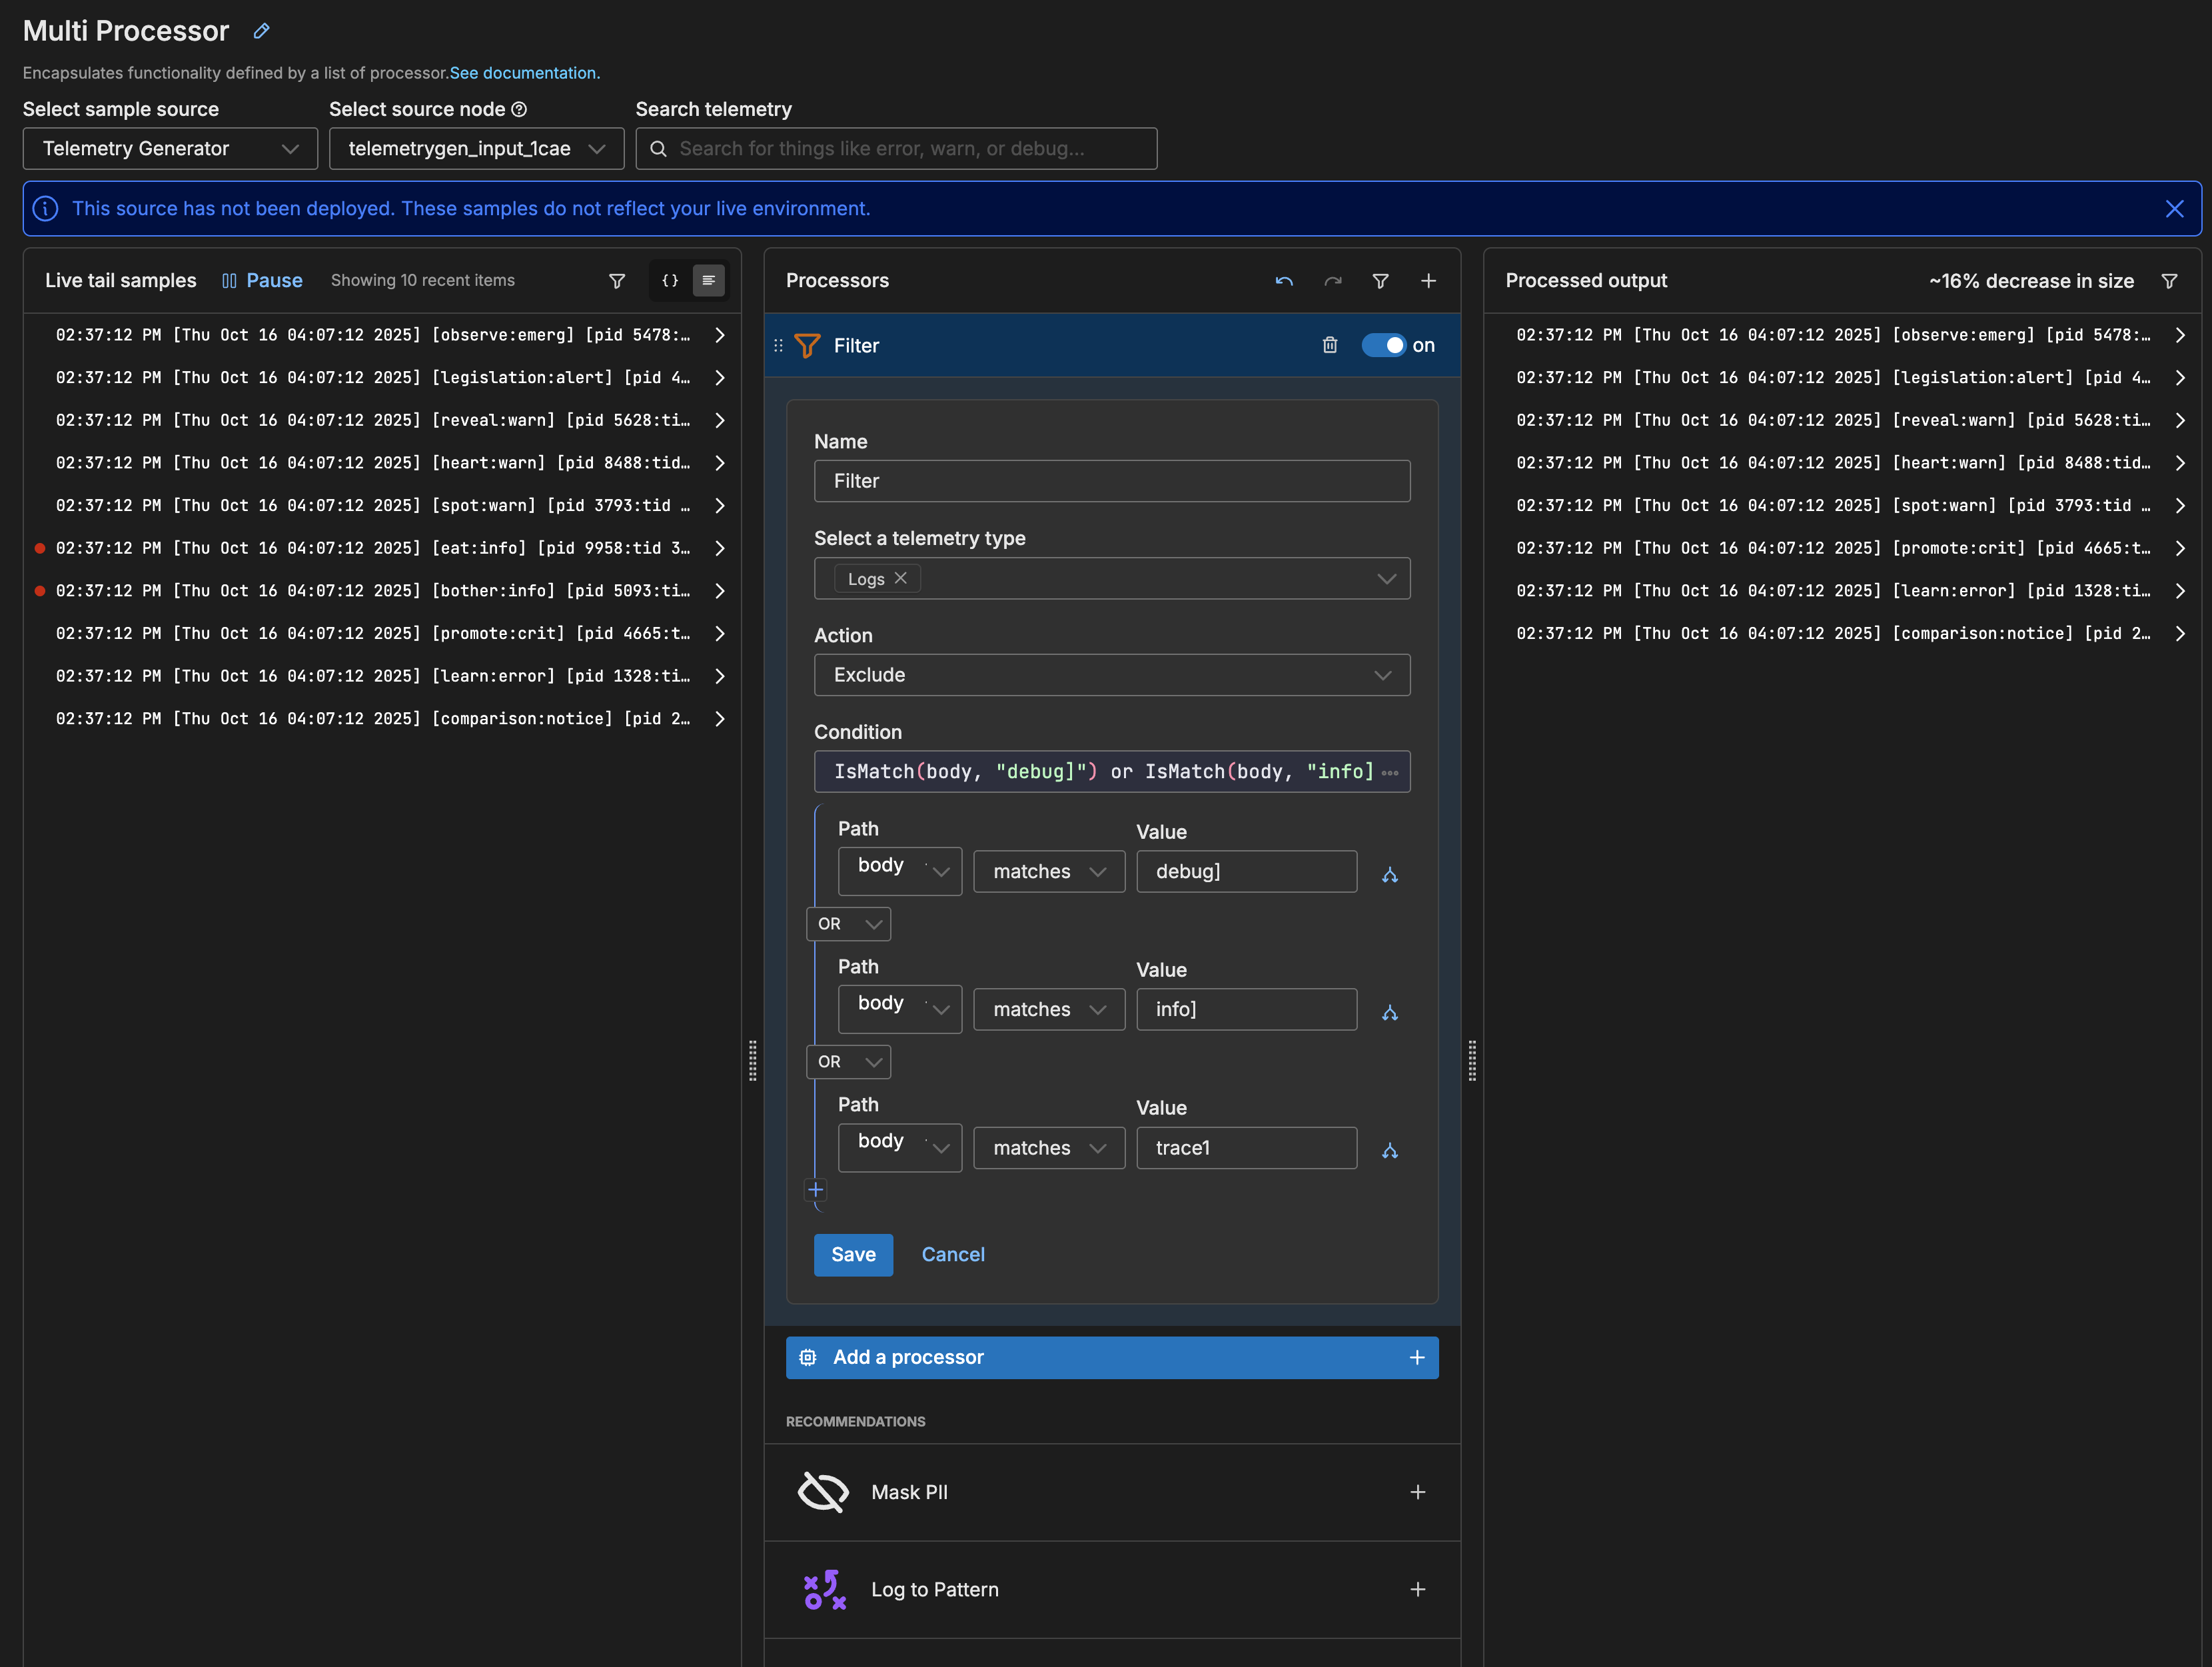
- Click Add nested condition to specify as second condition for the next severity type.
A second condition is added but it has the AND logical operator.
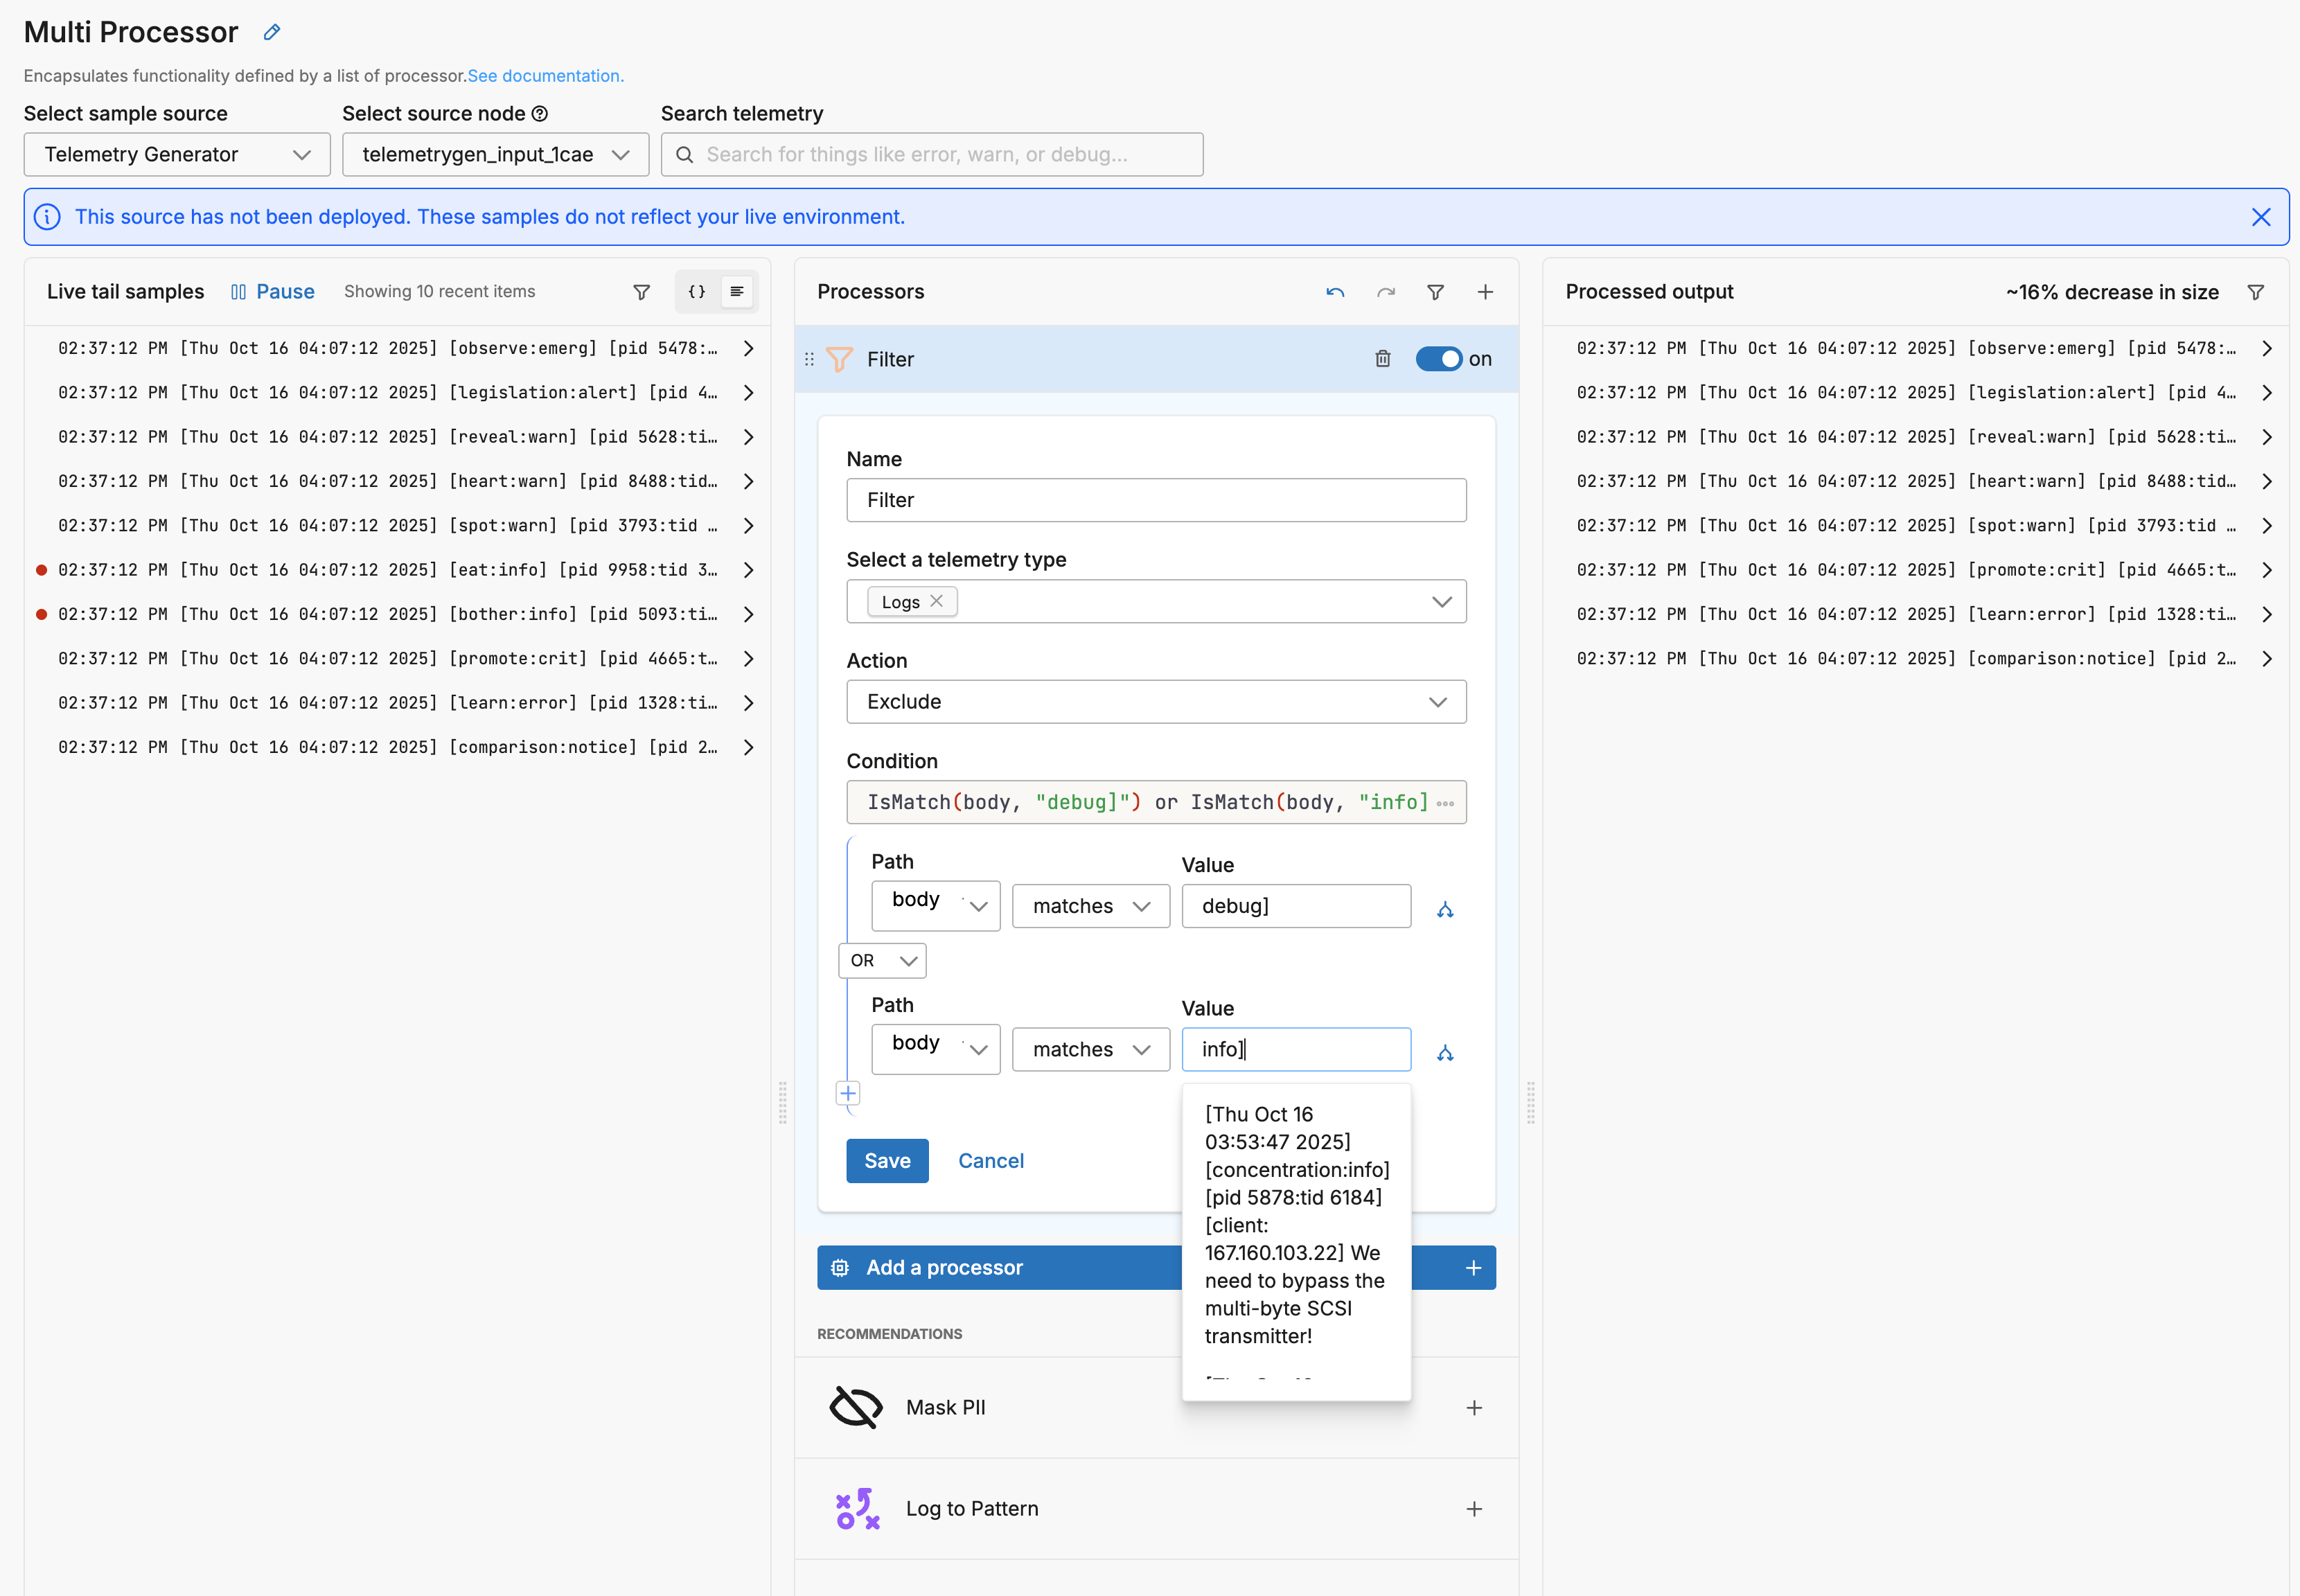
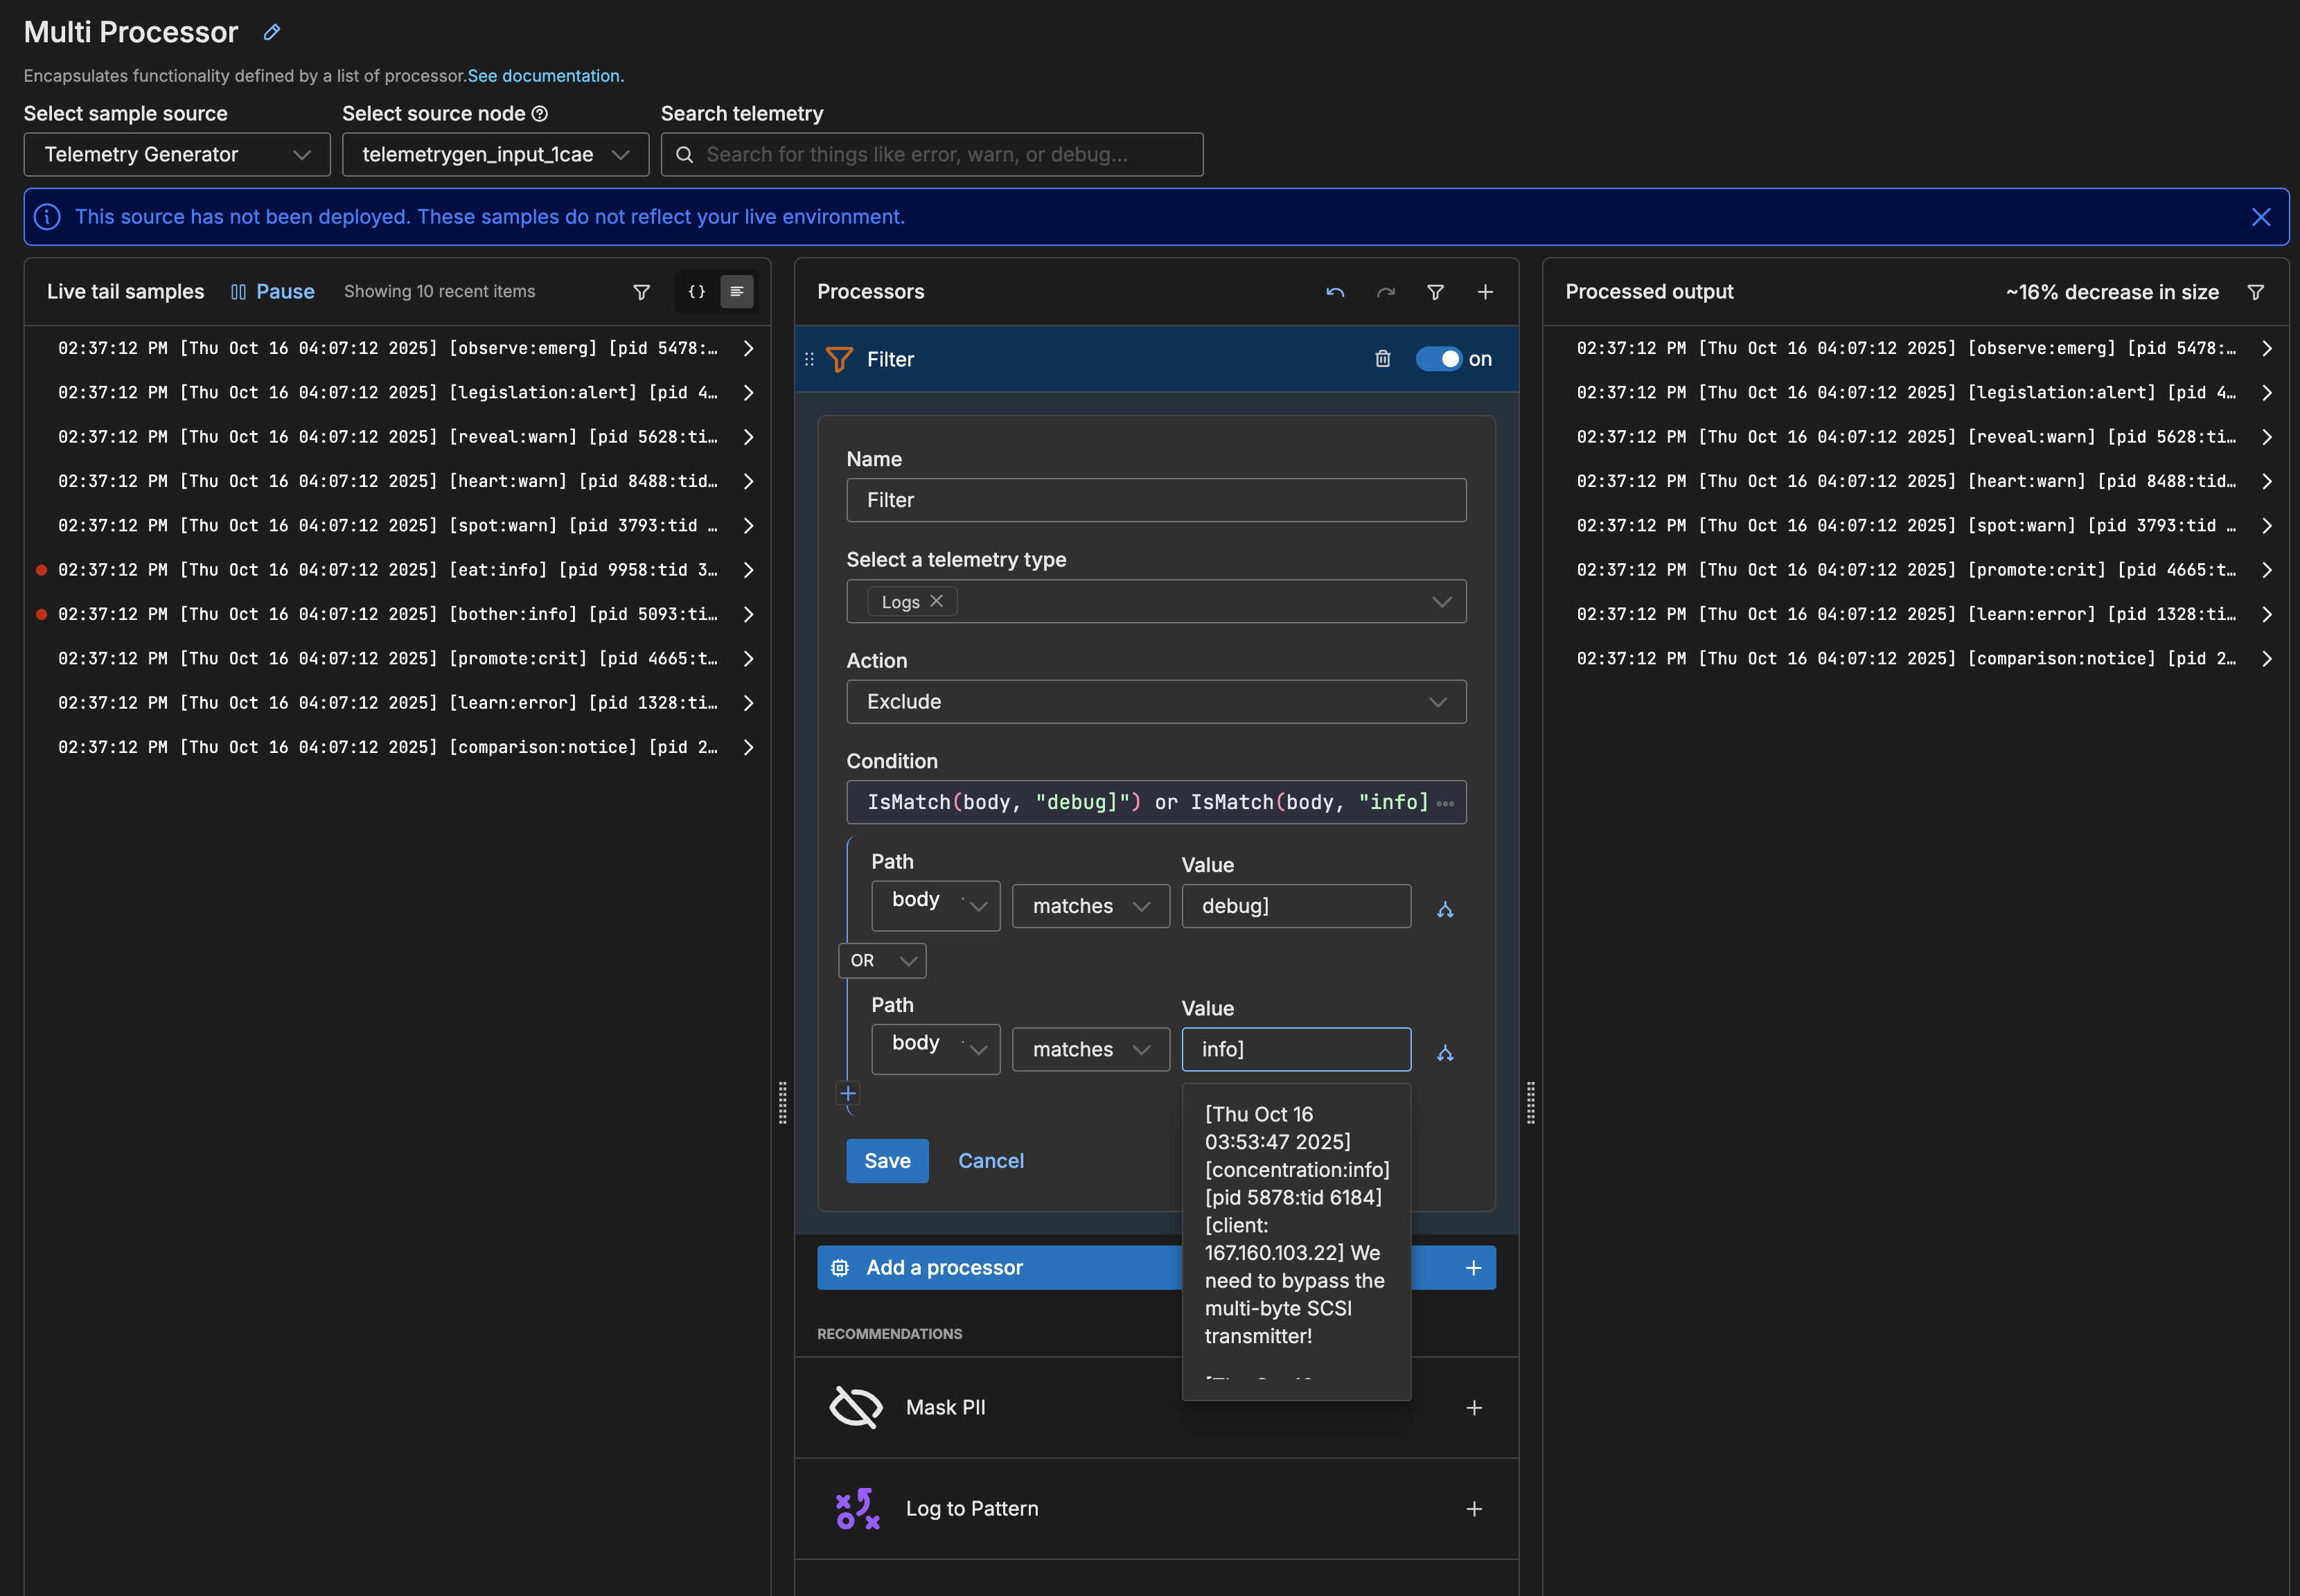
- Change the logical operator to OR.
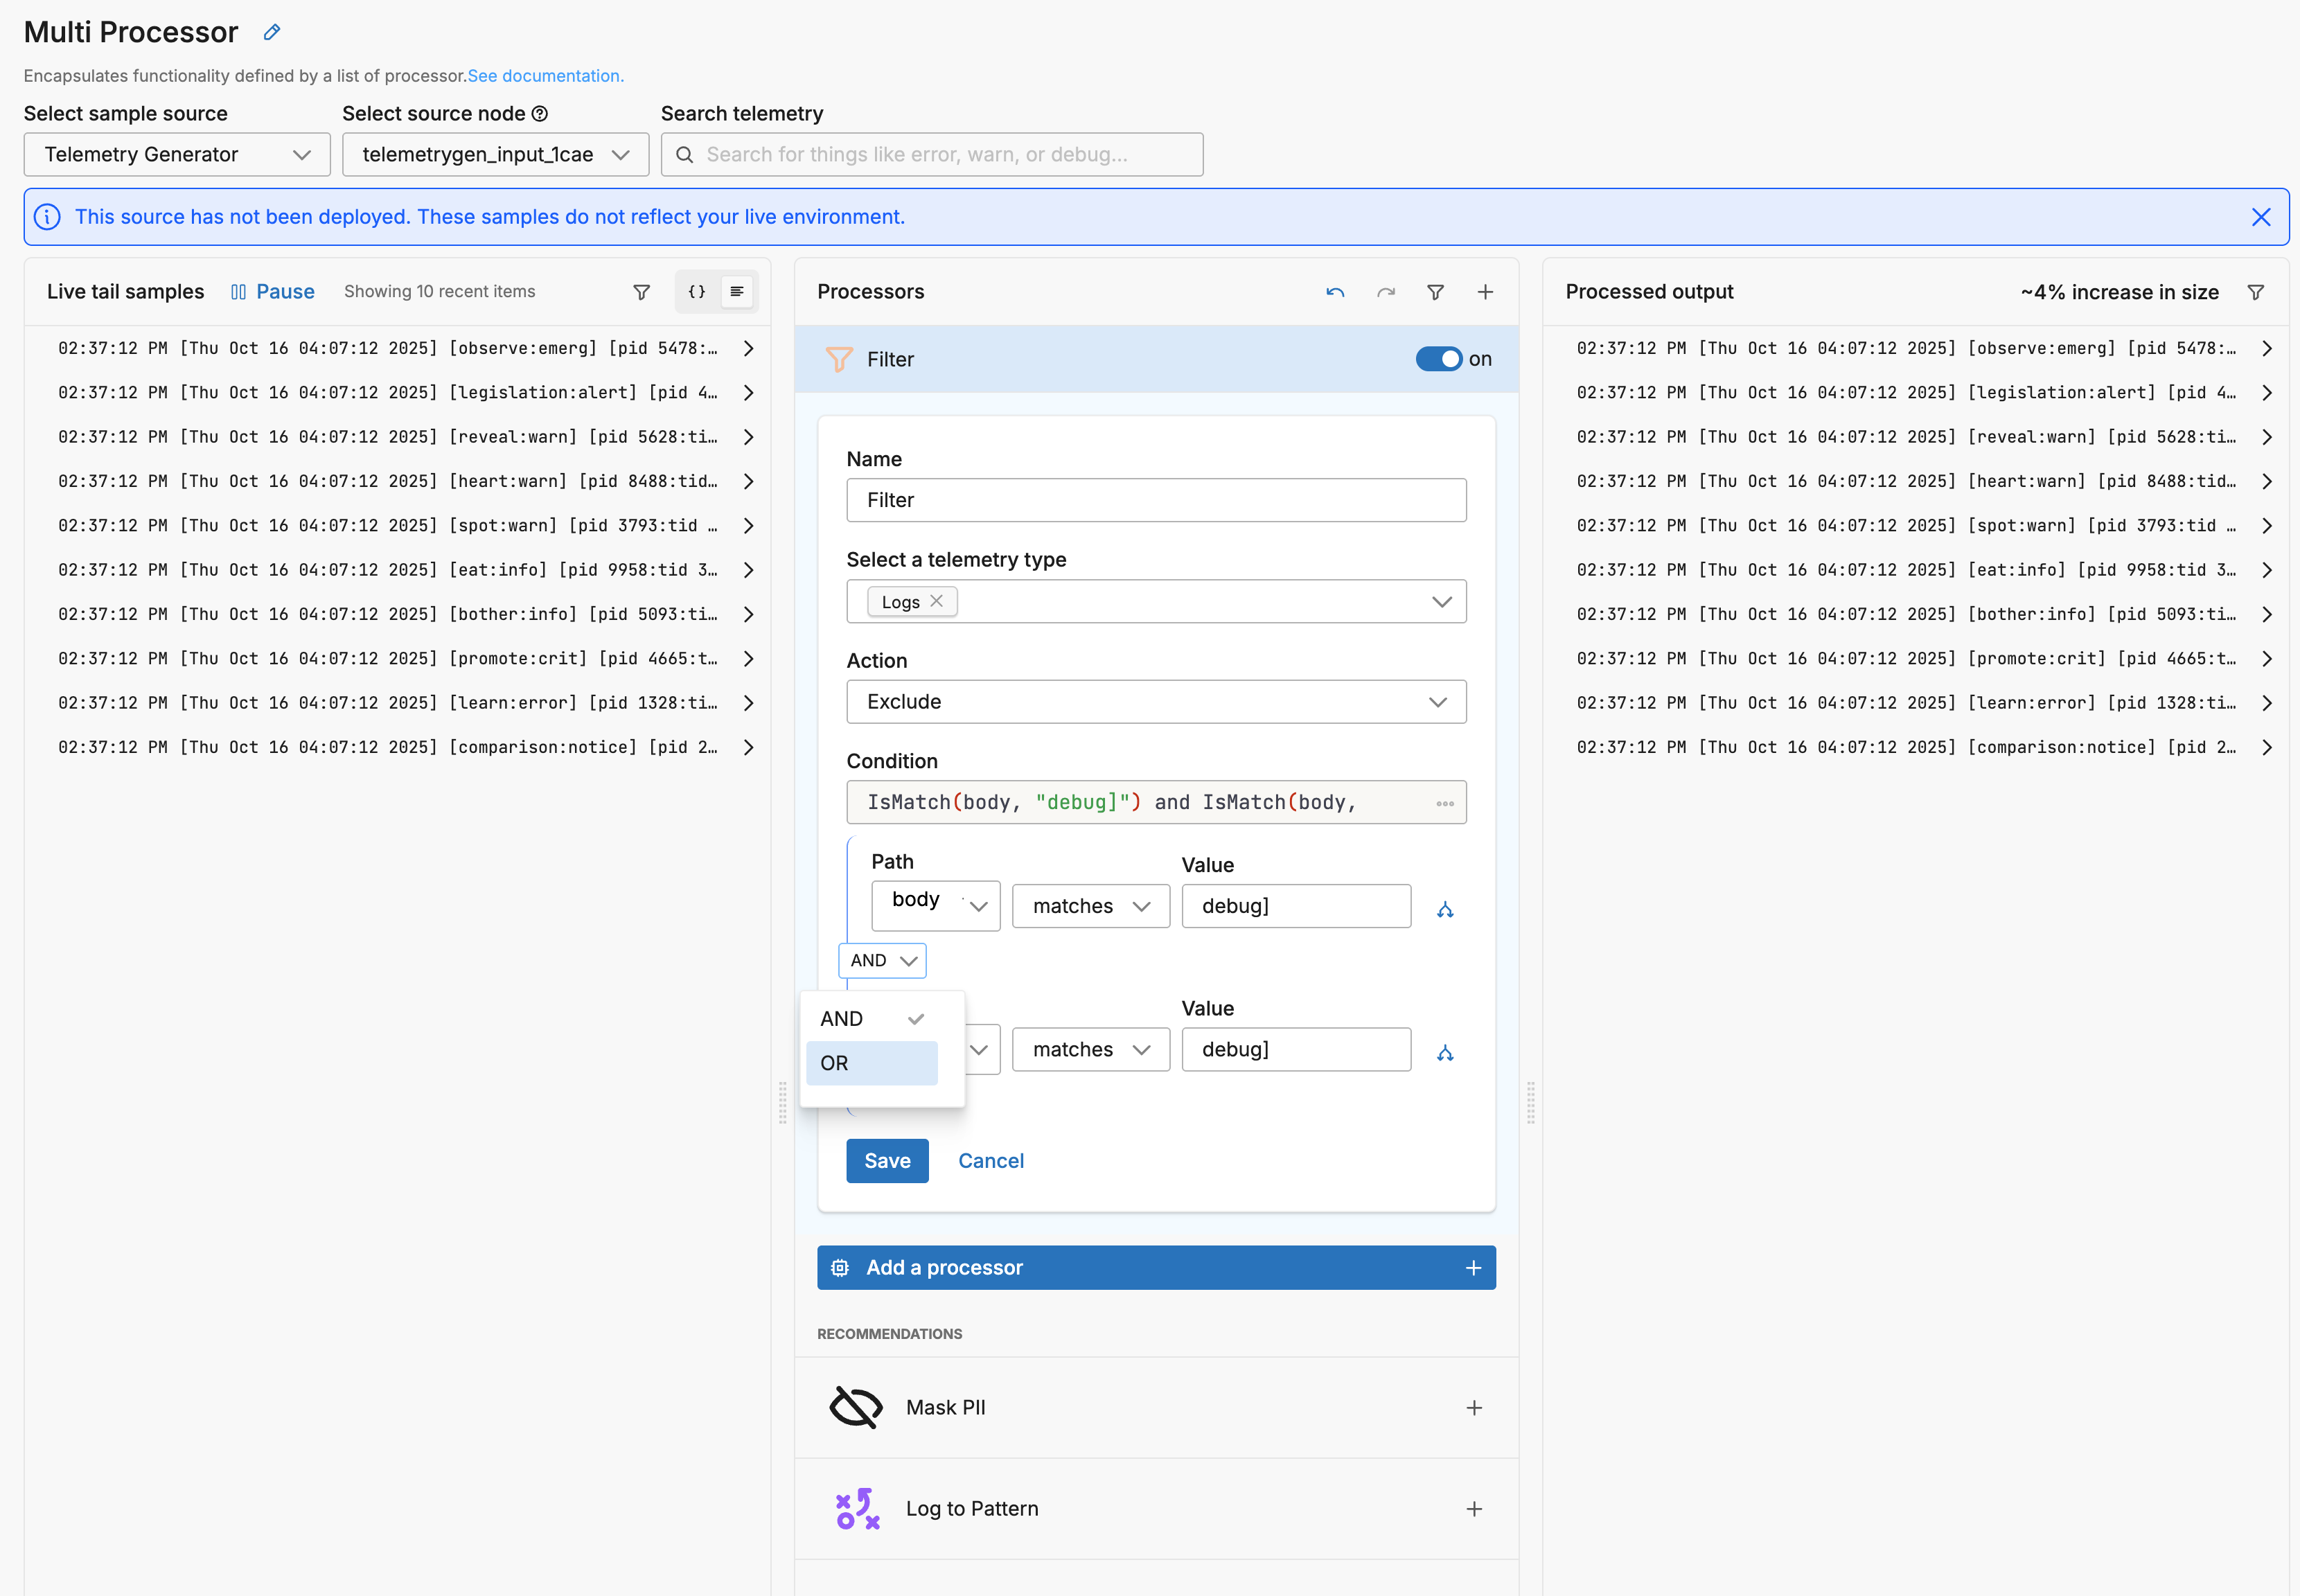
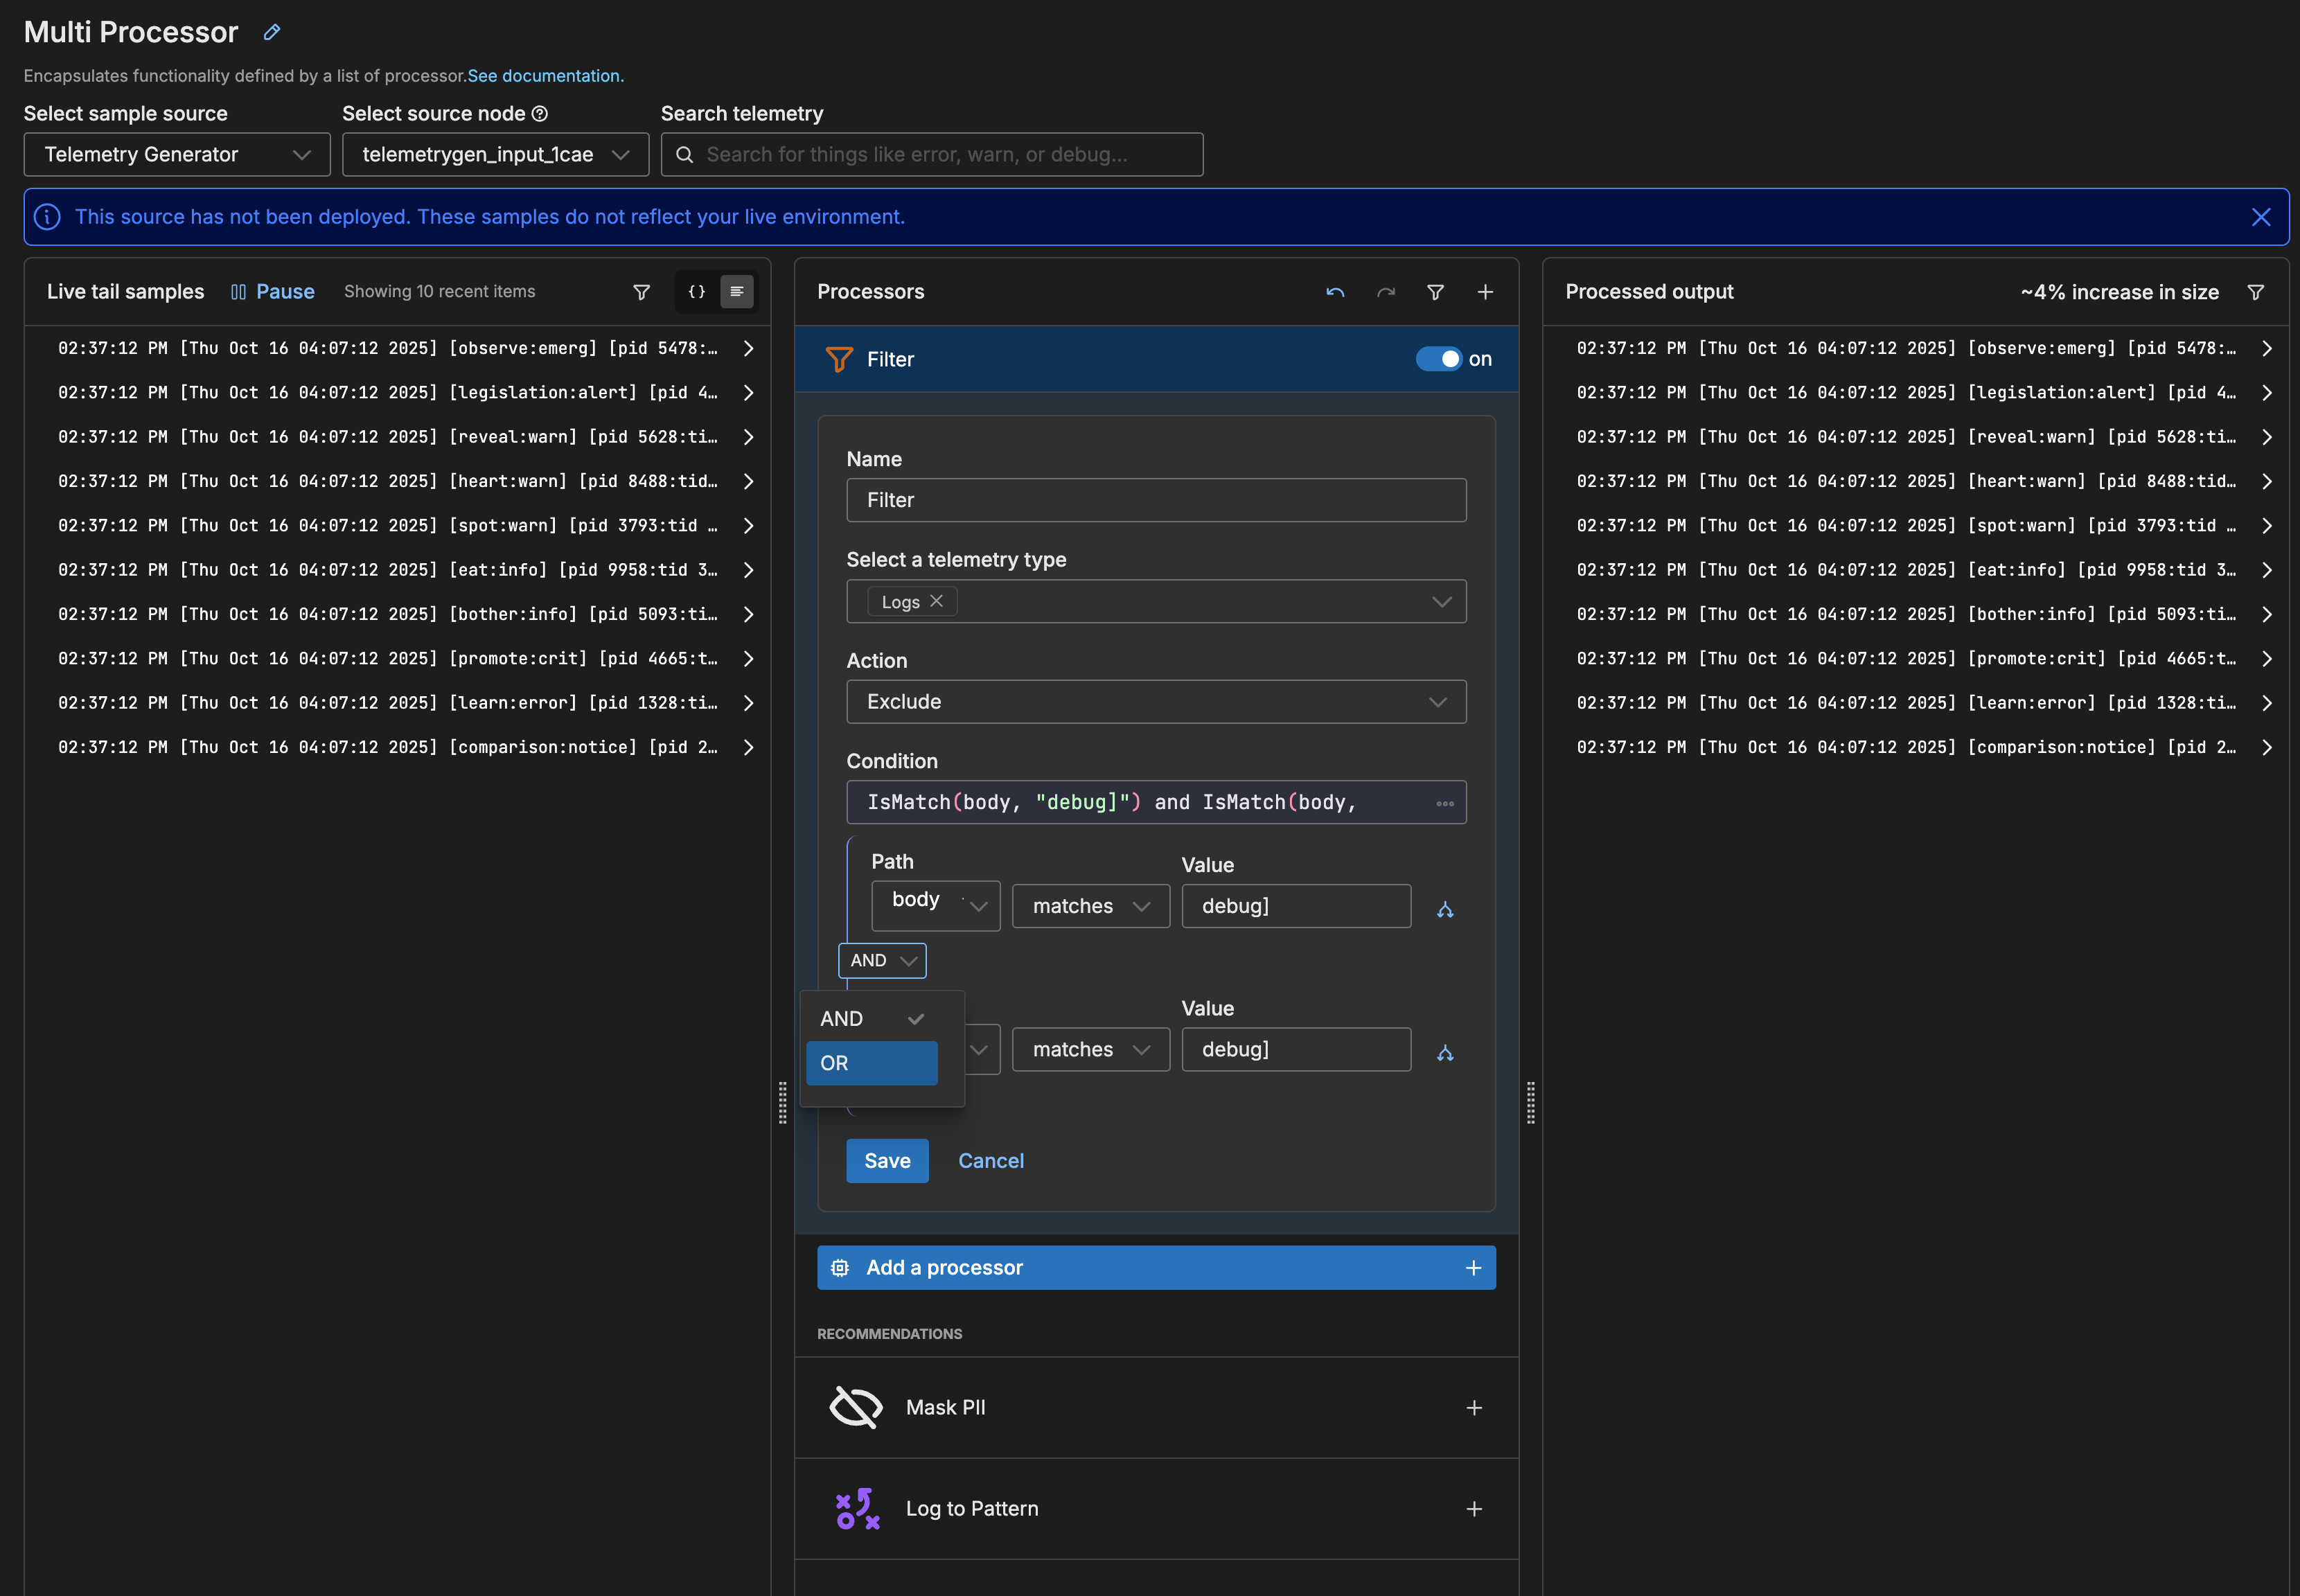
- Configure the condition as before, to search the body for matches on
info].
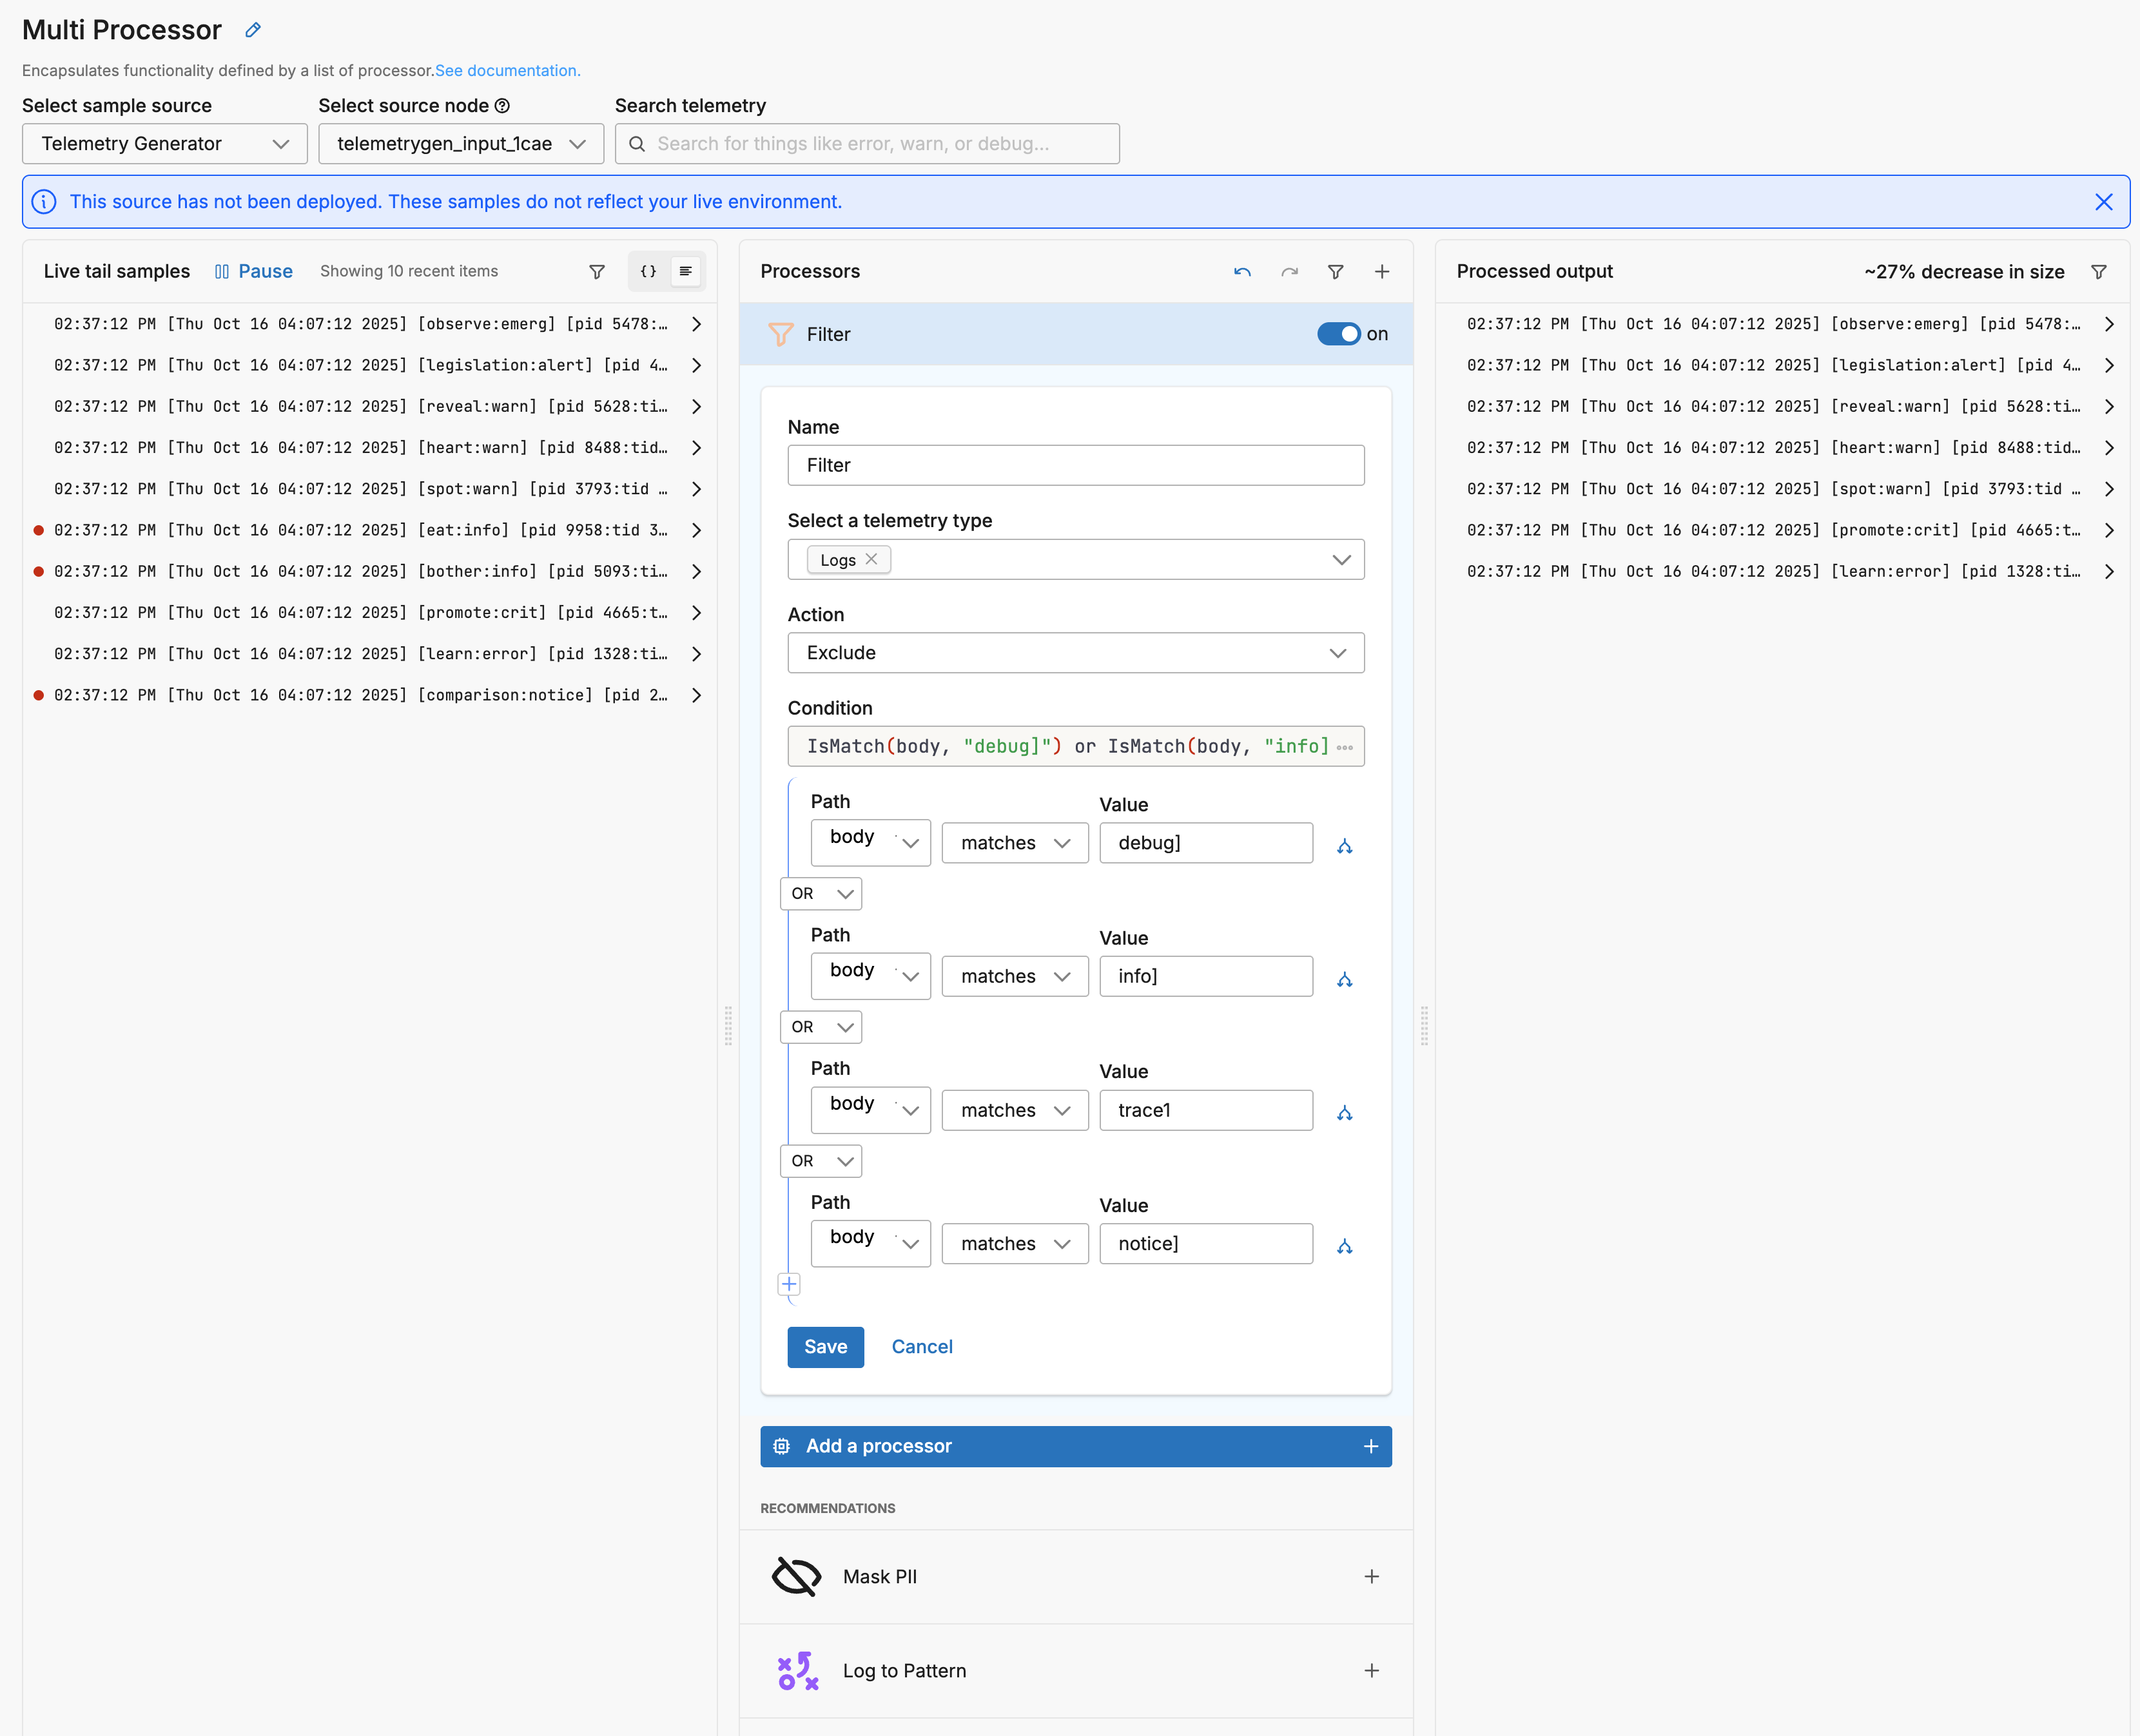
- To add the next condition, do not add a nested condition, rather select the Add Condition button.
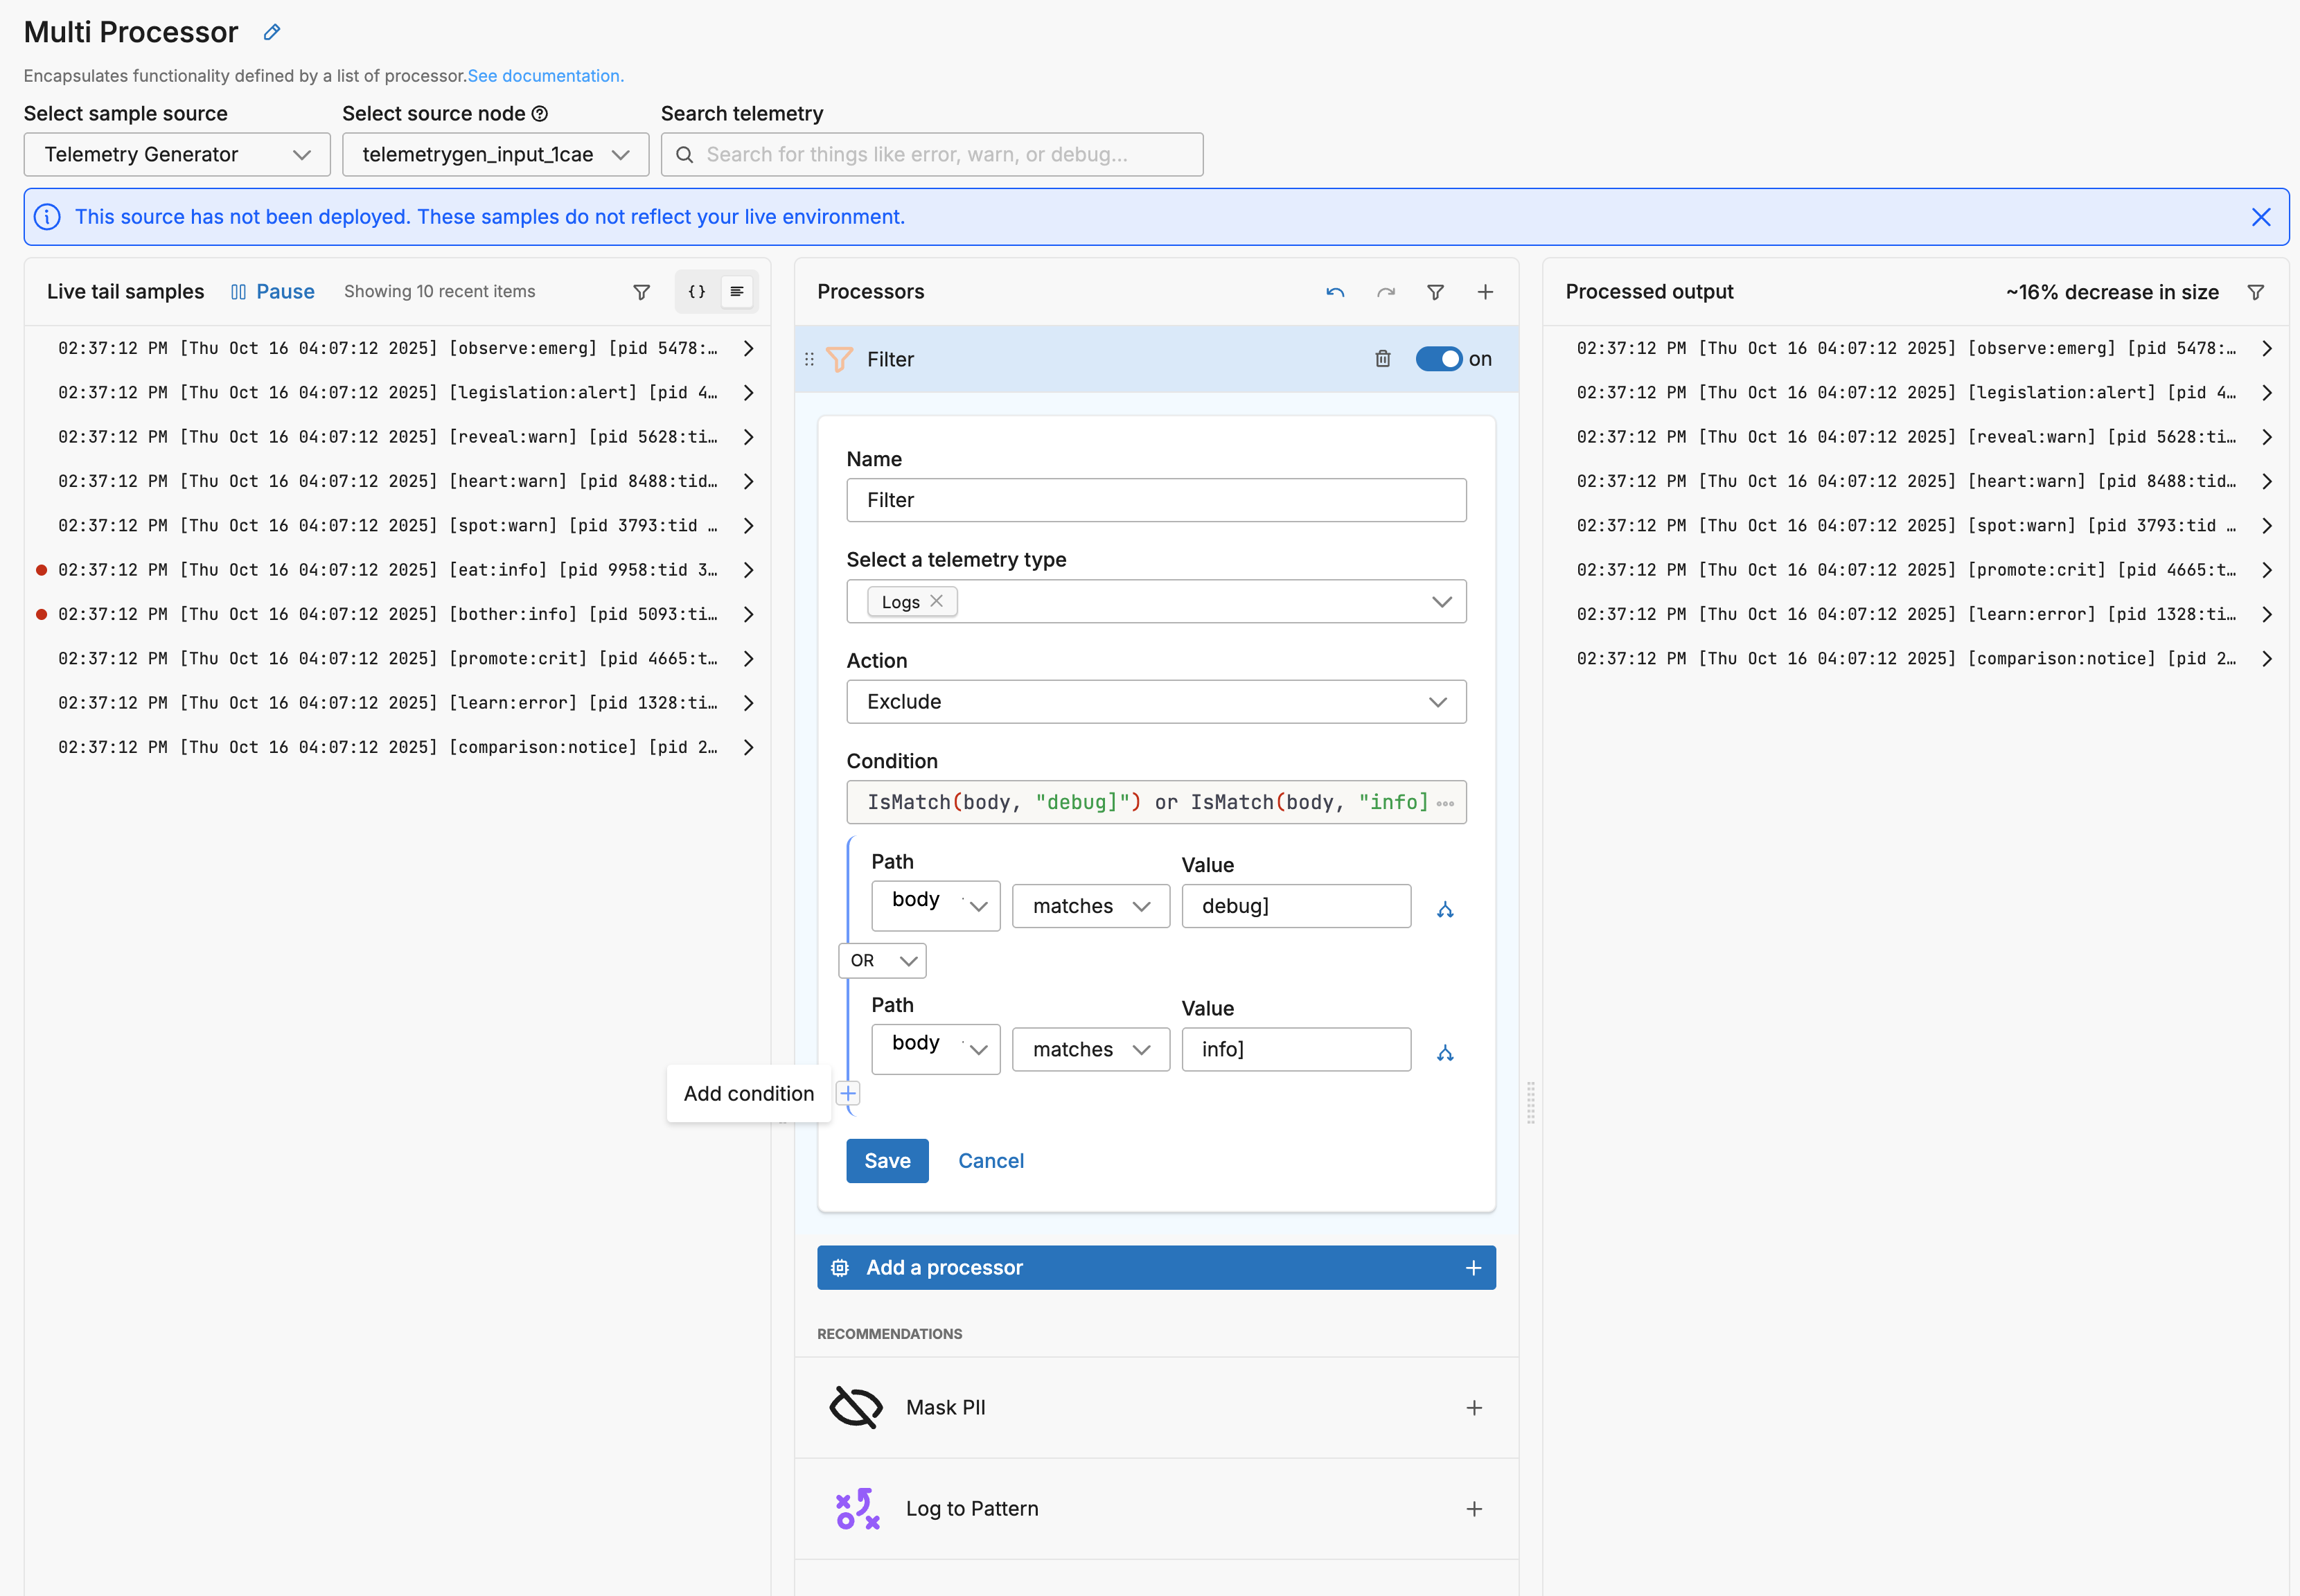
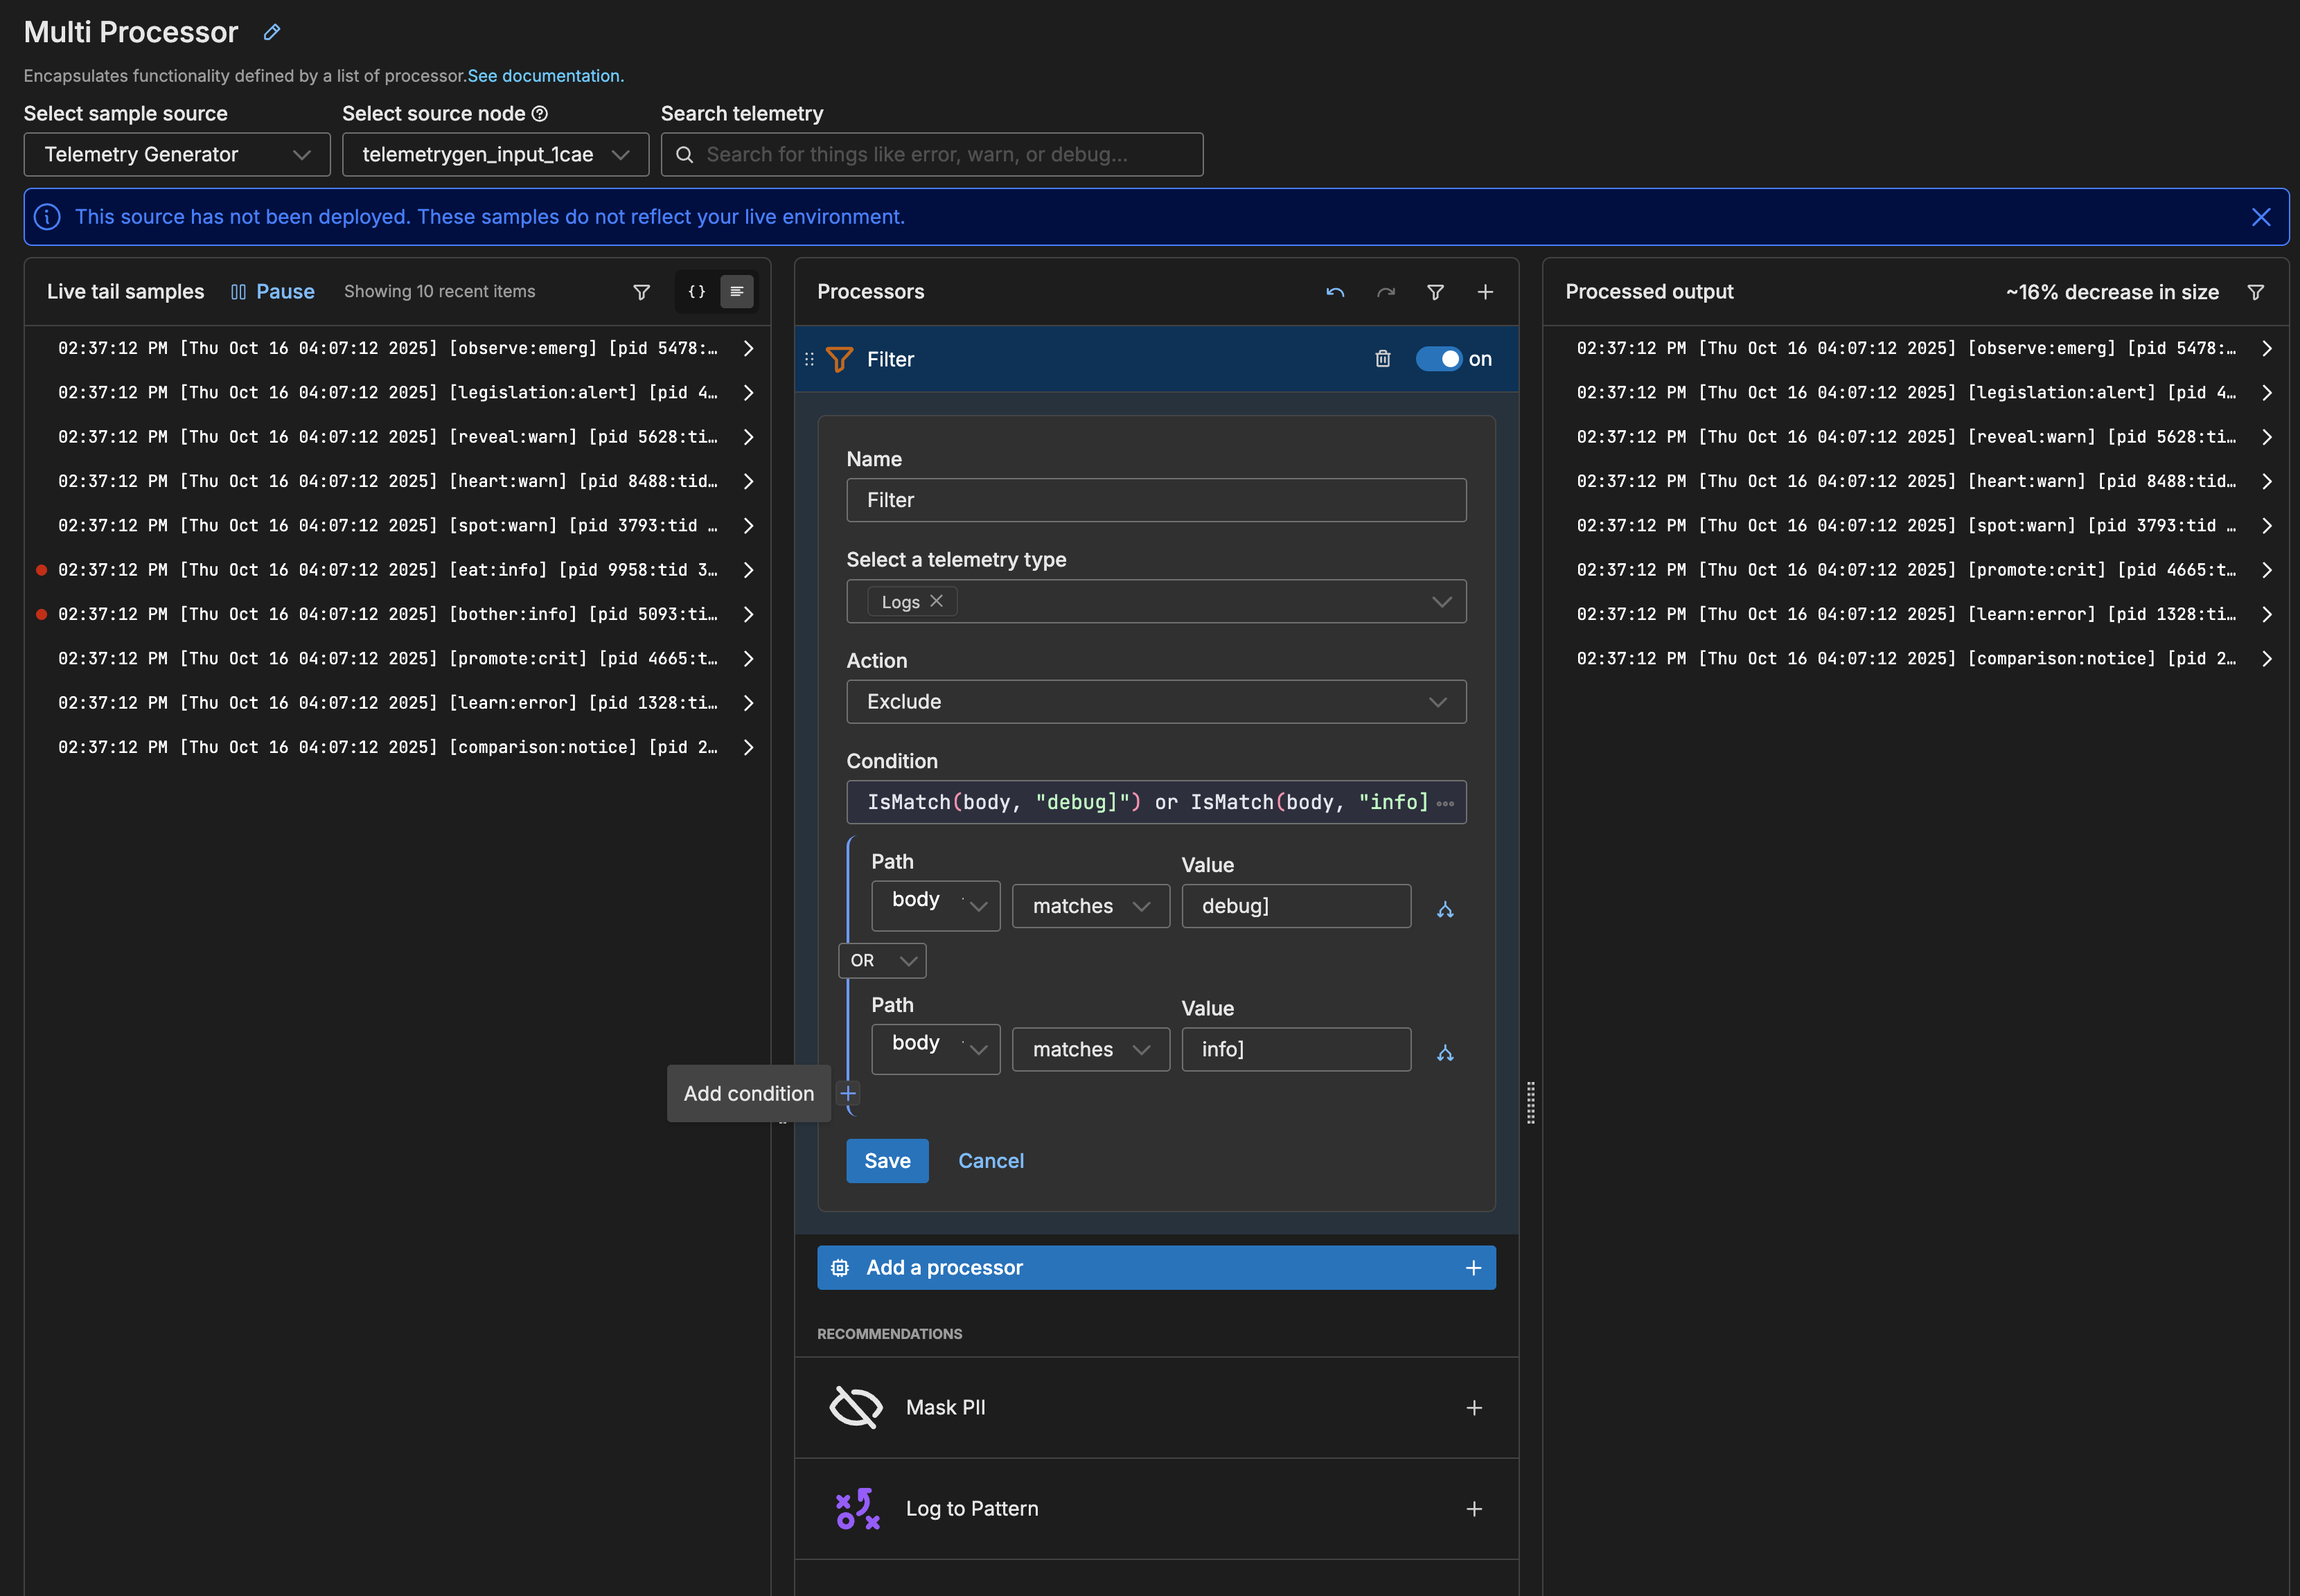
- Again, specify an OR logical operator, configure the processor to search the body for matches on
trace1.
- Lastly, add another condition, specify an OR logical operator, configure the processor to search the body for matches on
notice].
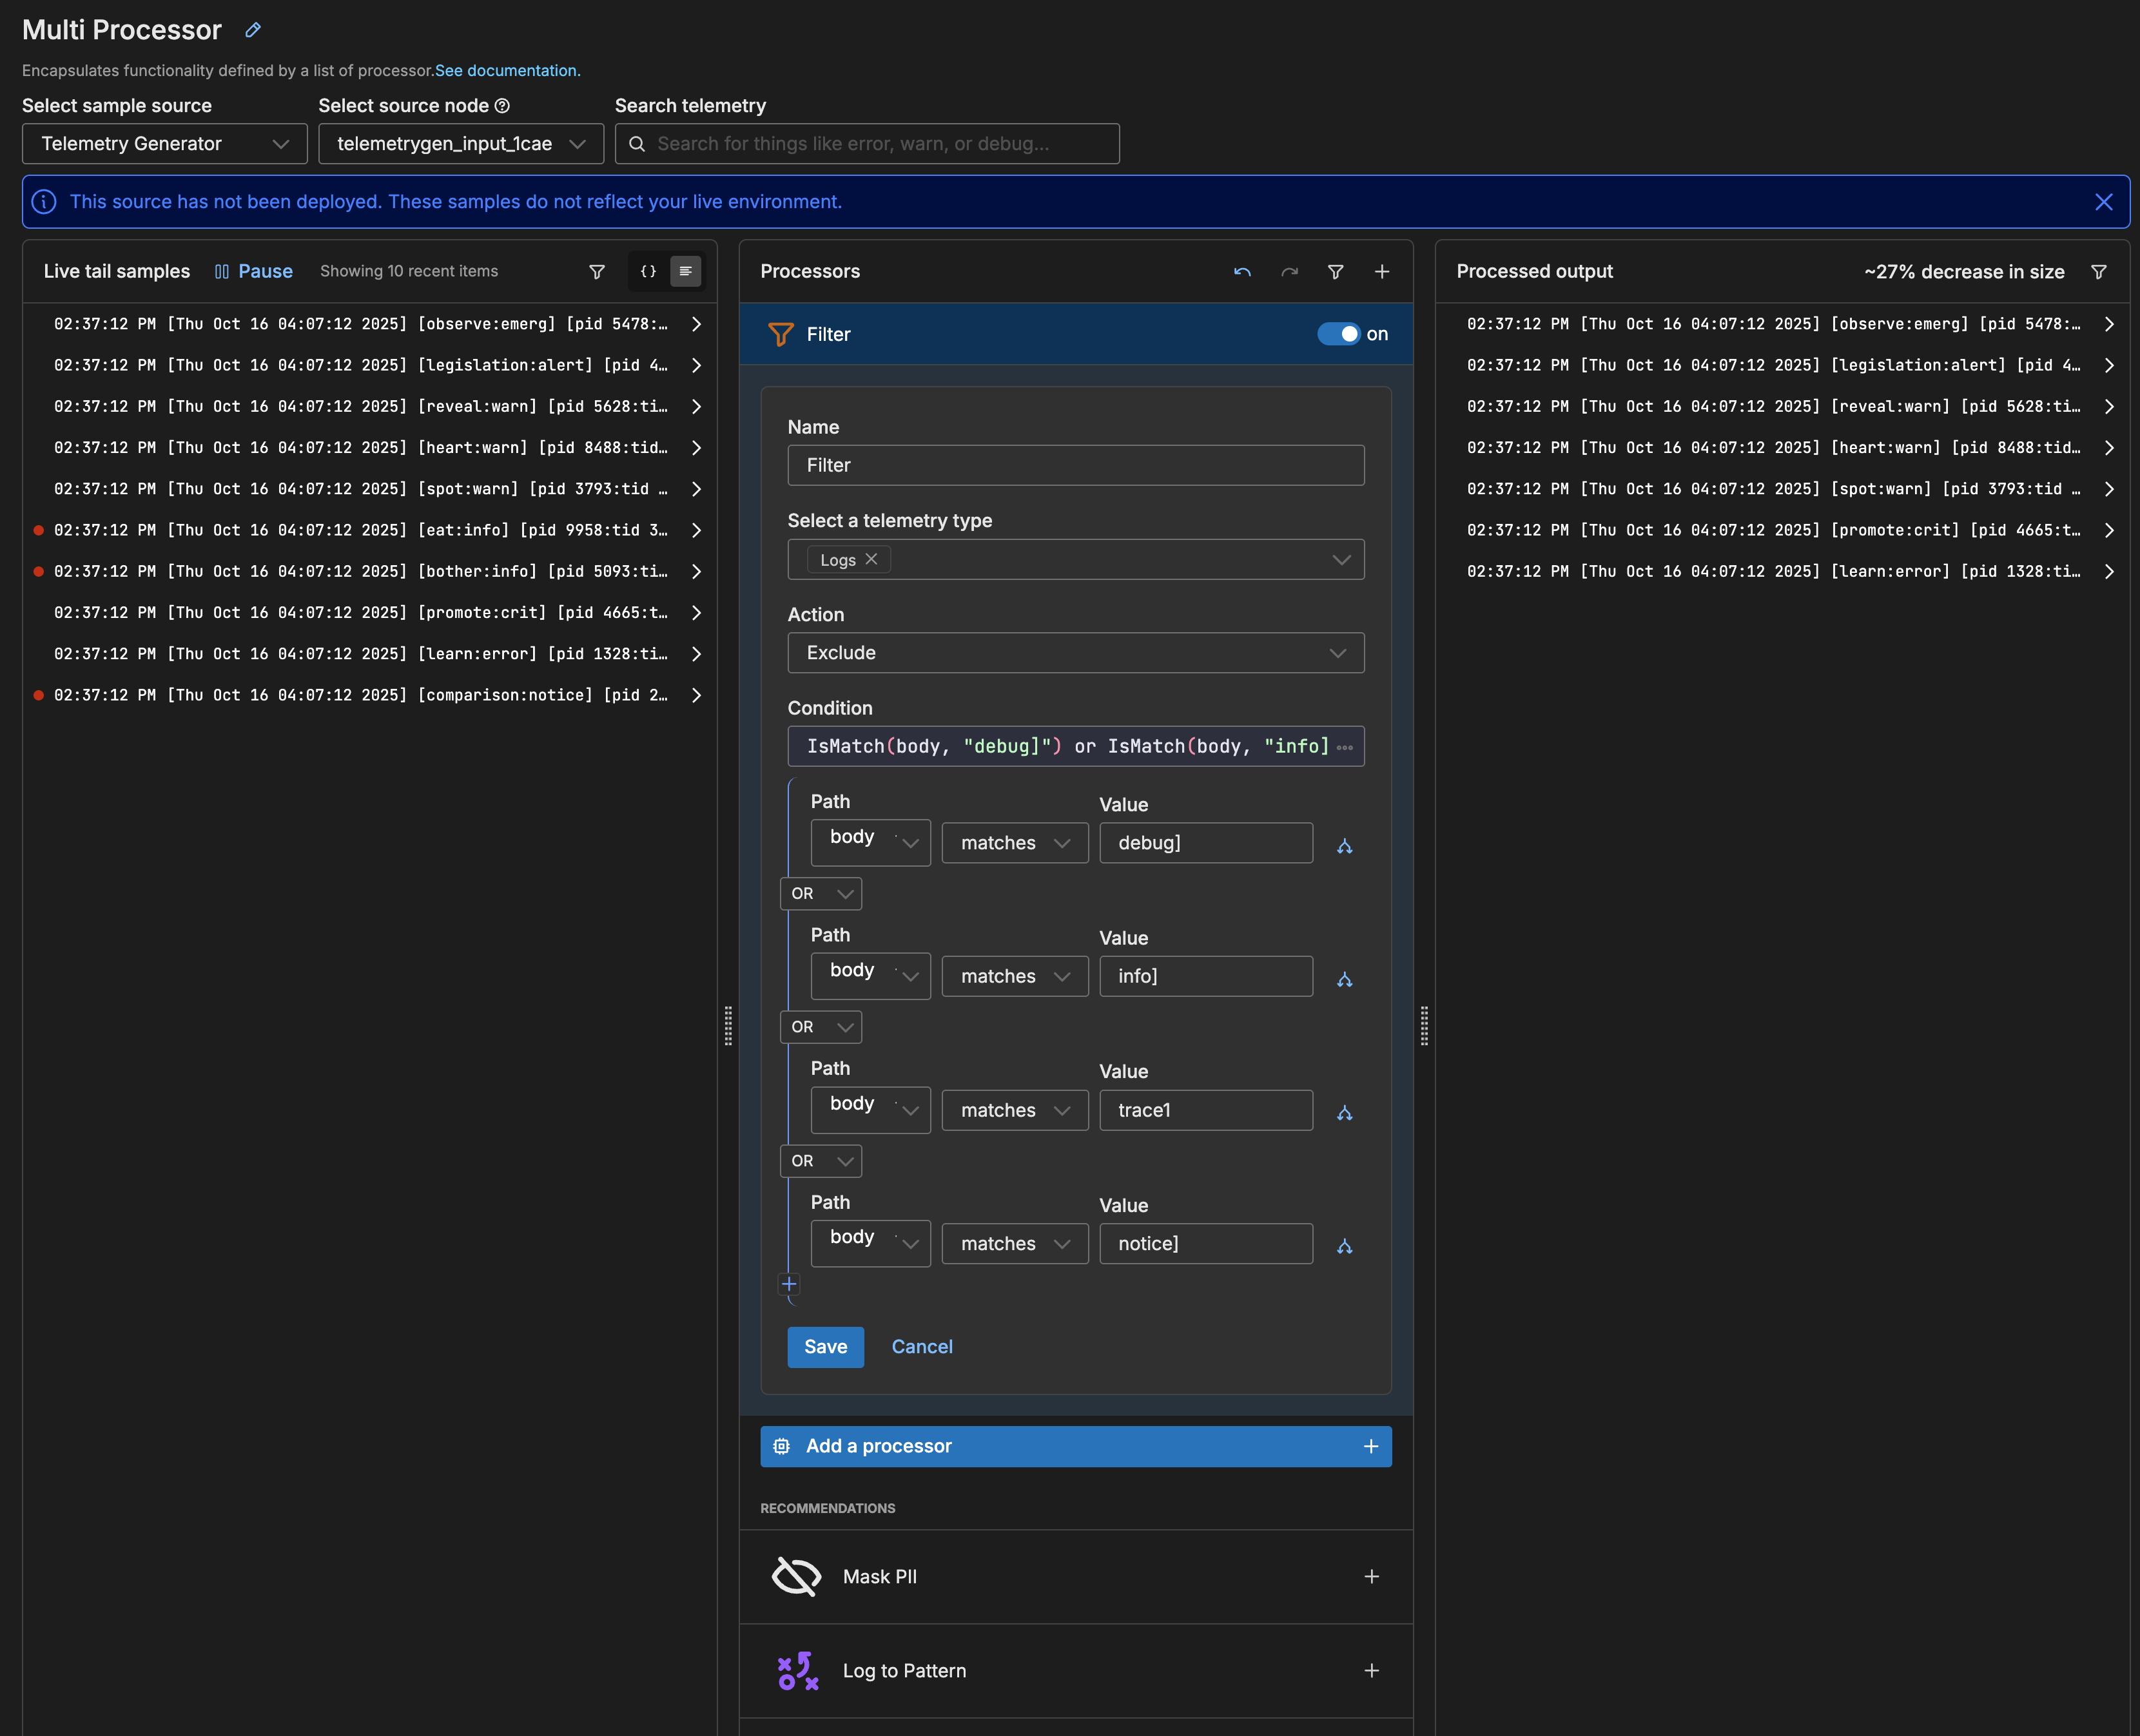
4. Save Changes
Click Save on the filter processor.

At this point, the log volume is estimated to decrease by around 69%.