Edge Delta Aggregate Metric Processor
12 minute read
Overview
The aggregate metric function performs mathematical operations on metric items. It can aggregate, batch and group metrics to provide a higher level view of metrics while reducing metric data volume at the edge.
Note: Histogram metric items can not be aggregated. They must be cast into gauge or sum first.
See Extract and Aggregate Metrics for more information about using the extract metric processor.
Use the configuration wizard below to generate a starter YAML configuration.
Rollup Metric vs Aggregate Metric
The Edge Delta platform offers two ways to aggregate metrics:
Rollup Metric Processor: Aggregates metrics without grouping dimensions, producing a single summary value for all matching metrics in each interval. Use this when you need overall statistics like “total requests across all endpoints” or “median response time for the entire system.”
Aggregate Metric Processor (this page): Aggregates metrics with grouping dimensions using the
group_byfield, producing separate metrics for each unique dimension value. Use this when you need dimensional breakdowns like “requests per status code” or “response time by endpoint.”
Choose the rollup metric processor for simplified, single-value summaries. Choose the aggregate metric processor when you need to maintain visibility into different dimensions of your data.
Example Input
Consider this metric. It indicates that a single log had an HTTP status code of 200.
{
  "_type": "metric",
  "timestamp": 1744965983285,
  "resource": {
...
  },
  "attributes": {
    "level": "Notice",
    "msg": "processing completed with minor issues",
    "request": {
      "ip": "192.168.137.102",
      "method": "POST",
      "path": "/json/data"
    },
    "response_time_ms": 543,
    "status": 200,
    "timestamp": "2025-04-18T08:46:21.764083Z",
    "user": {
      "email": "wang.xiu@imaginarymail.com",
      "id": "99b4b6e8-b326-479f-b94f-aadf7a34b34c",
      "name": "8934f4b3-9539-470c-bd0b-3c4e58b73a8b"
    }
  },
  "description": "A count of each unique status code",
  "gauge": {
    "value": 200
  },
  "kind": "gauge",
  "name": "status_code",
  "unit": "1",
  "_stat_type": "value"
}
Note: The
resourcefield has been redacted for brevity.
Example Configuration
You specify a name for the processor and a condition data items must fulfil for the processor to operate on them. You configure one or more rules. Each rule generates a metric. For each rule you can create conditions for that metric (in addition to the main condition), specify a unique metric name, a unique batching interval, and create dimension groups. For each dimension group, a unique metric data item is produced at every batching interval.
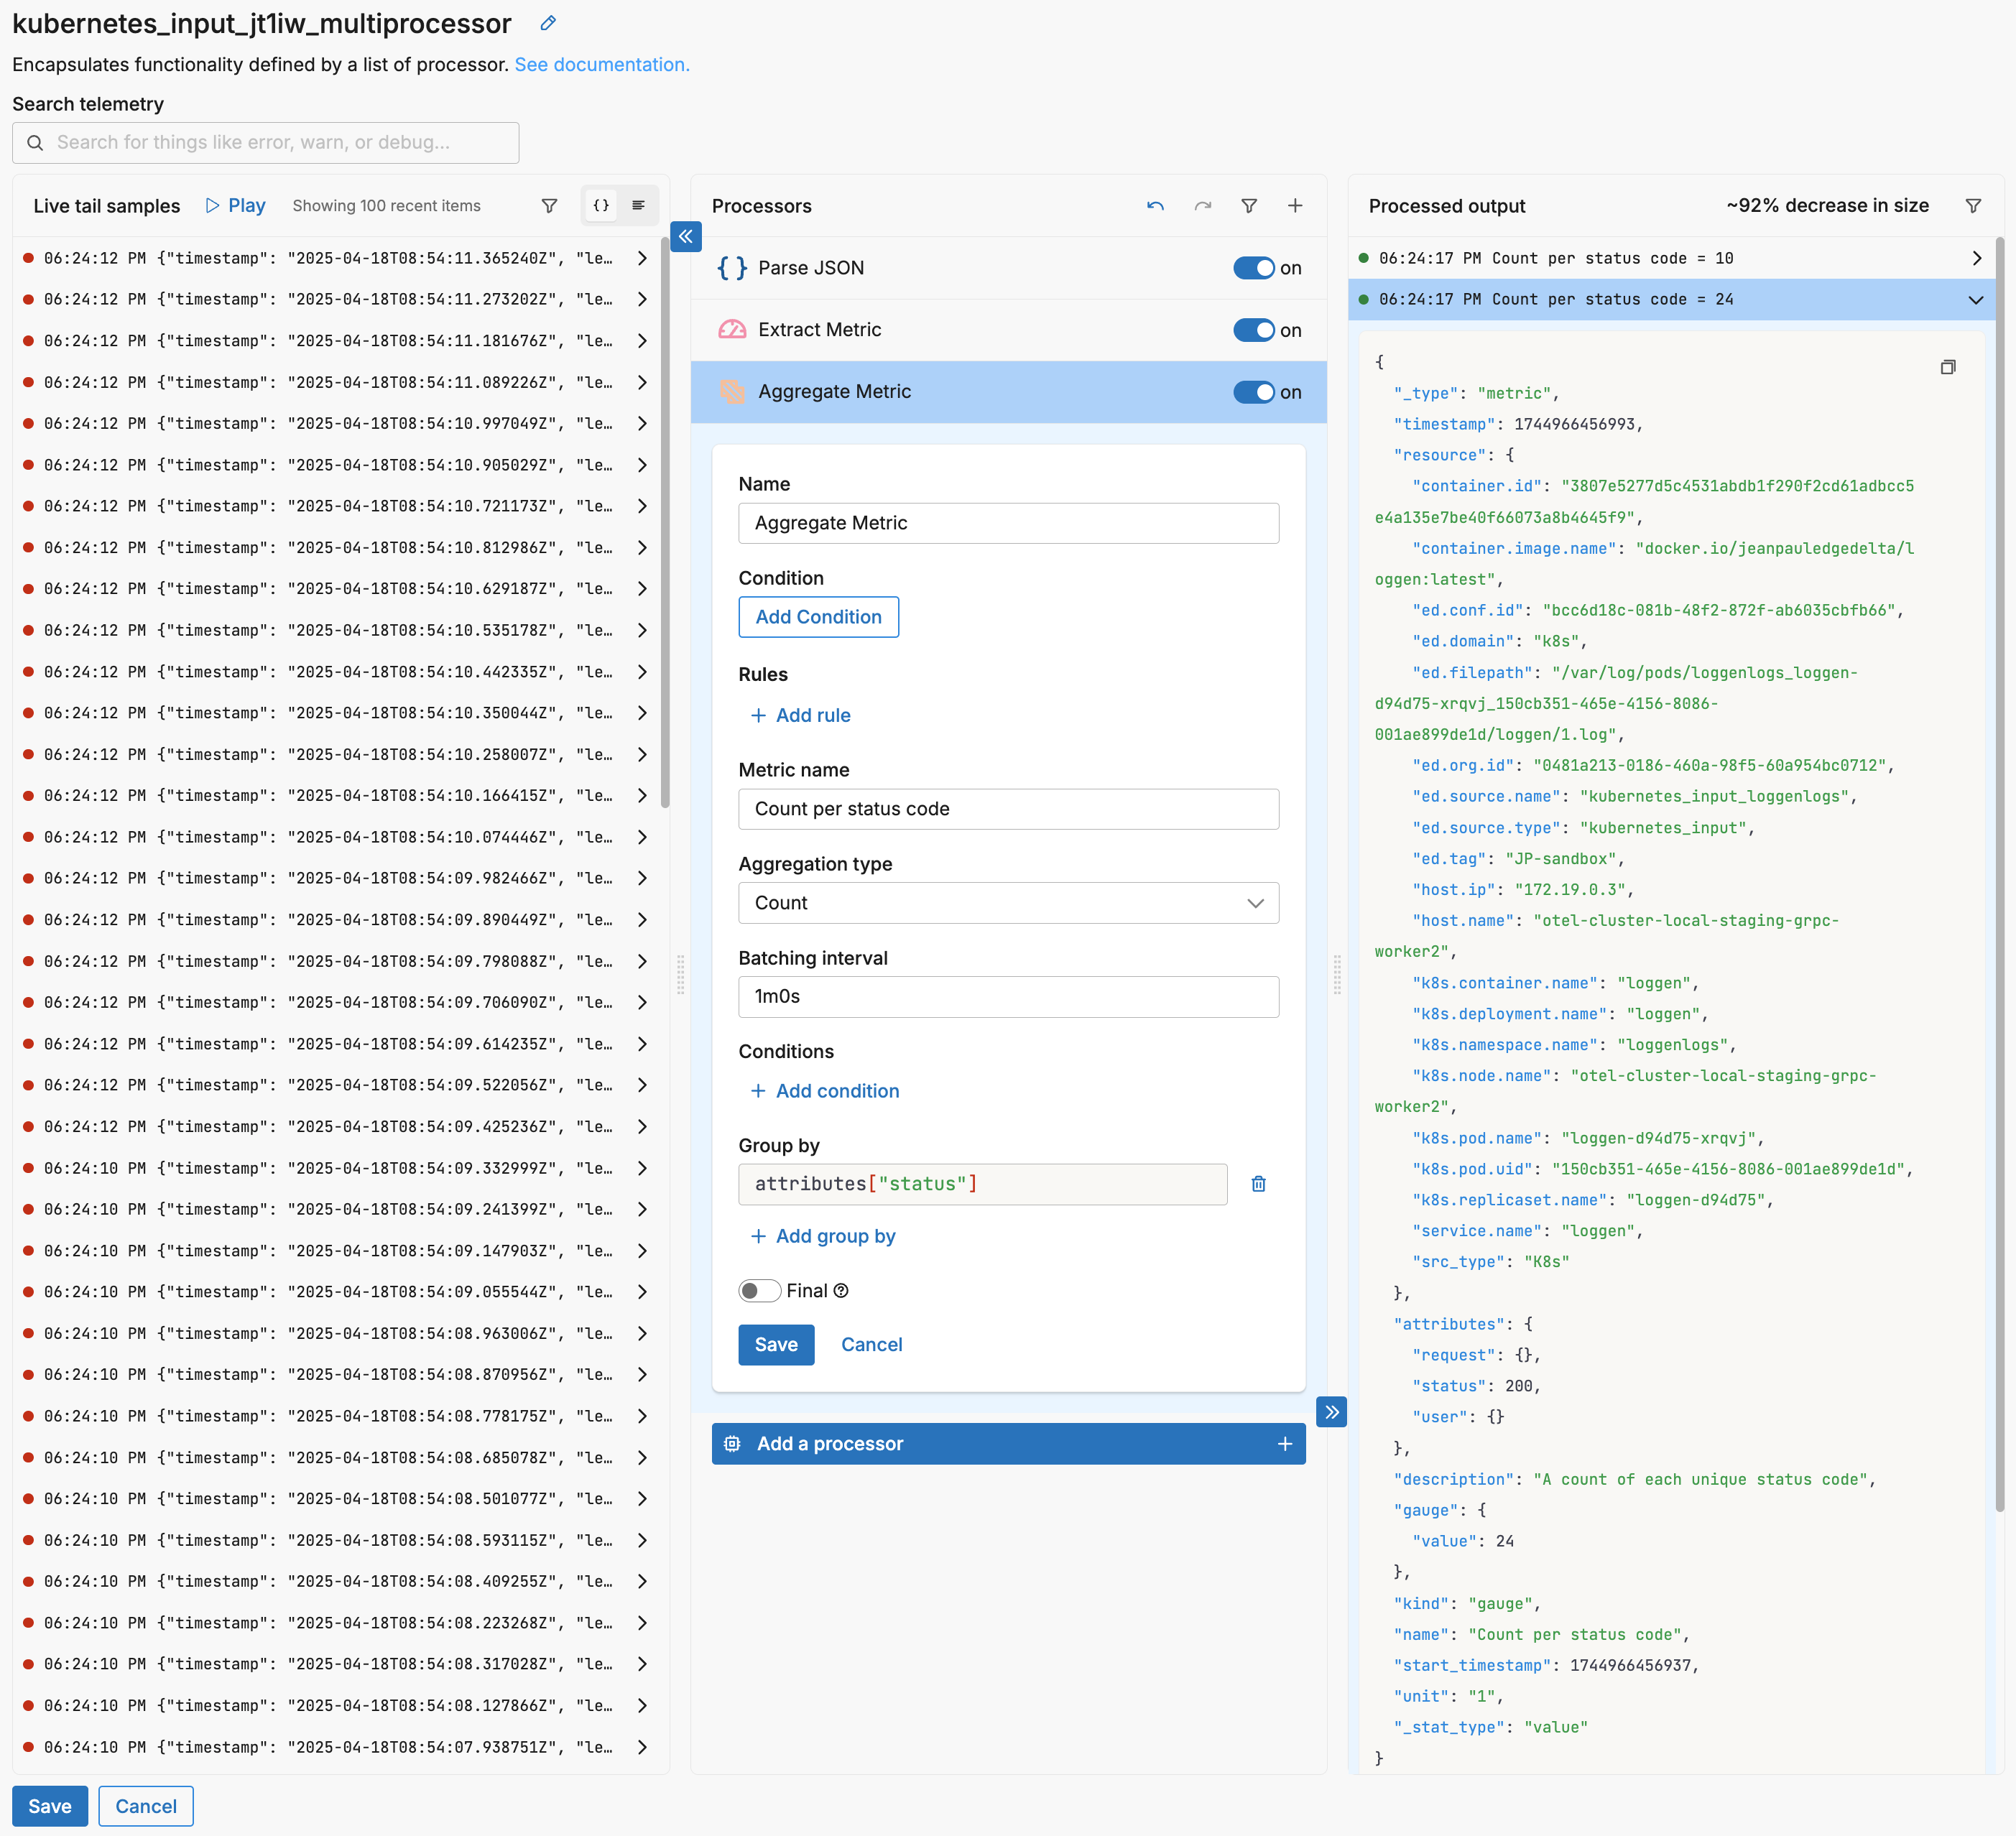
This example counts metrics per status. For example, there were 24 instances of the status 200 metric in the sample.
- name: Multiprocessor
  type: sequence
  processors:
  - type: aggregate_metric
    metadata: '{"id":"NoQMsANzEU7ltYMb5r1G0","type":"aggregate_metric","name":"Aggregate
      Metric"}'
    data_types:
    - metric
    aggregate_metric_rules:
    - name: Count per status code
      interval: 1m0s
      aggregation_type: count
      group_by:
      - attributes["status"]
Options
condition
The condition parameter contains a conditional phrase of an OTTL statement. It restricts operation of the processor to only data items where the condition is met. Those data items that do not match the condition are passed without processing. You configure it in the interface and an OTTL condition is generated. It is optional.
Important: All conditions must be written on a single line in YAML. Multi-line conditions are not supported.
Comparison Operators
| Operator | Name | Description | Example |
|---|---|---|---|
== | Equal to | Returns true if both values are exactly the same | attributes["status"] == "OK" |
!= | Not equal to | Returns true if the values are not the same | attributes["level"] != "debug" |
> | Greater than | Returns true if the left value is greater than the right | attributes["duration_ms"] > 1000 |
>= | Greater than or equal | Returns true if the left value is greater than or equal to the right | attributes["score"] >= 90 |
< | Less than | Returns true if the left value is less than the right | attributes["load"] < 0.75 |
<= | Less than or equal | Returns true if the left value is less than or equal to the right | attributes["retries"] <= 3 |
matches | Regex match | Returns true if the string matches a regular expression (generates IsMatch function) | IsMatch(attributes["name"], ".*\\.log$") |
Logical Operators
Important: Use lowercase and, or, not - uppercase operators will cause errors!
| Operator | Description | Example |
|---|---|---|
and | Both conditions must be true | attributes["level"] == "ERROR" and attributes["status"] >= 500 |
or | At least one condition must be true | attributes["log_type"] == "TRAFFIC" or attributes["log_type"] == "THREAT" |
not | Negates the condition | not IsMatch(attributes["path"], "^/health") |
Functions
| Function | Description | Example |
|---|---|---|
IsMatch | Returns true if string matches the regex pattern | IsMatch(attributes["message"], "ERROR\|FATAL") |
Field Existence Checks
| Check | Description | Example |
|---|---|---|
!= nil | Field exists (not null) | attributes["user_id"] != nil |
== nil | Field doesn’t exist | attributes["optional_field"] == nil |
!= "" | Field is not empty string | attributes["message"] != "" |
Common Examples
- name: _multiprocessor
  type: sequence
  processors:
  - type: <processor type>
    # Simple equality check
    condition: attributes["request"]["path"] == "/json/view"

  - type: <processor type>
    # Multiple values with OR
    condition: attributes["log_type"] == "TRAFFIC" or attributes["log_type"] == "THREAT"

  - type: <processor type>
    # Excluding multiple values (NOT equal to multiple values)
    condition: attributes["log_type"] != "TRAFFIC" and attributes["log_type"] != "THREAT"

  - type: <processor type>
    # Complex condition with AND/OR/NOT
    condition: (attributes["level"] == "ERROR" or attributes["level"] == "FATAL") and attributes["env"] != "test"

  - type: <processor type>
    # Field existence and value check
    condition: attributes["user_id"] != nil and attributes["user_id"] != ""

  - type: <processor type>
    # Regex matching on attributes
    condition: IsMatch(attributes["path"], "^/api/") and not IsMatch(attributes["path"], "^/api/health")

  - type: <processor type>
    # Regex matching on body (case-insensitive)
    condition: IsMatch(body, "(?i)error")
Common Mistakes to Avoid
# WRONG - Cannot use OR/AND with values directly
condition: attributes["log_type"] != "TRAFFIC" OR "THREAT"

# CORRECT - Must repeat the full comparison
condition: attributes["log_type"] != "TRAFFIC" and attributes["log_type"] != "THREAT"

# WRONG - Uppercase operators
condition: attributes["status"] == "error" AND attributes["level"] == "critical"

# CORRECT - Lowercase operators
condition: attributes["status"] == "error" and attributes["level"] == "critical"

# WRONG - Multi-line conditions
condition: |
  attributes["level"] == "ERROR" and
  attributes["status"] >= 500

# CORRECT - Single line (even if long)
condition: attributes["level"] == "ERROR" and attributes["status"] >= 500
Rules
Metric name
The name metric is a child of the metric definition. It defines the metric name. It is specified in the YAML as a string and is required.
It is defined in YAML as follows:
- name: _multiprocessor
  type: sequence
  processors:
  - type: <processor type>
    aggregate_metric_rules:
    - name: <metric name>
Aggregation Type
The aggregation_type metric is a child of the metric definition. It specifies the mathematical function to use to aggregate matching metrics.
Valid options are:
count- the number of instances matched.distinct_count- the number of unique values matched.last- the most recent value within the aggregation interval. This is useful for gauge-type metrics such as memory usage, queue depth, and connection counts. Requires agent version v2.12.0 or higher.max- the largest matching value.mean- the average (mean) matching value.median- the average (median) matching value.min- the smallest matching value.p90- count of values in the 90th percentile.p95- count of values in the 95th percentile.p99- count of values in the 99th percentile.sum- the sum of matched values.
It is defined in YAML as follows:
- name: _multiprocessor
  type: sequence
  processors:
  - type: <processor type>
    aggregate_metric_rules:
    - name: <metric name>
      aggregation_type: count
Batching interval
The interval parameter is a child of the metric definition. It defines the duration of the period between taking samples for the parent metric. A 1 minute interval will aggregate metrics each minute. It is specified as a duration and is required.
It is defined in YAML as follows:
- name: _multiprocessor
  type: sequence
  processors:
  - type: <processor type>
    aggregate_metric_rules:
    - name: <metric name>
      interval: 1m0s
conditions
The conditions parameter is a child of the metric definition. It contains a conditional phrase of an OTTL statement. It restricts operation of the processor to only data items where the condition is met, for the parent metric. This is different to the condition parameter which toggles the entire processor. Those data items that do not match the condition are passed without a metric being generated (other metrics in the same processor might still be created). It is specified by the tool as an OTTL condition when you select the condition fields in the interface and it is optional.
It is defined in YAML as follows:
- name: _multiprocessor
  type: sequence
  processors:
  - type: <processor type>
    aggregate_metric_rules:
    - name: <metric name>
      conditions:
      - attributes["level"] = Error
Group by
For each metric rule you can add a group. This creates a unique metric for each unique value discovered in the group by field. For example, with no group, 100 input metrics would result in a single aggregated metric showing, in this instance, the count of 100. If the status field is specified as a group (autocomplete helps select a field from the live tail sample set), one metric (a count) is generated for each HTTP status code. This aggregation enables you to see the breakdown of interval batch by status.
Important: If you don’t define a group by, a single bucket will be created (which will include all matching metrics) for a given interval, so it is important to define group by fields. If you intentionally want a single aggregated value without dimensions, consider using the Rollup Metric processor instead.
Keep only group by keys
When enabled, this option drops all attributes from the parent metric except those specified in the Group By selection. This helps reduce the cardinality of the output metrics by removing unnecessary attributes that aren’t part of the grouping dimensions.
Final
Determines whether successfully processed data items should continue through the remaining processors in the same processor stack. If final is set to true, data items output by this processor are not passed to subsequent processors within the node—they are instead emitted to downstream nodes in the pipeline (e.g., a destination). Failed items are always passed to the next processor, regardless of this setting.
The UI provides a slider to configure this setting. The default is false. It is defined in YAML as follows:
- name: multiprocessor
  type: sequence
  processors:
    - type: <processor type>
    final: true
Configuration Wizard
Use this interactive wizard to generate a starter configuration:
What type of aggregation do you need?
Choose the mathematical operation to apply to your metrics
See Also
- For an overview and to understand processor sequence flow, see Processors Overview
- To learn how to configure a processor, see Configure a Processor.
- For optimization strategies, see Best Practices for Edge Delta Processors.
- If you’re new to pipelines, start with the Pipeline Quickstart Overview or learn how to Configure a Pipeline.
- Looking to understand how processors interact with sources and destinations? Visit the Pipeline Overview.