Processors
7 minute read
Overview
Multiprocessors streamline the way you shape and manage data through your observability pipeline. Traditionally, you create and link individual single function nodes, often resulting in complex and error-prone graph topologies. Multiprocessors solve this by allowing you to define a sequence of processes in a single, simplified node. Each processor in the processor stack is automatically connected to the next, enabling a clear, sequential flow of data processing. This not only speeds up pipeline creation but also significantly reduces operational complexity.
- Simplified Pipeline Creation: Define and connect processors in a single action.
- Improved Efficiency: Deploy and maintain pipelines faster with an intuitive setup.
- Reduced Human Error: Automatic connections eliminate misconfiguration risks.
- Flexibility: Easily reorder or update processor sequences to meet evolving needs.
See the Processors Configuration page for details on how to create them.
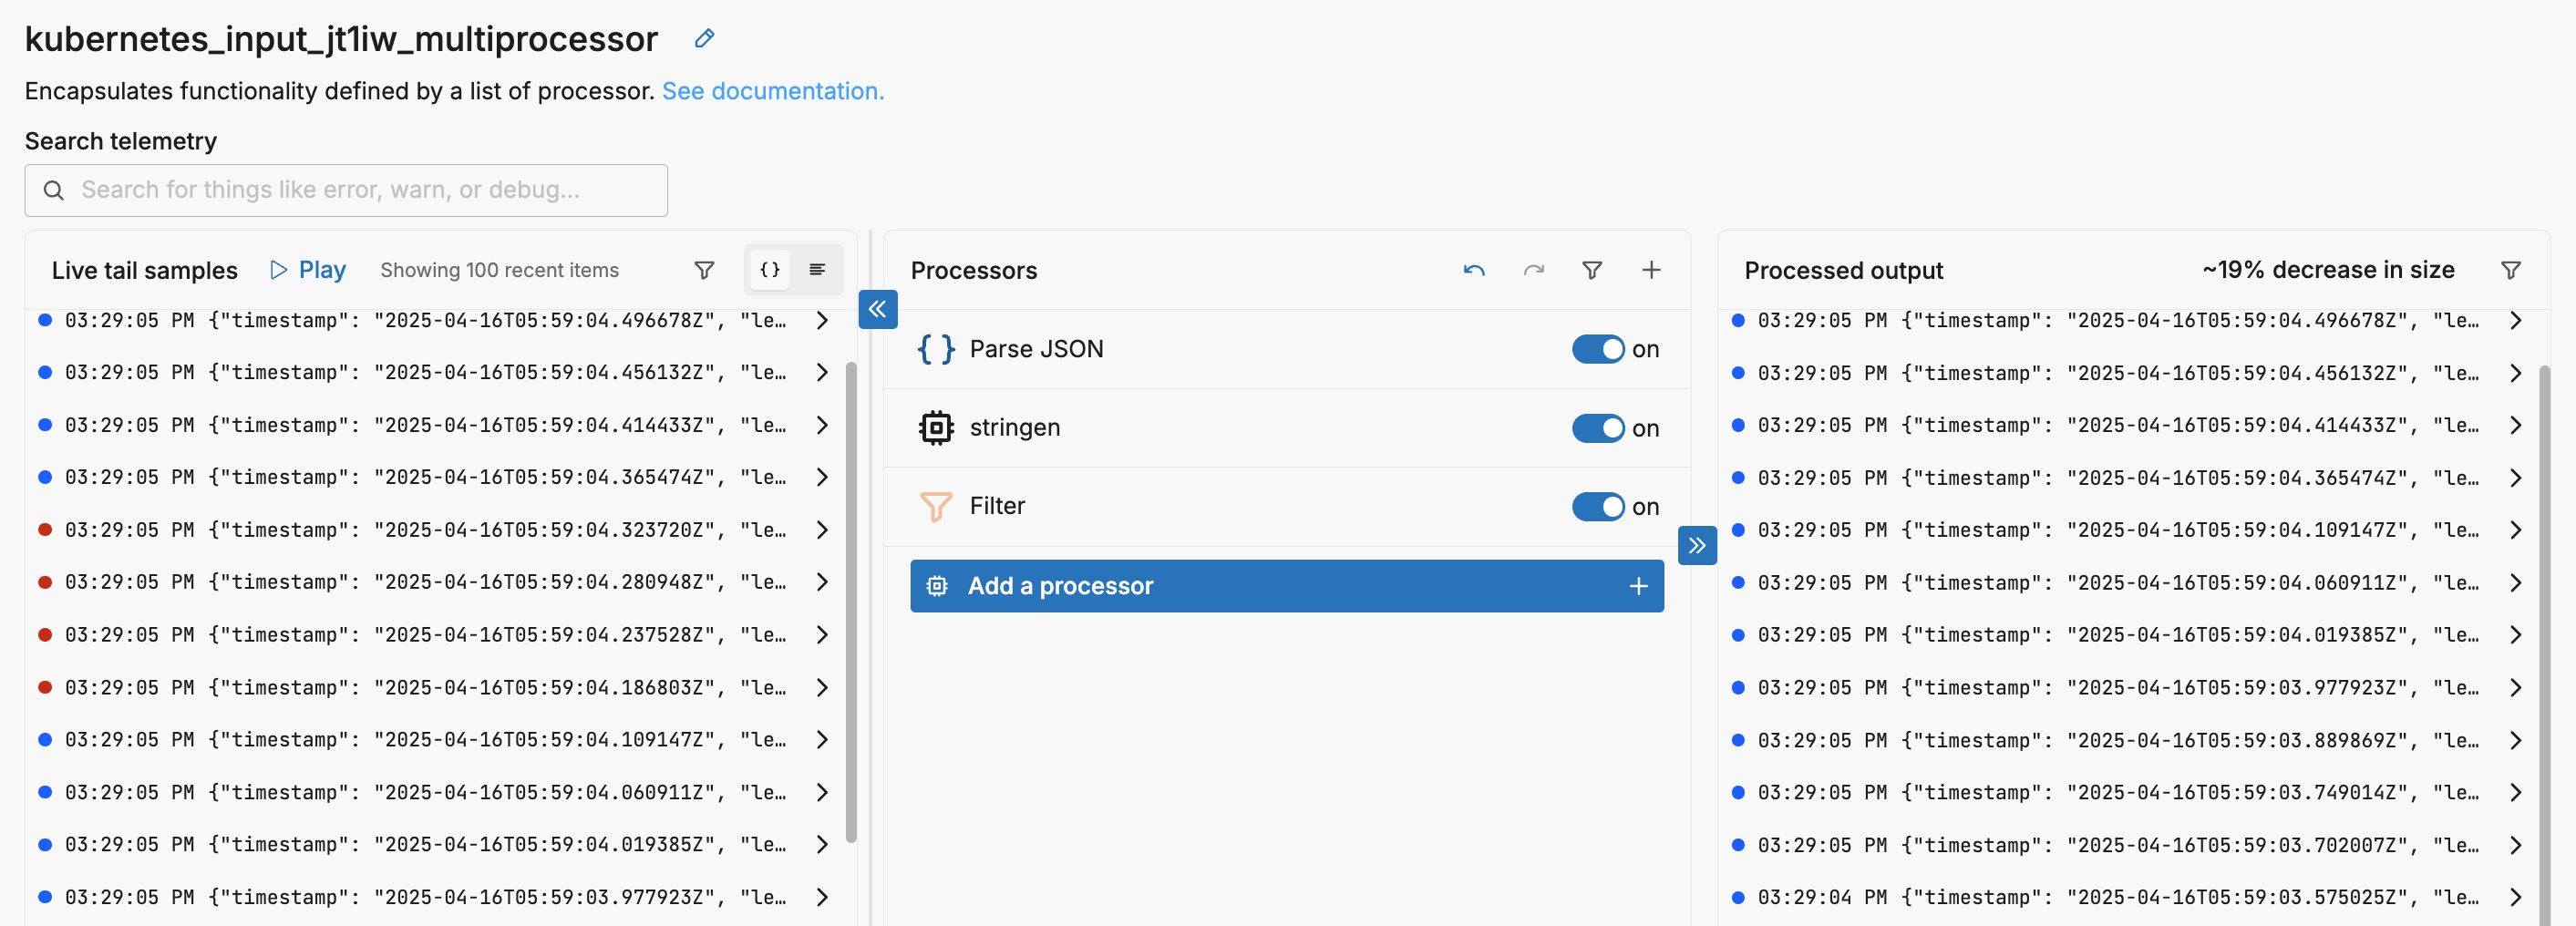
Managing Processor Flow
A multi-processor node allows you to chain together multiple processors in a defined top-down sequence. Each processor applies its logic in order, and the data flows through this stack one step at a time.
Note: If a telemetry item is dropped or filtered at any point, it does not proceed to the next processor in the sequence.
Within each processor there are, depending on the type of processor, two options that define how it interacts with other processors in the stack:
Final: If set, any successfully processed telemetry items will exit the processor node immediately, skipping any remaining processors in the stack. Items that fail processing continue to the next processor.Keep Original Telemetry Item: If set, the processor will emit both the newly created output and a copy of the original unmodified input for each successful processing operation, while failed items are also passed through. If this option is not set, only the generated data items will be emitted and the original data items will be dropped. While this is useful for enrichment processors, where keeping the original items would double the data volume unnecessarily, it may be an issue in other processors such as Extract Metric processors. In that case, only the metric is emitted and the original log item is dropped.
Conceptual Flow
This image illustrates the flow of data through a sequence of processors:
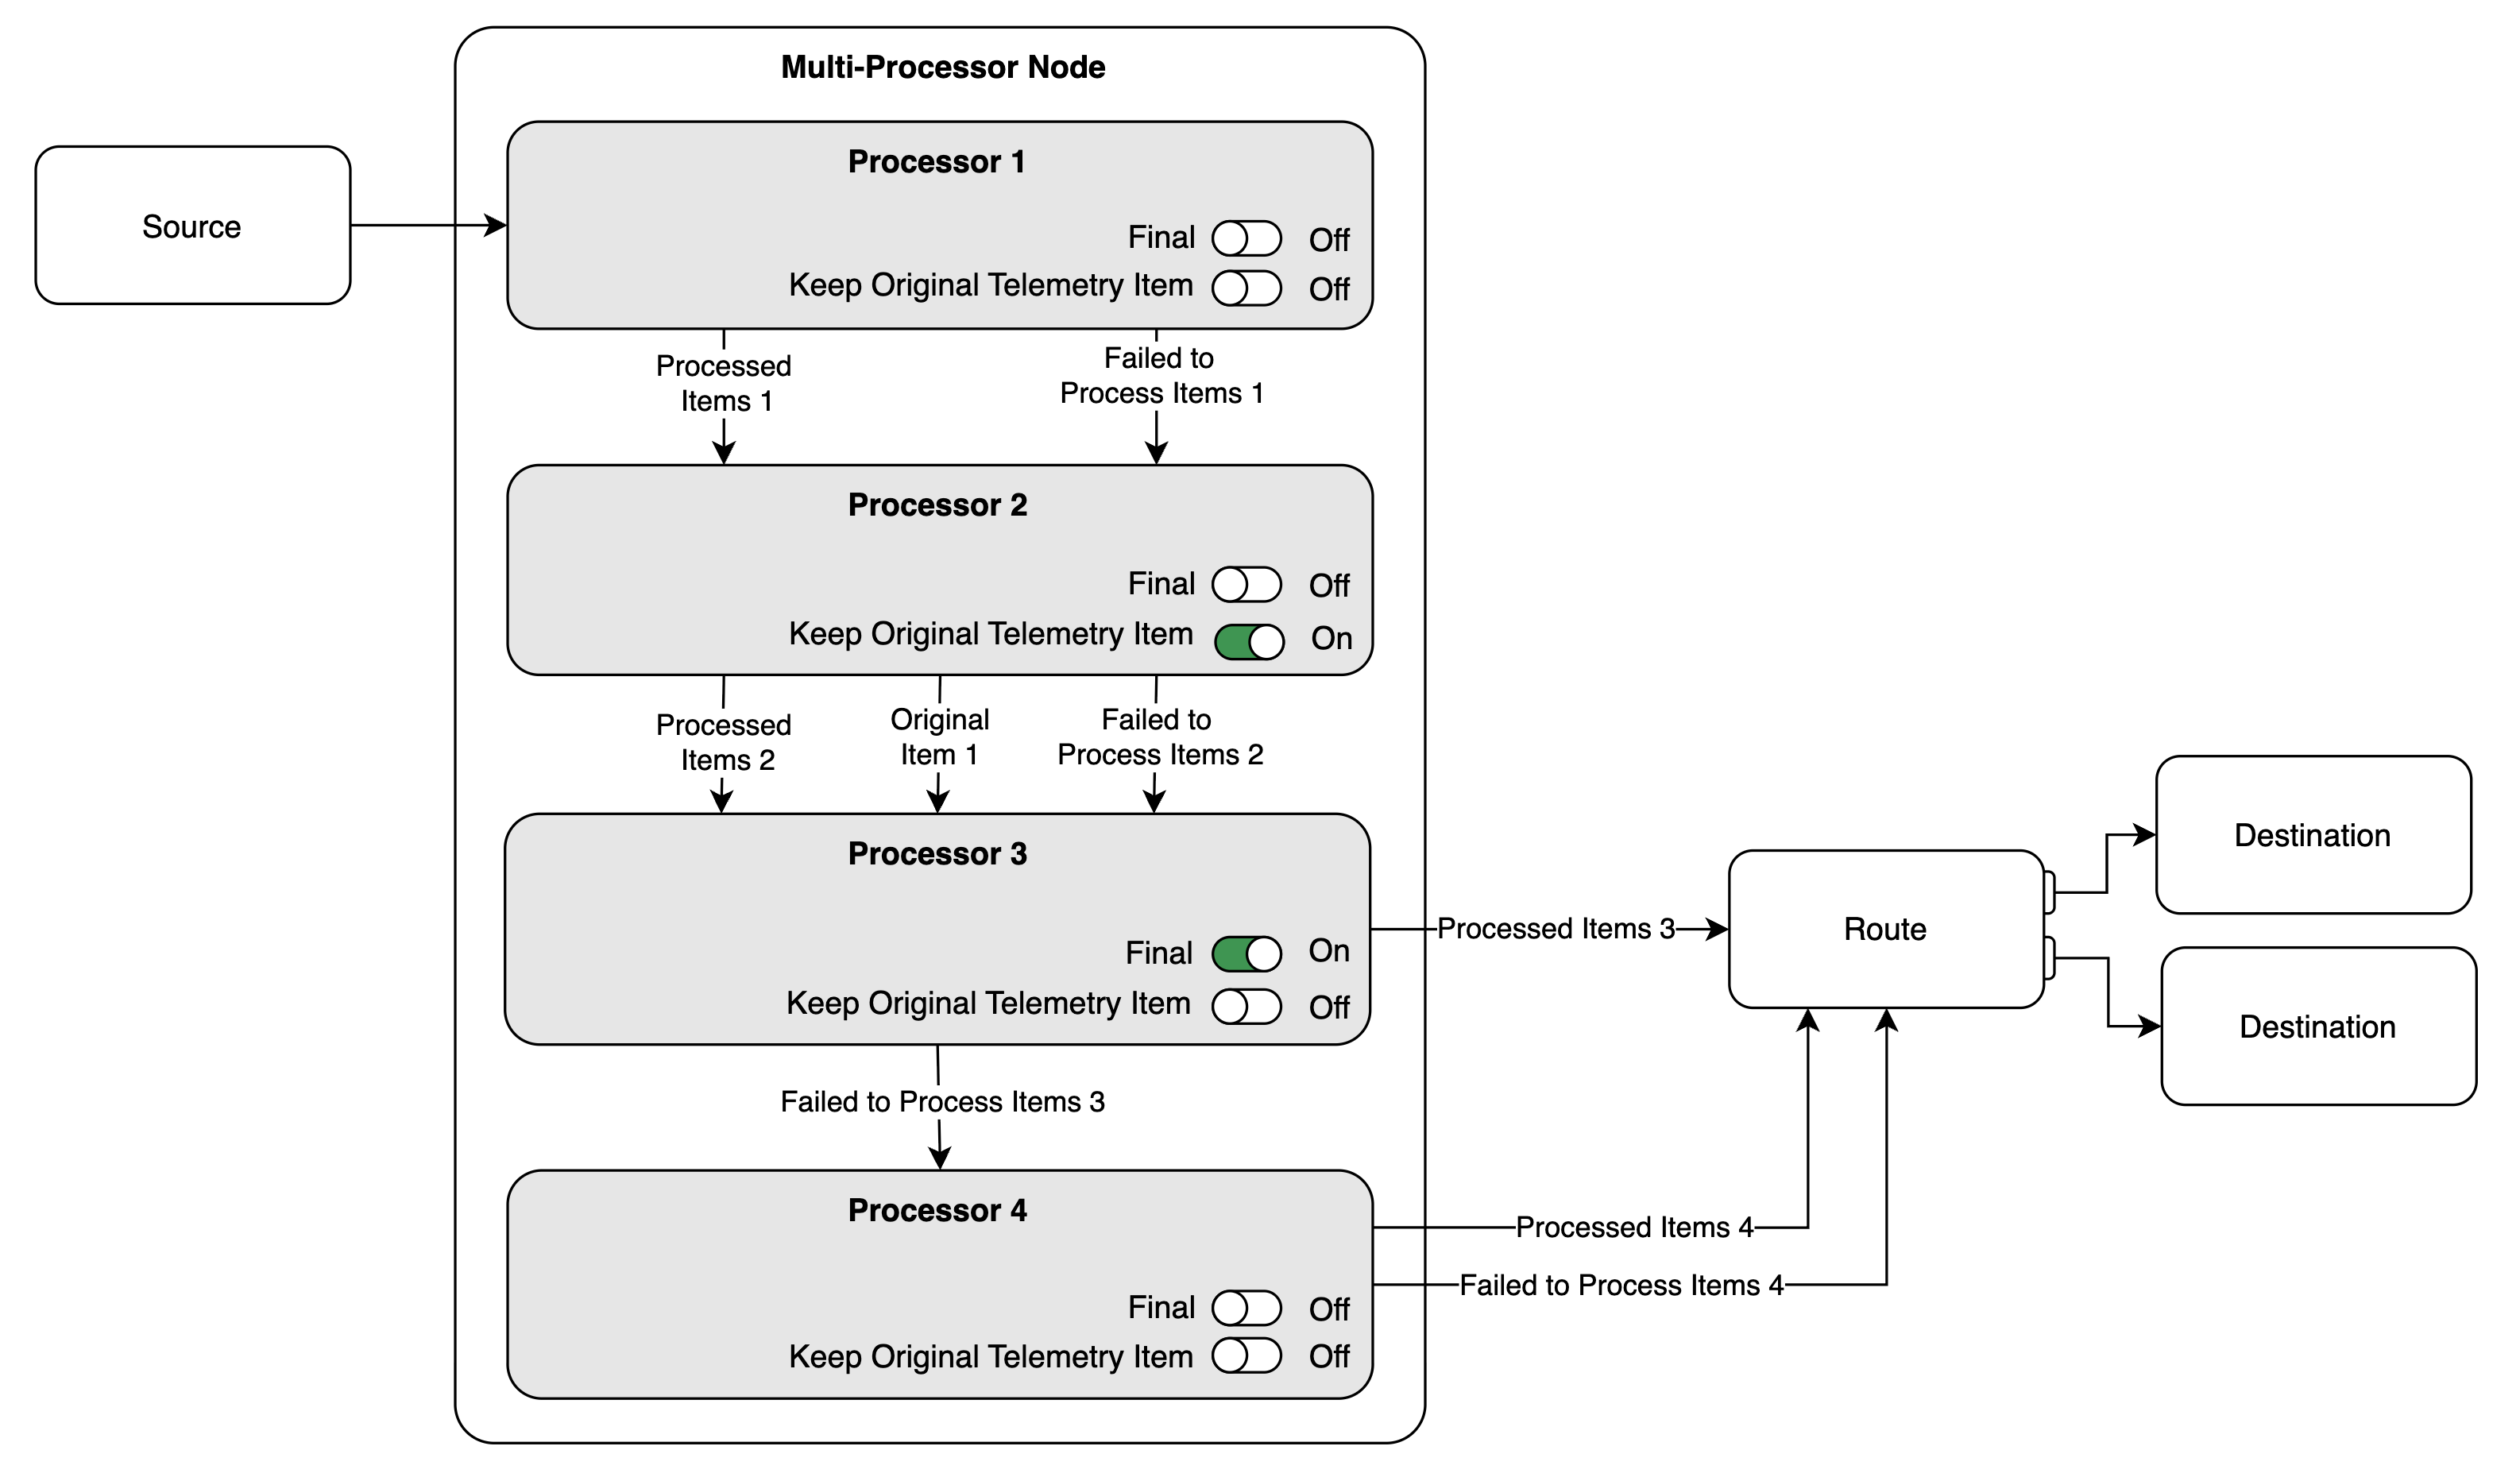
Processor 1has no options toggled on. Therefore, both processed items and items that could not be processed are passed to the next processor in the node.Processor 2has Keep Original Telemetry Item turned on. It passes three types of data to the next processor:Processed Items 2: the new output generated byProcessor 2.Original Item 1: a copy of each original telemetry item that was successfully processed into aProcessed Item 2.Failed to Process Items 2: the original telemetry items thatProcessor 2failed to process.
Processor 3has Final enabled and Keep Original Telemetry Item turned off. Therefore, all successfully processed items (Processed Items 3) exit the processor node and are sent directly to the next node in the pipeline (Route). Any items that fail to process are passed toProcessor 4.Processor 4has no options toggled on. As the final processor in the node, it passes both processed items and failed-to-process items to the next node in the pipeline (Route).
Example
Consider this log as it progresses through a multiprocessor:
It is emitted from the data source like this:
{"timestamp": "2025-07-24T04:15:53.254887Z", "level": "Error", "msg": "processing slow response", "user": {"email": "john.doe@fictitiousemail.com", "id": "a058ec69-0446-4060-8833-22464879a792", "name": "bd026d23-33ed-46d4-adf9-6a2c0fc45bf6"}, "request": {"ip": "192.168.89.70", "method": "PATCH", "path": "/json/view"}, "status": 403, "response_time_ms": 2748}
When the Edge Delta agent ingests it, metadata is added:
{
  "_type": "log",
  "timestamp": 1753330973803,
  "body": "{\"timestamp\": \"2025-07-24T04:15:53.254887Z\", \"level\": \"Error\", \"msg\": \"processing slow response\", \"user\": {\"email\": \"john.doe@fictitiousemail.com\", \"id\": \"a058ec69-0446-4060-8833-22464879a792\", \"name\": \"bd026d23-33ed-46d4-adf9-6a2c0fc45bf6\"}, \"request\": {\"ip\": \"192.168.89.70\", \"method\": \"PATCH\", \"path\": \"/json/view\"}, \"status\": 403, \"response_time_ms\": 2748}",
  "resource": {
    "container.id": "0c146426da43ffce2a2b358a92b2007a1037c025e6a02b83dc14b444725d940d",
    "container.image.name": "docker.io/library/busybox:latest",
    "ed.domain": "k8s",
    "ed.filepath": "/var/log/pods/busy_log-writer_c15a7a17-f6f1-4ad8-b8cd-e0d3f0d8049c/log-writer/0.log",
    "ed.source.name": "kubernetes_input_ab15",
    "ed.source.type": "kubernetes_input",
    "host.ip": "172.19.0.3",
    "host.name": "main-lab-worker",
    "k8s.container.name": "log-writer",
    "k8s.namespace.name": "busy",
    "k8s.node.name": "main-lab-worker",
    "k8s.pod.name": "log-writer",
    "k8s.pod.uid": "c15a7a17-f6f1-4ad8-b8cd-e0d3f0d8049c",
    "service.name": "Unknown"
  },
  "attributes": {}
}
Note: For the rest of this page the resources will be removed for brevity.
It enters the multiprocessor node and can be seen in the Live tail sample pane. To start, an extract metric processor generates a metric item based on the log.
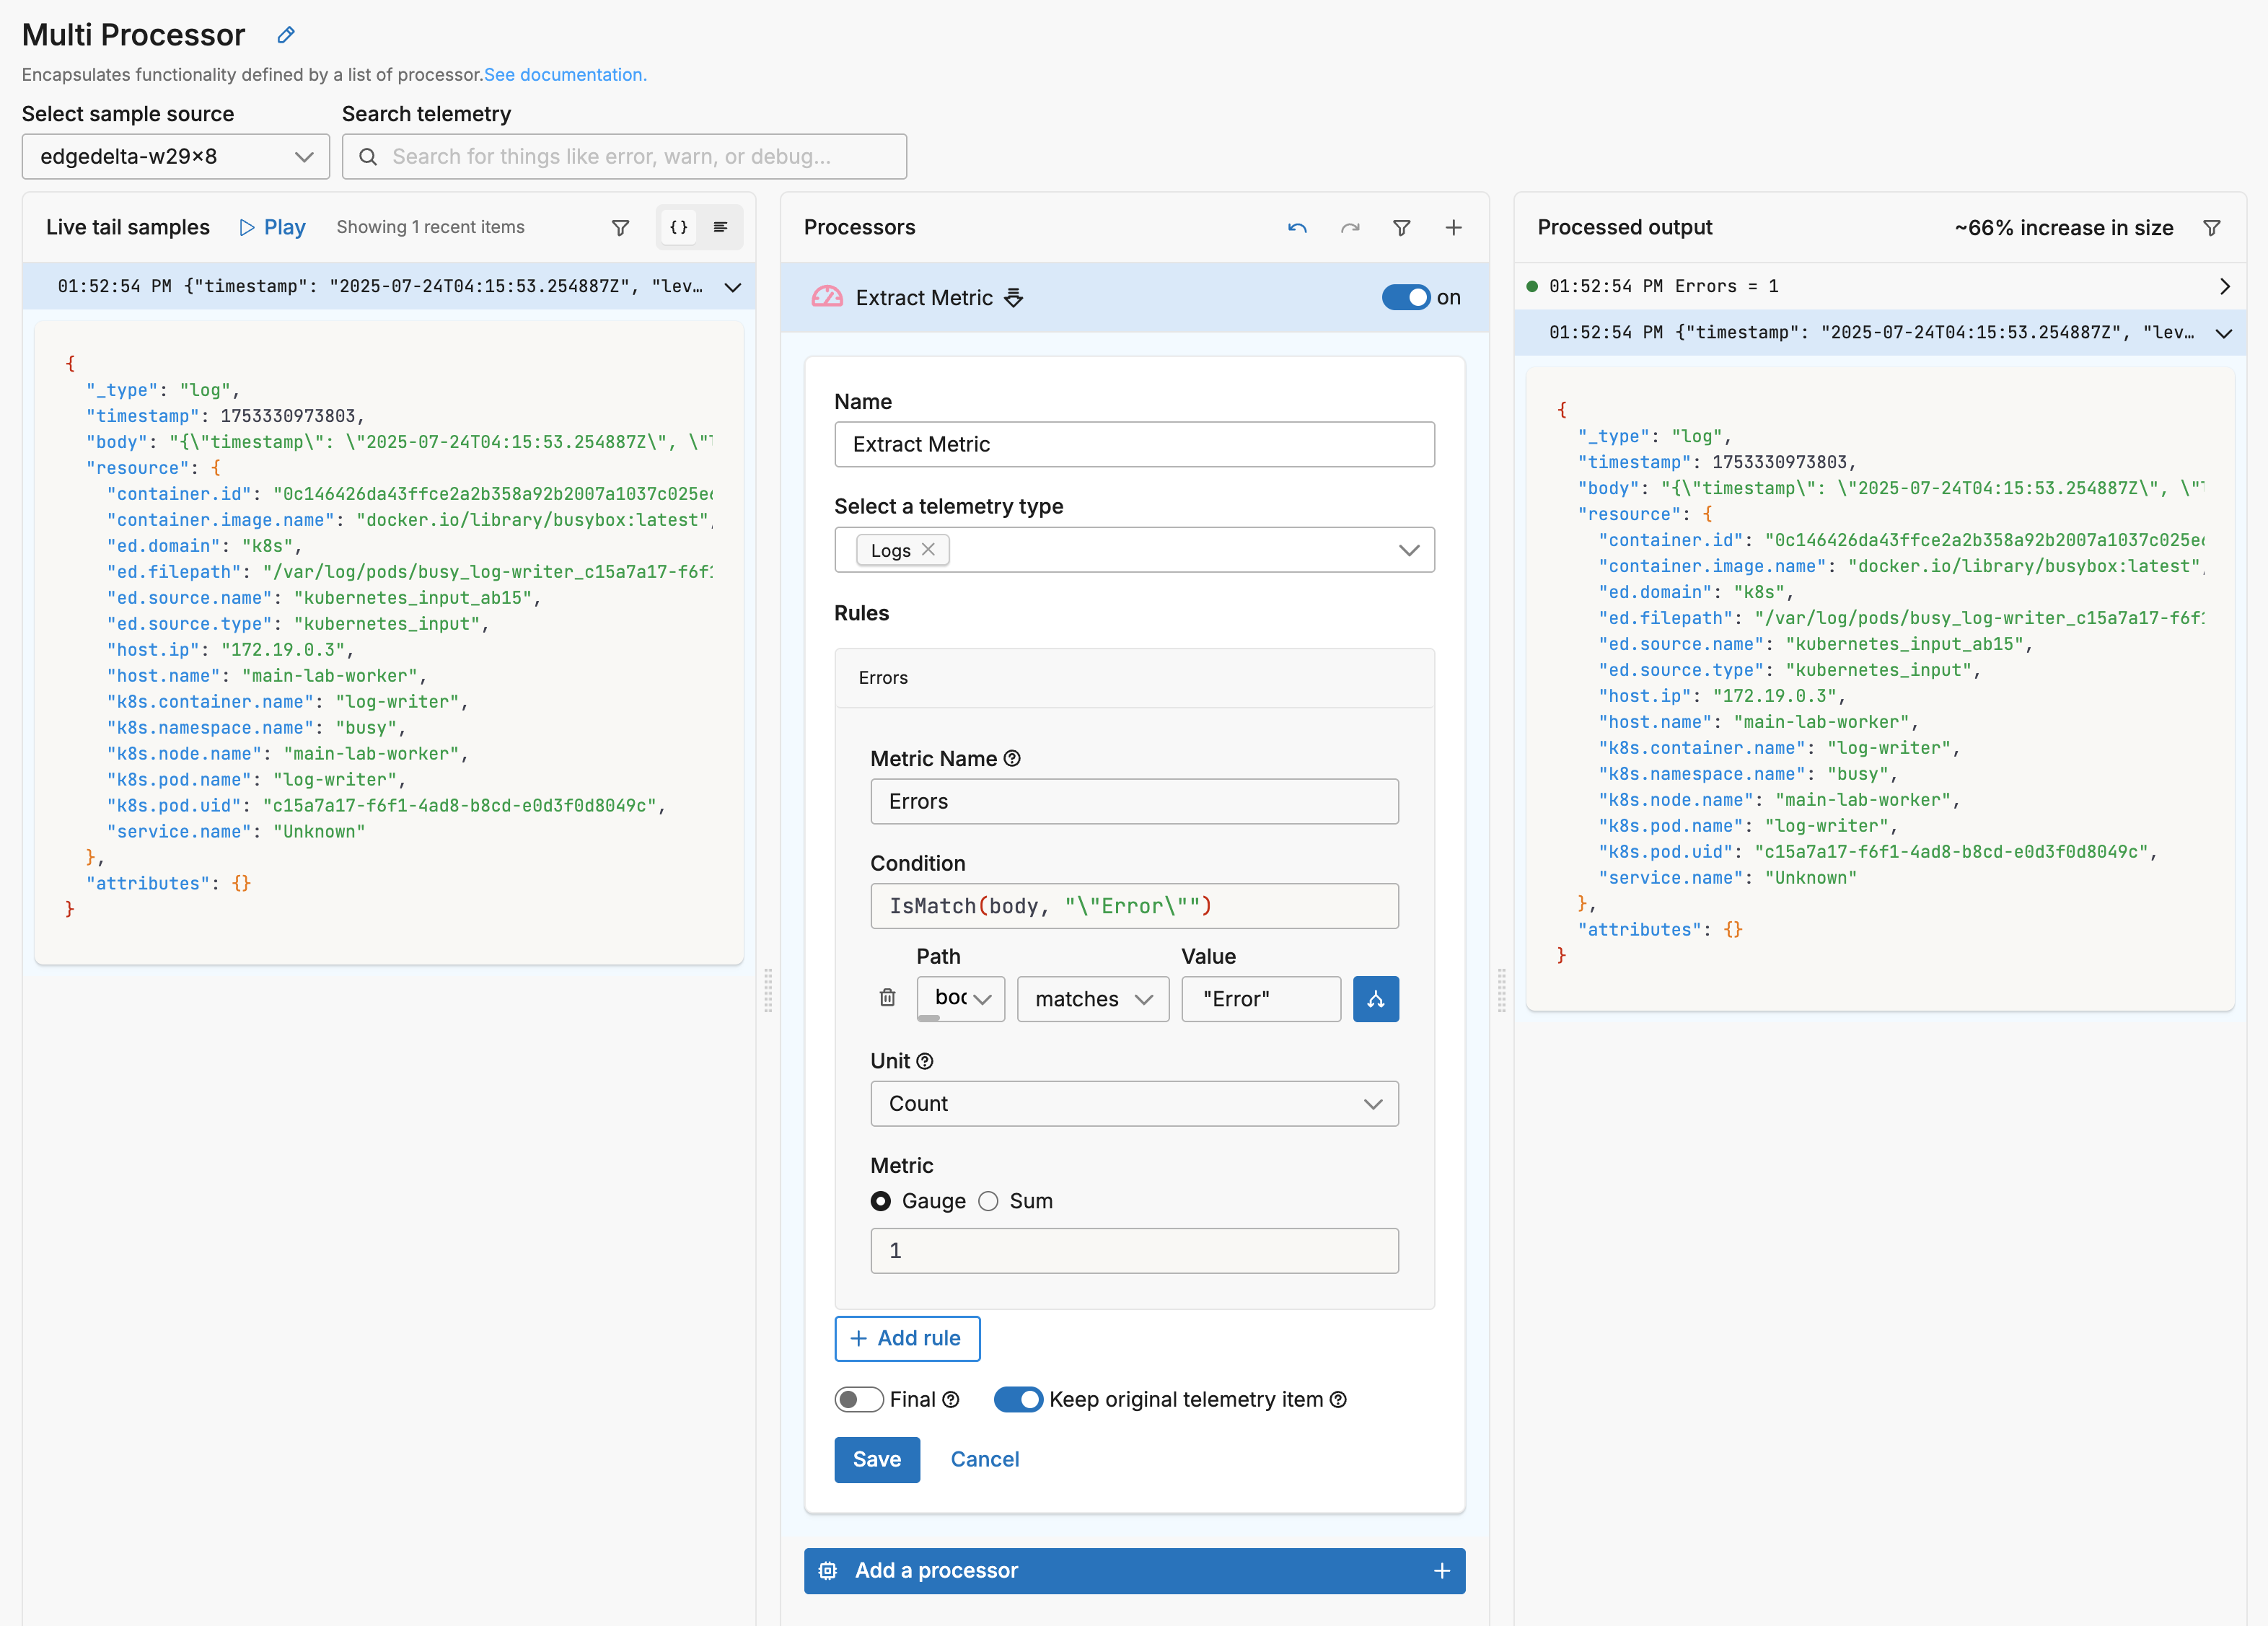
It detected the word Error and created a metric for the instance. The Extract Metric processor has Keep original telemetry item selected. Therefore, it outputs two data items: the original log, and a new metric item:
{
  "_type": "log",
  "timestamp": 1753330973803,
  "body": "{\"timestamp\": \"2025-07-24T04:15:53.254887Z\", \"level\": \"Error\", \"msg\": \"processing slow response\", \"user\": {\"email\": \"john.doe@fictitiousemail.com\", \"id\": \"a058ec69-0446-4060-8833-22464879a792\", \"name\": \"bd026d23-33ed-46d4-adf9-6a2c0fc45bf6\"}, \"request\": {\"ip\": \"192.168.89.70\", \"method\": \"PATCH\", \"path\": \"/json/view\"}, \"status\": 403, \"response_time_ms\": 2748}",
  "resource": {
    ...
  },
  "attributes": {}
}
{
  "_type": "metric",
  "timestamp": 1753330973803,
  "resource": {
    ...
  },
  "attributes": {},
  "gauge": {
    "value": 1
  },
  "kind": "gauge",
  "name": "Errors",
  "unit": "1",
  "_stat_type": "value"
}
If Keep original telemetry item was not selected, only the metric item would be the output of the processor within this multiprocessor node.
Next, an enrichment processor is added. In this instance, it adds an attribute called type with the value of test.
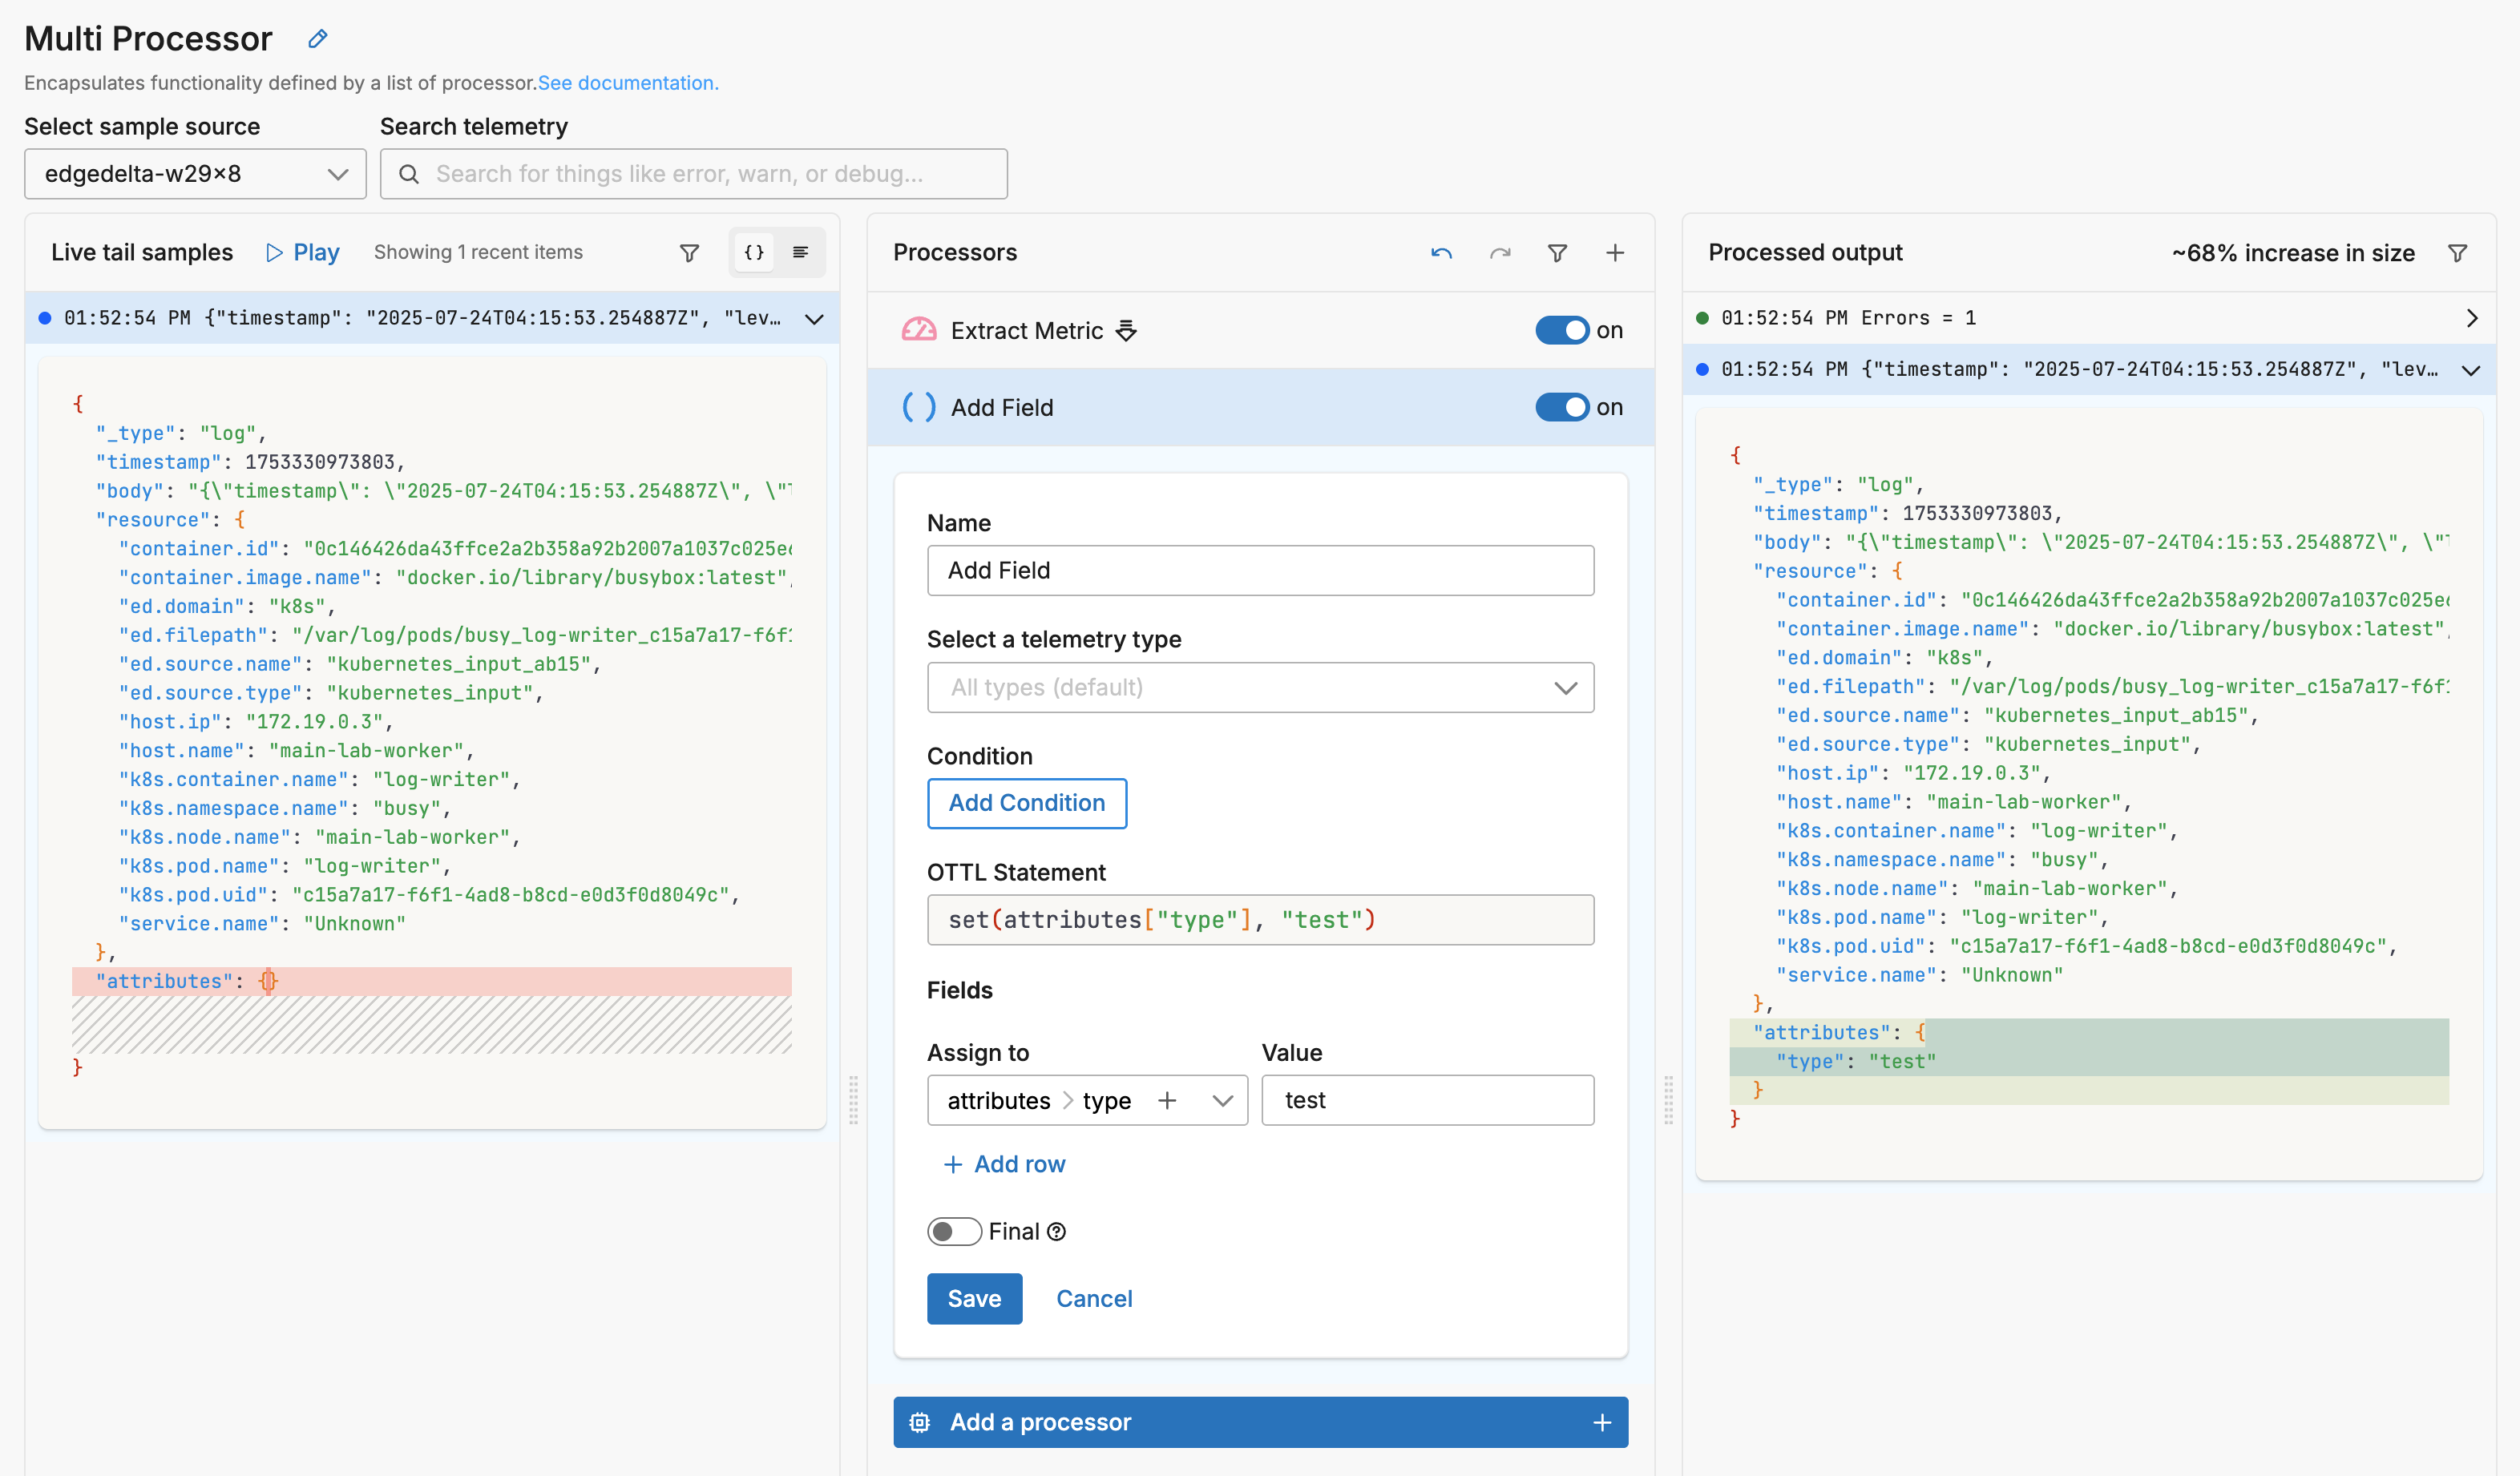
The Select a telemetry type field is empty so it operates on all data types. Therefore, both data items - the log and the metric - are enriched with the attribute:
{
  "_type": "log",
  "timestamp": 1753330973803,
  "body": "{\"timestamp\": \"2025-07-24T04:15:53.254887Z\", \"level\": \"Error\", \"msg\": \"processing slow response\", \"user\": {\"email\": \"john.doe@fictitiousemail.com\", \"id\": \"a058ec69-0446-4060-8833-22464879a792\", \"name\": \"bd026d23-33ed-46d4-adf9-6a2c0fc45bf6\"}, \"request\": {\"ip\": \"192.168.89.70\", \"method\": \"PATCH\", \"path\": \"/json/view\"}, \"status\": 403, \"response_time_ms\": 2748}",
  "resource": {
    ...
  },
  "attributes": {
    "type": "test"
  }
}
{
  "_type": "metric",
  "timestamp": 1753330973803,
  "resource": {
    ...
  },
  "attributes": {
    "type": "test"
  },
  "gauge": {
    "value": 1
  },
  "kind": "gauge",
  "name": "Errors",
  "unit": "1",
  "_stat_type": "value"
}
Next, a Parse JSON processor is added to the stack. The output of the Add Field processor - the log and metric data items - becomes the input of the Parse JSON processor. It is set to only operate on logs, and the Keep original telemetry item is not selected.
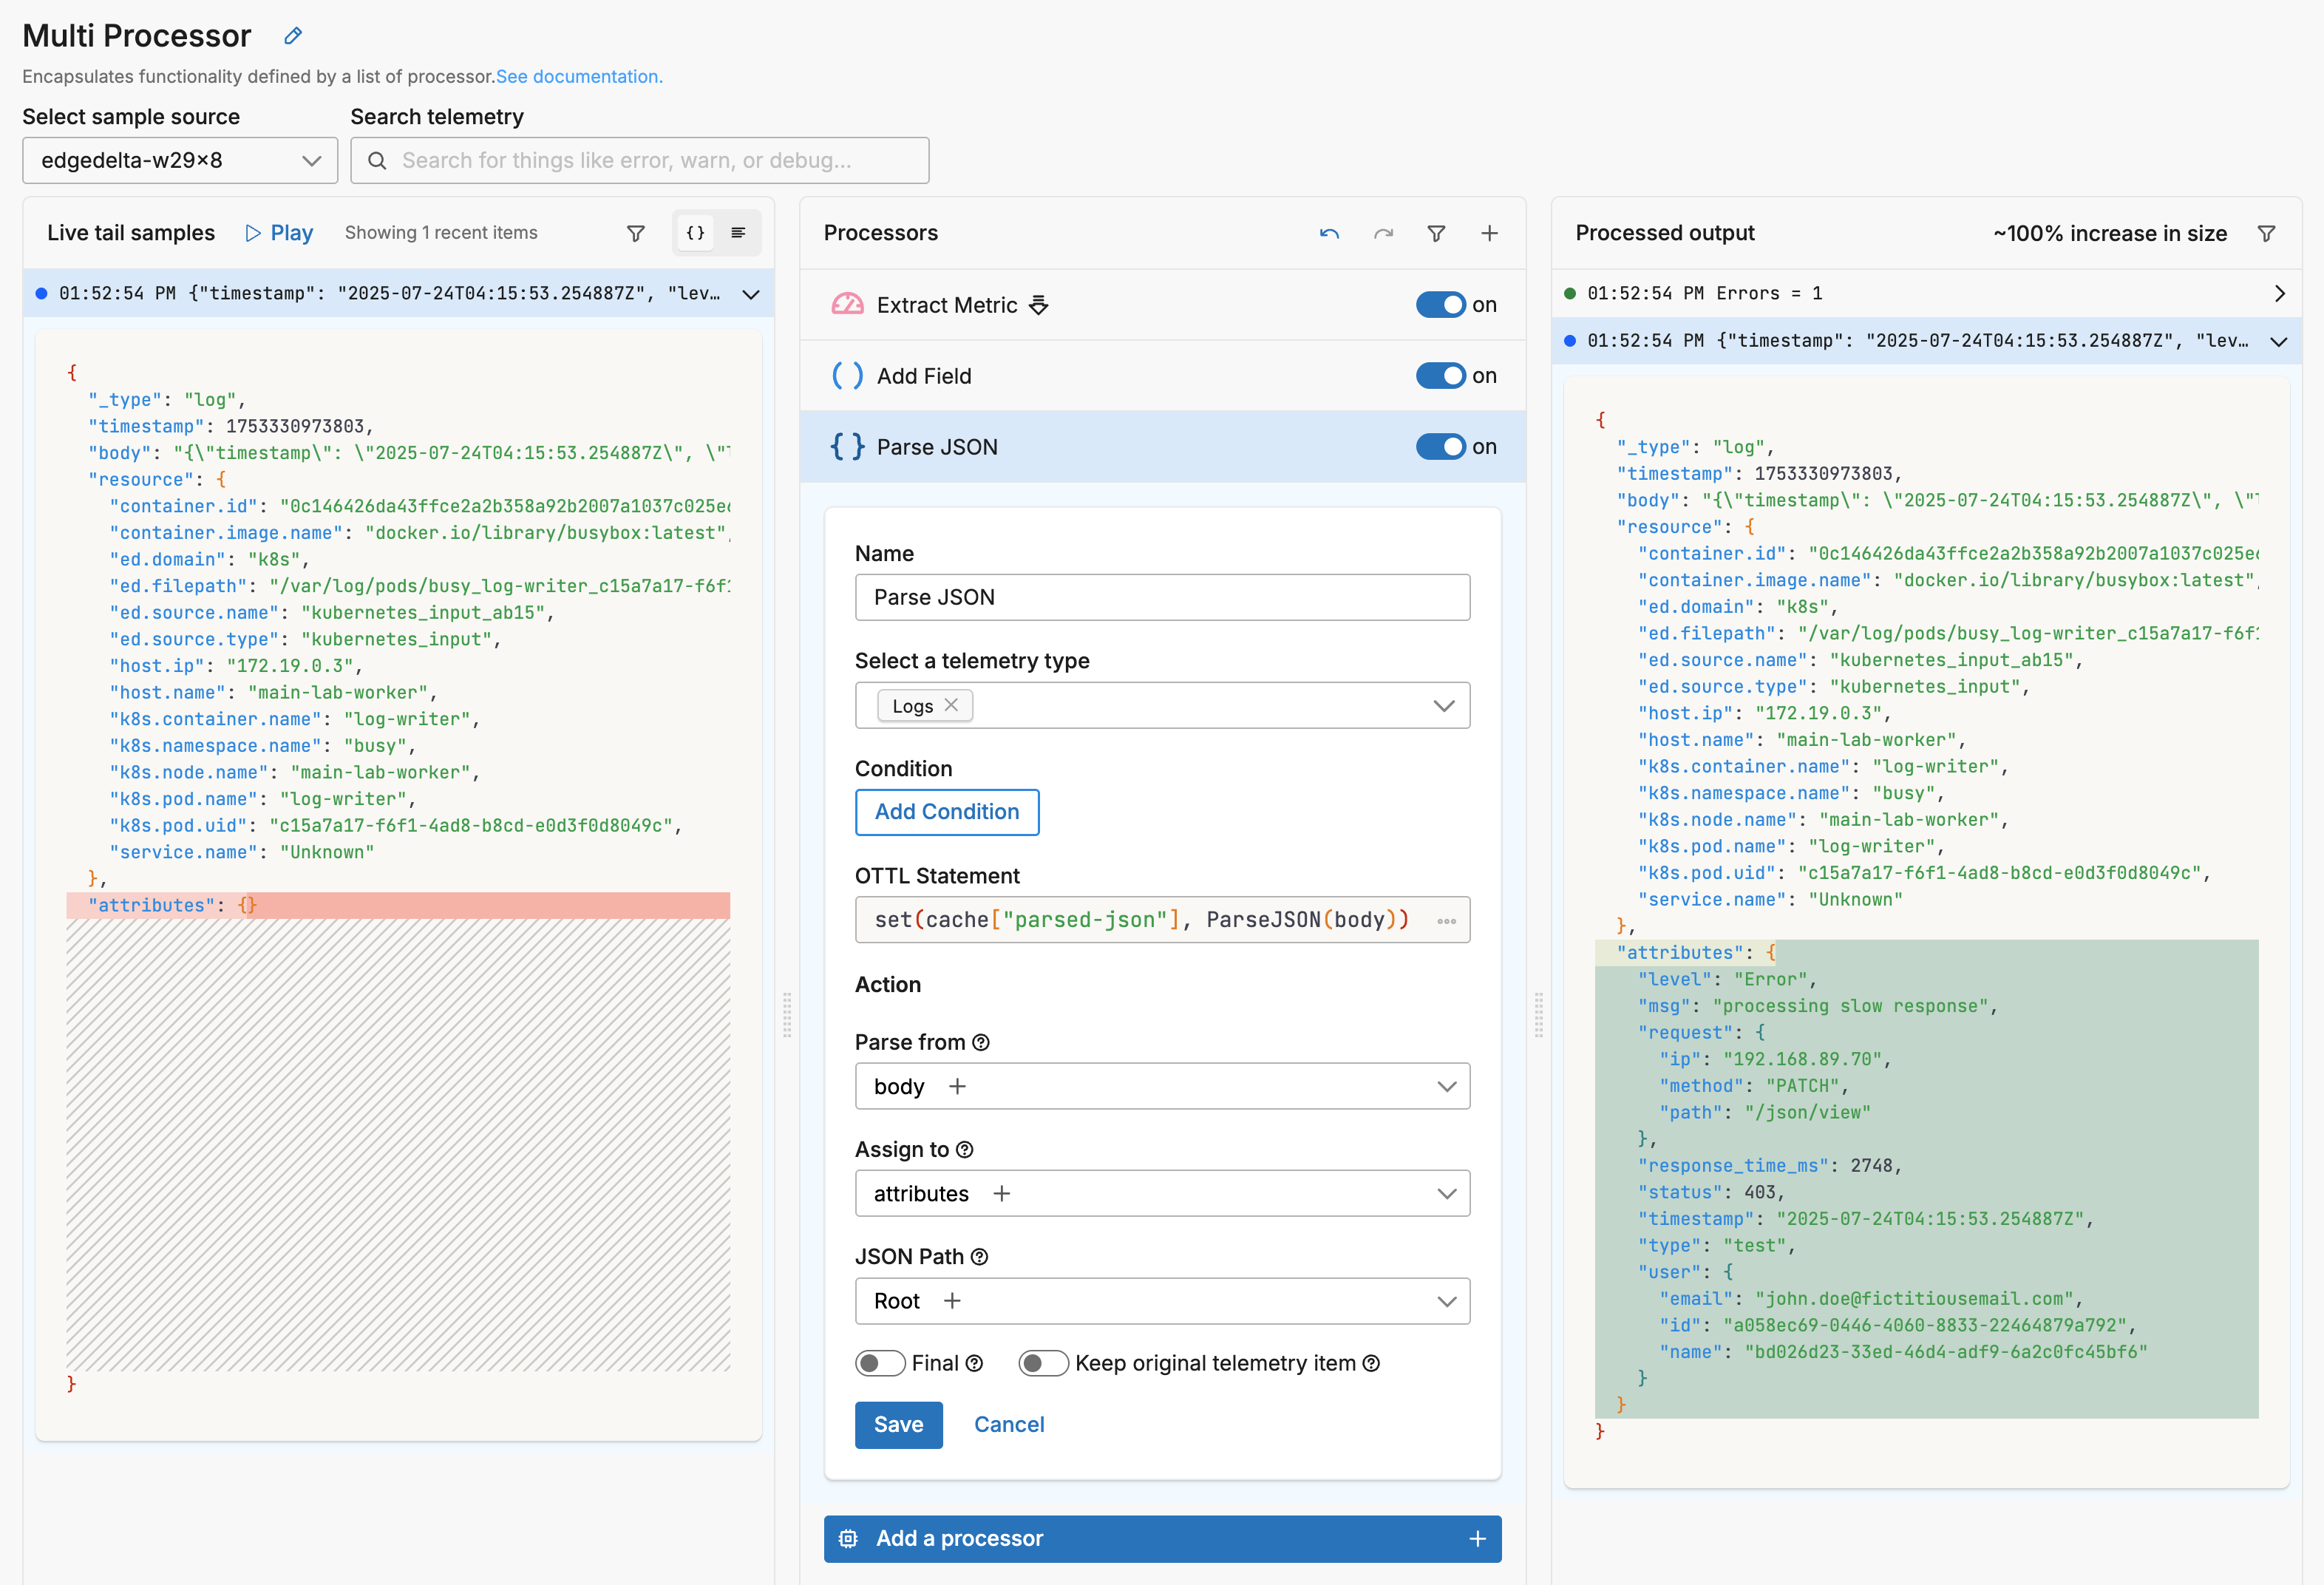
It did not operate on the metric data item so that item is passed without modification. It did process the log however, creating a new data item with the log body parsed into attributes. But it did not pass the original, unparsed log. Therefore there are two data item outputs: the metric, and a new parsed log:
{
  "_type": "metric",
  "timestamp": 1753330973803,
  "resource": {
    ...
  },
  "attributes": {
    "type": "test"
  },
  "gauge": {
    "value": 1
  },
  "kind": "gauge",
  "name": "Errors",
  "unit": "1",
  "_stat_type": "value"
}
{
  "_type": "log",
  "timestamp": 1753330973803,
  "body": "{\"timestamp\": \"2025-07-24T04:15:53.254887Z\", \"level\": \"Error\", \"msg\": \"processing slow response\", \"user\": {\"email\": \"john.doe@fictitiousemail.com\", \"id\": \"a058ec69-0446-4060-8833-22464879a792\", \"name\": \"bd026d23-33ed-46d4-adf9-6a2c0fc45bf6\"}, \"request\": {\"ip\": \"192.168.89.70\", \"method\": \"PATCH\", \"path\": \"/json/view\"}, \"status\": 403, \"response_time_ms\": 2748}",
  "resource": {
    ...
  },
  "attributes": {
    "level": "Error",
    "msg": "processing slow response",
    "request": {
      "ip": "192.168.89.70",
      "method": "PATCH",
      "path": "/json/view"
    },
    "response_time_ms": 2748,
    "status": 403,
    "timestamp": "2025-07-24T04:15:53.254887Z",
    "type": "test",
    "user": {
      "email": "john.doe@fictitiousemail.com",
      "id": "a058ec69-0446-4060-8833-22464879a792",
      "name": "bd026d23-33ed-46d4-adf9-6a2c0fc45bf6"
    }
  }
}
In the next step, for illustrative purposes, a Filter processor is added to the processor stack. It deletes any data item that has an attribute called type with the value test. Both the data items were processed earlier in the stack by the Add Field processor, which added this attribute.
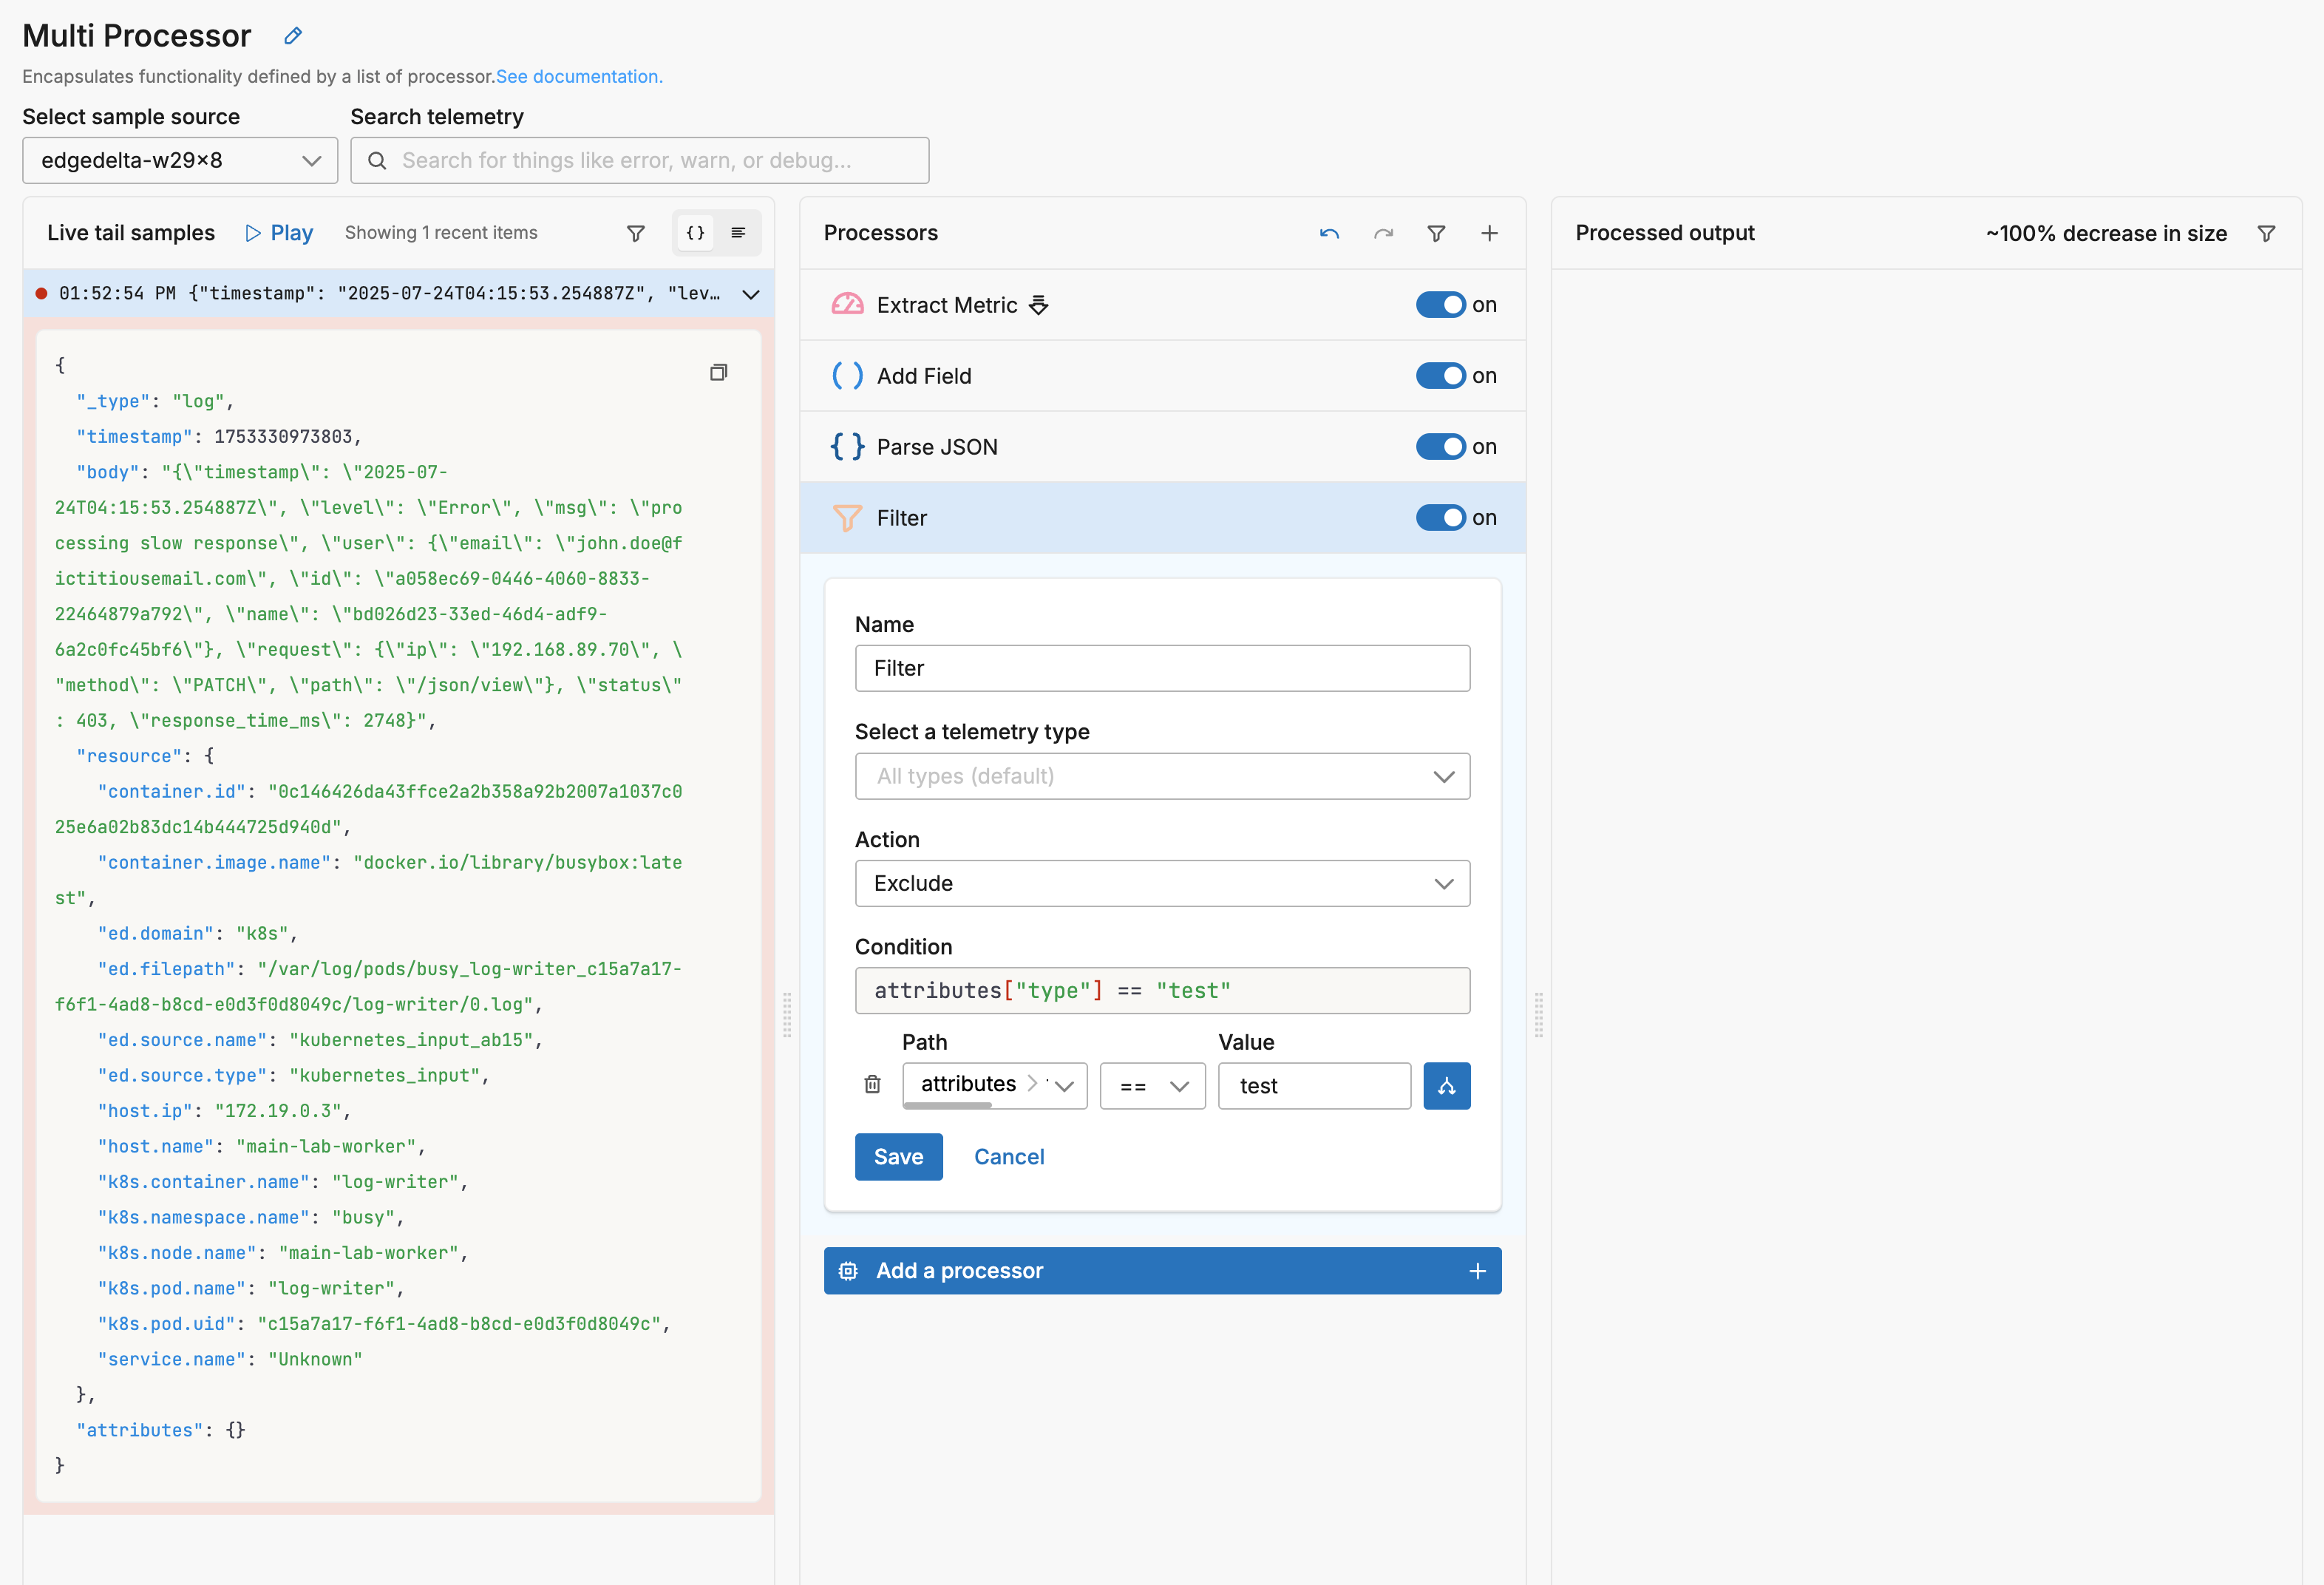
Therefore both data items are deleted and the live capture pane shows no output.
However, let’s open Parse JSON, the previous processor, and enable the Final option.
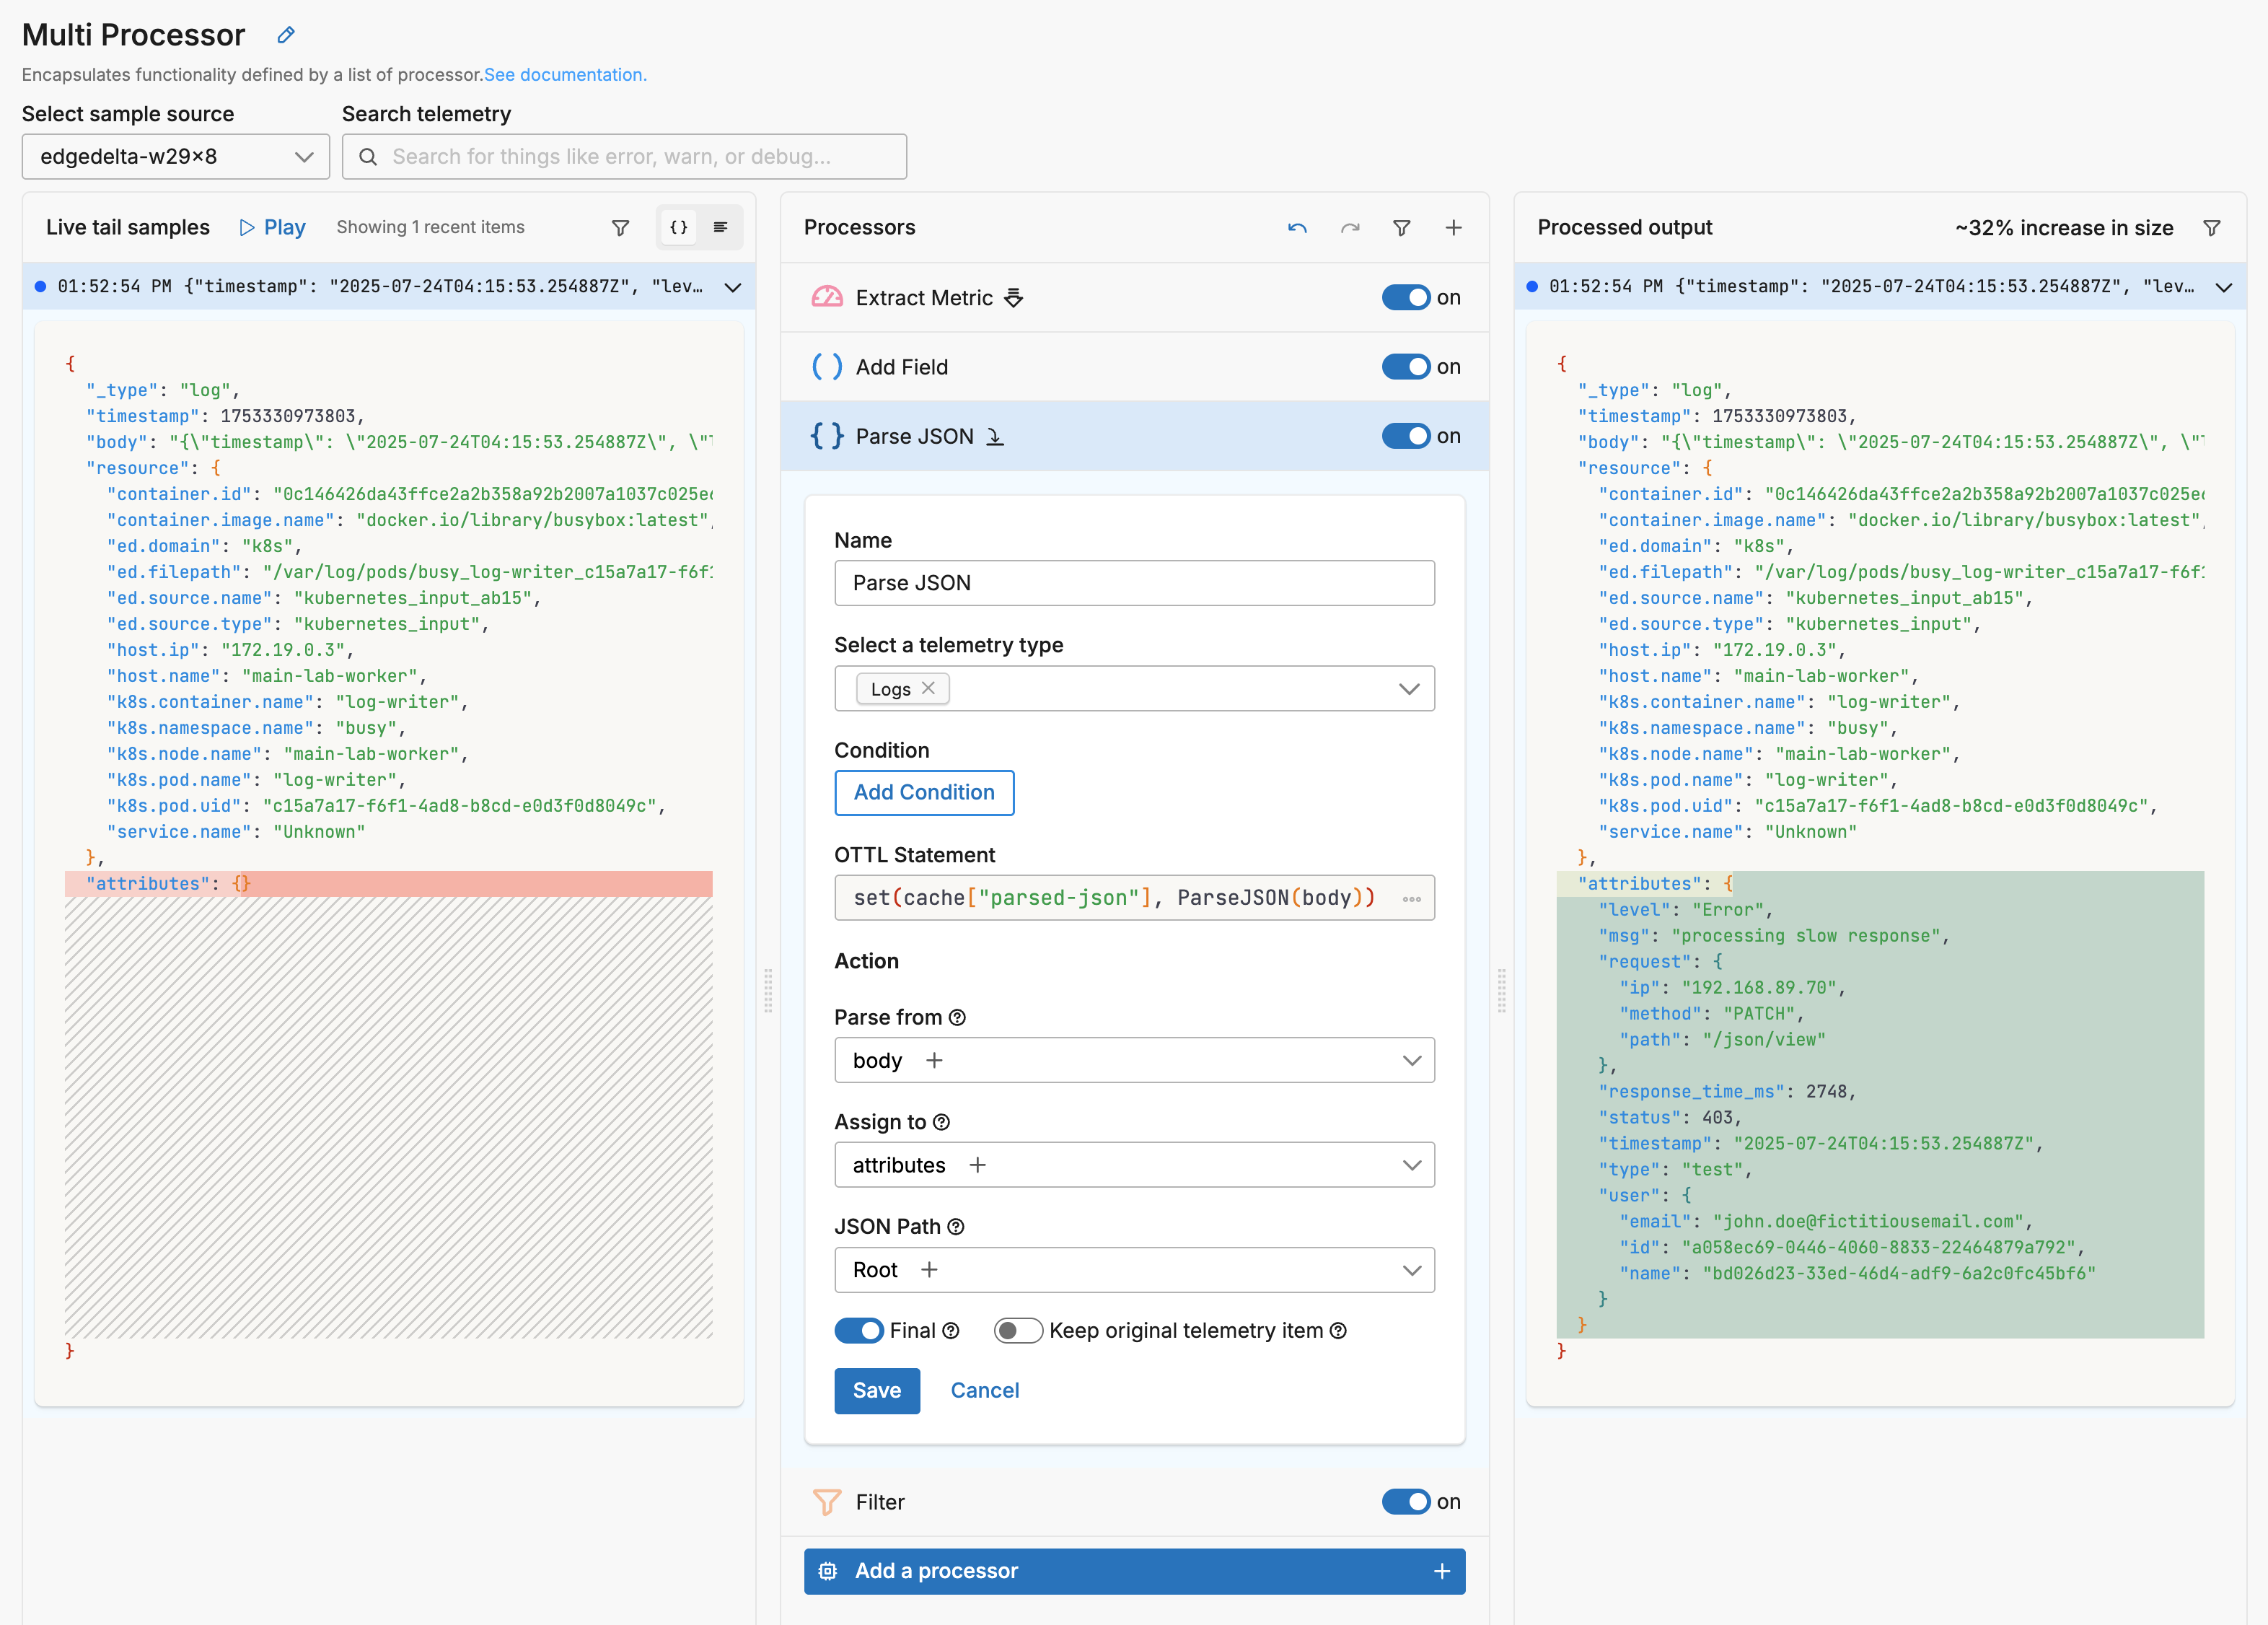
Now the log data item created by the Parse JSON processor (with the parsed attributes) is listed as output despite having a type attribute of test. This is because it exits the multiprocessor after being processed by the Parse JSON processor, and is not filtered out by the Filter processor.
The metric, on the other hand, was not processed by the Parse JSON processor (Select a telemetry type condition was set to Logs). Therefore, it was not affected by the Final option. It continues within the multiprocessor where it is dropped by the Filter processor.
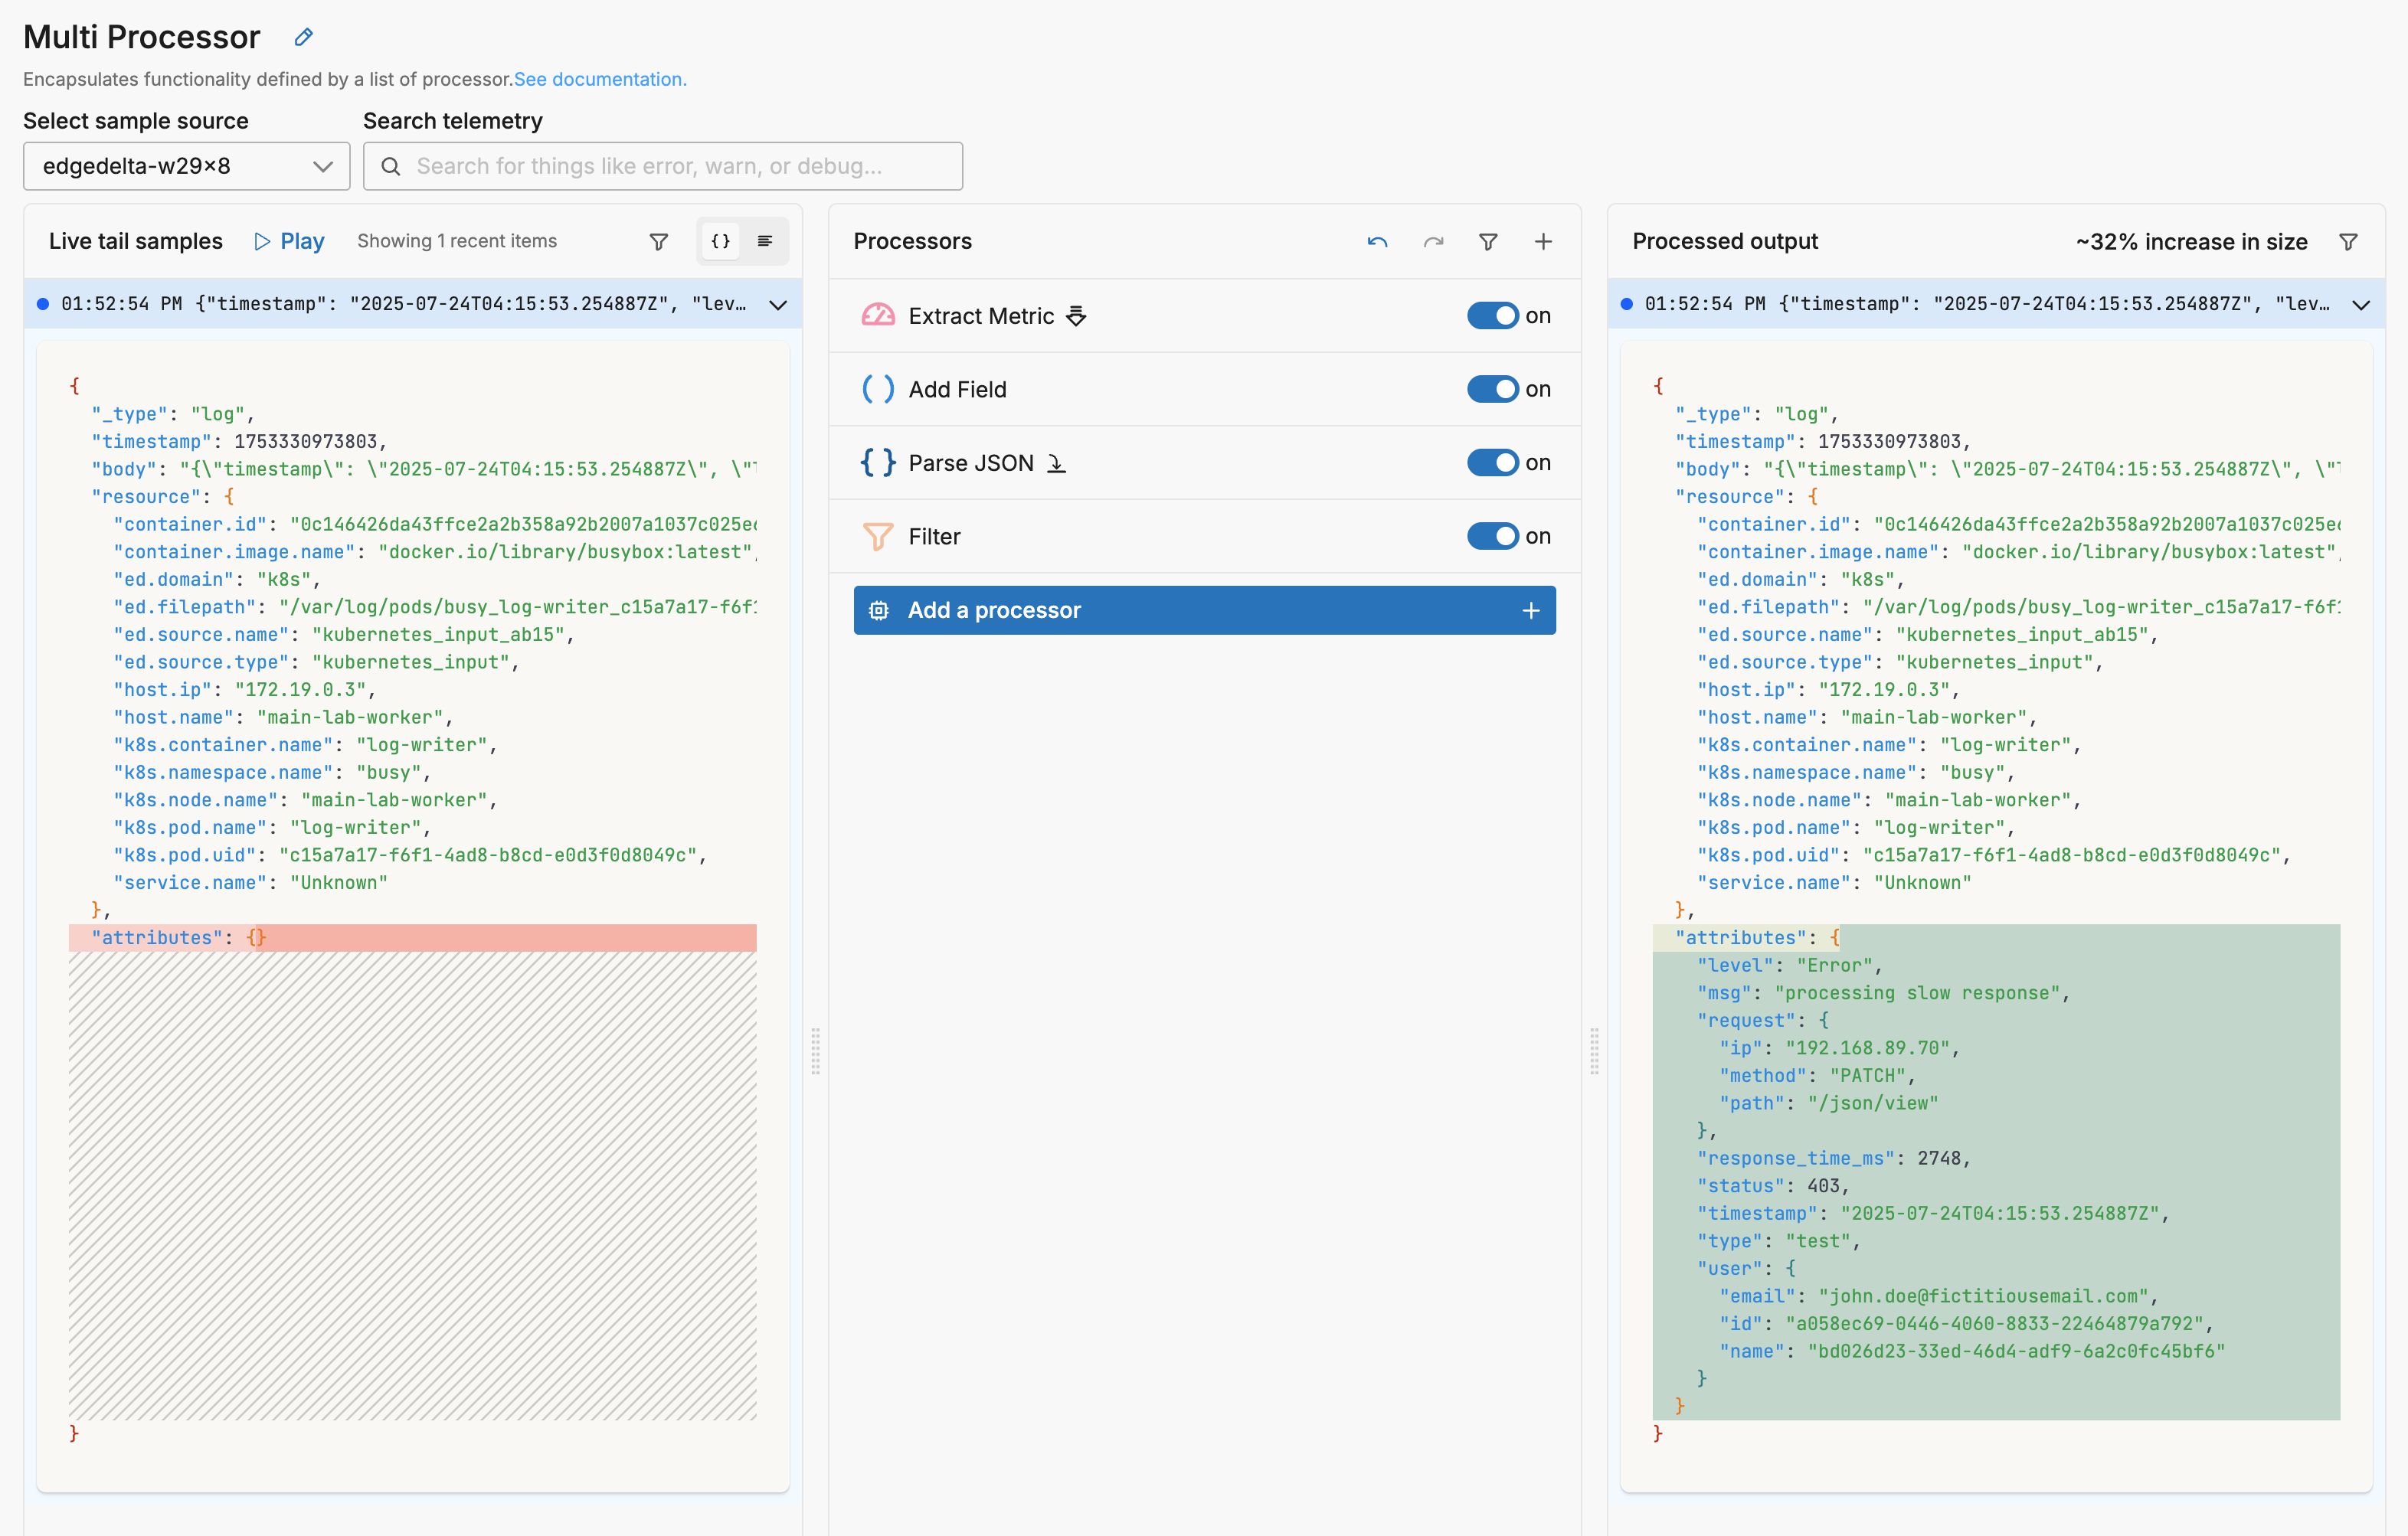
This sequence illustrates a number of concepts.
- The
Select a telemetry typeoption is used as a type condition for processing data items by each processor. Bespoke conditions can also be set on other data fields. - The order of the processors in the stack is significant to its operation
- The output pane of live capture shows the cumulative effect of all the processors, not the selected one.
- Items that are not processed by a processor are passed to the next processor.
- The
Keep original telemetry itemoption adds an additional data item output to the processor: showing the version of each processed data item that entered that processor. - The
Finaloption provides a method of exiting the multiprocessor node early for processed items, but not for unprocessed items.