Composite Monitor
3 minute read
While log, metric and pattern monitors are able to evaluate a wide scope of events across multiple pipelines against thresholds, a composite monitor is able to evaluate events emanating from monitors themselves. This allows you to develop notification trigger logic for wider scale issues across multiple monitor scopes.
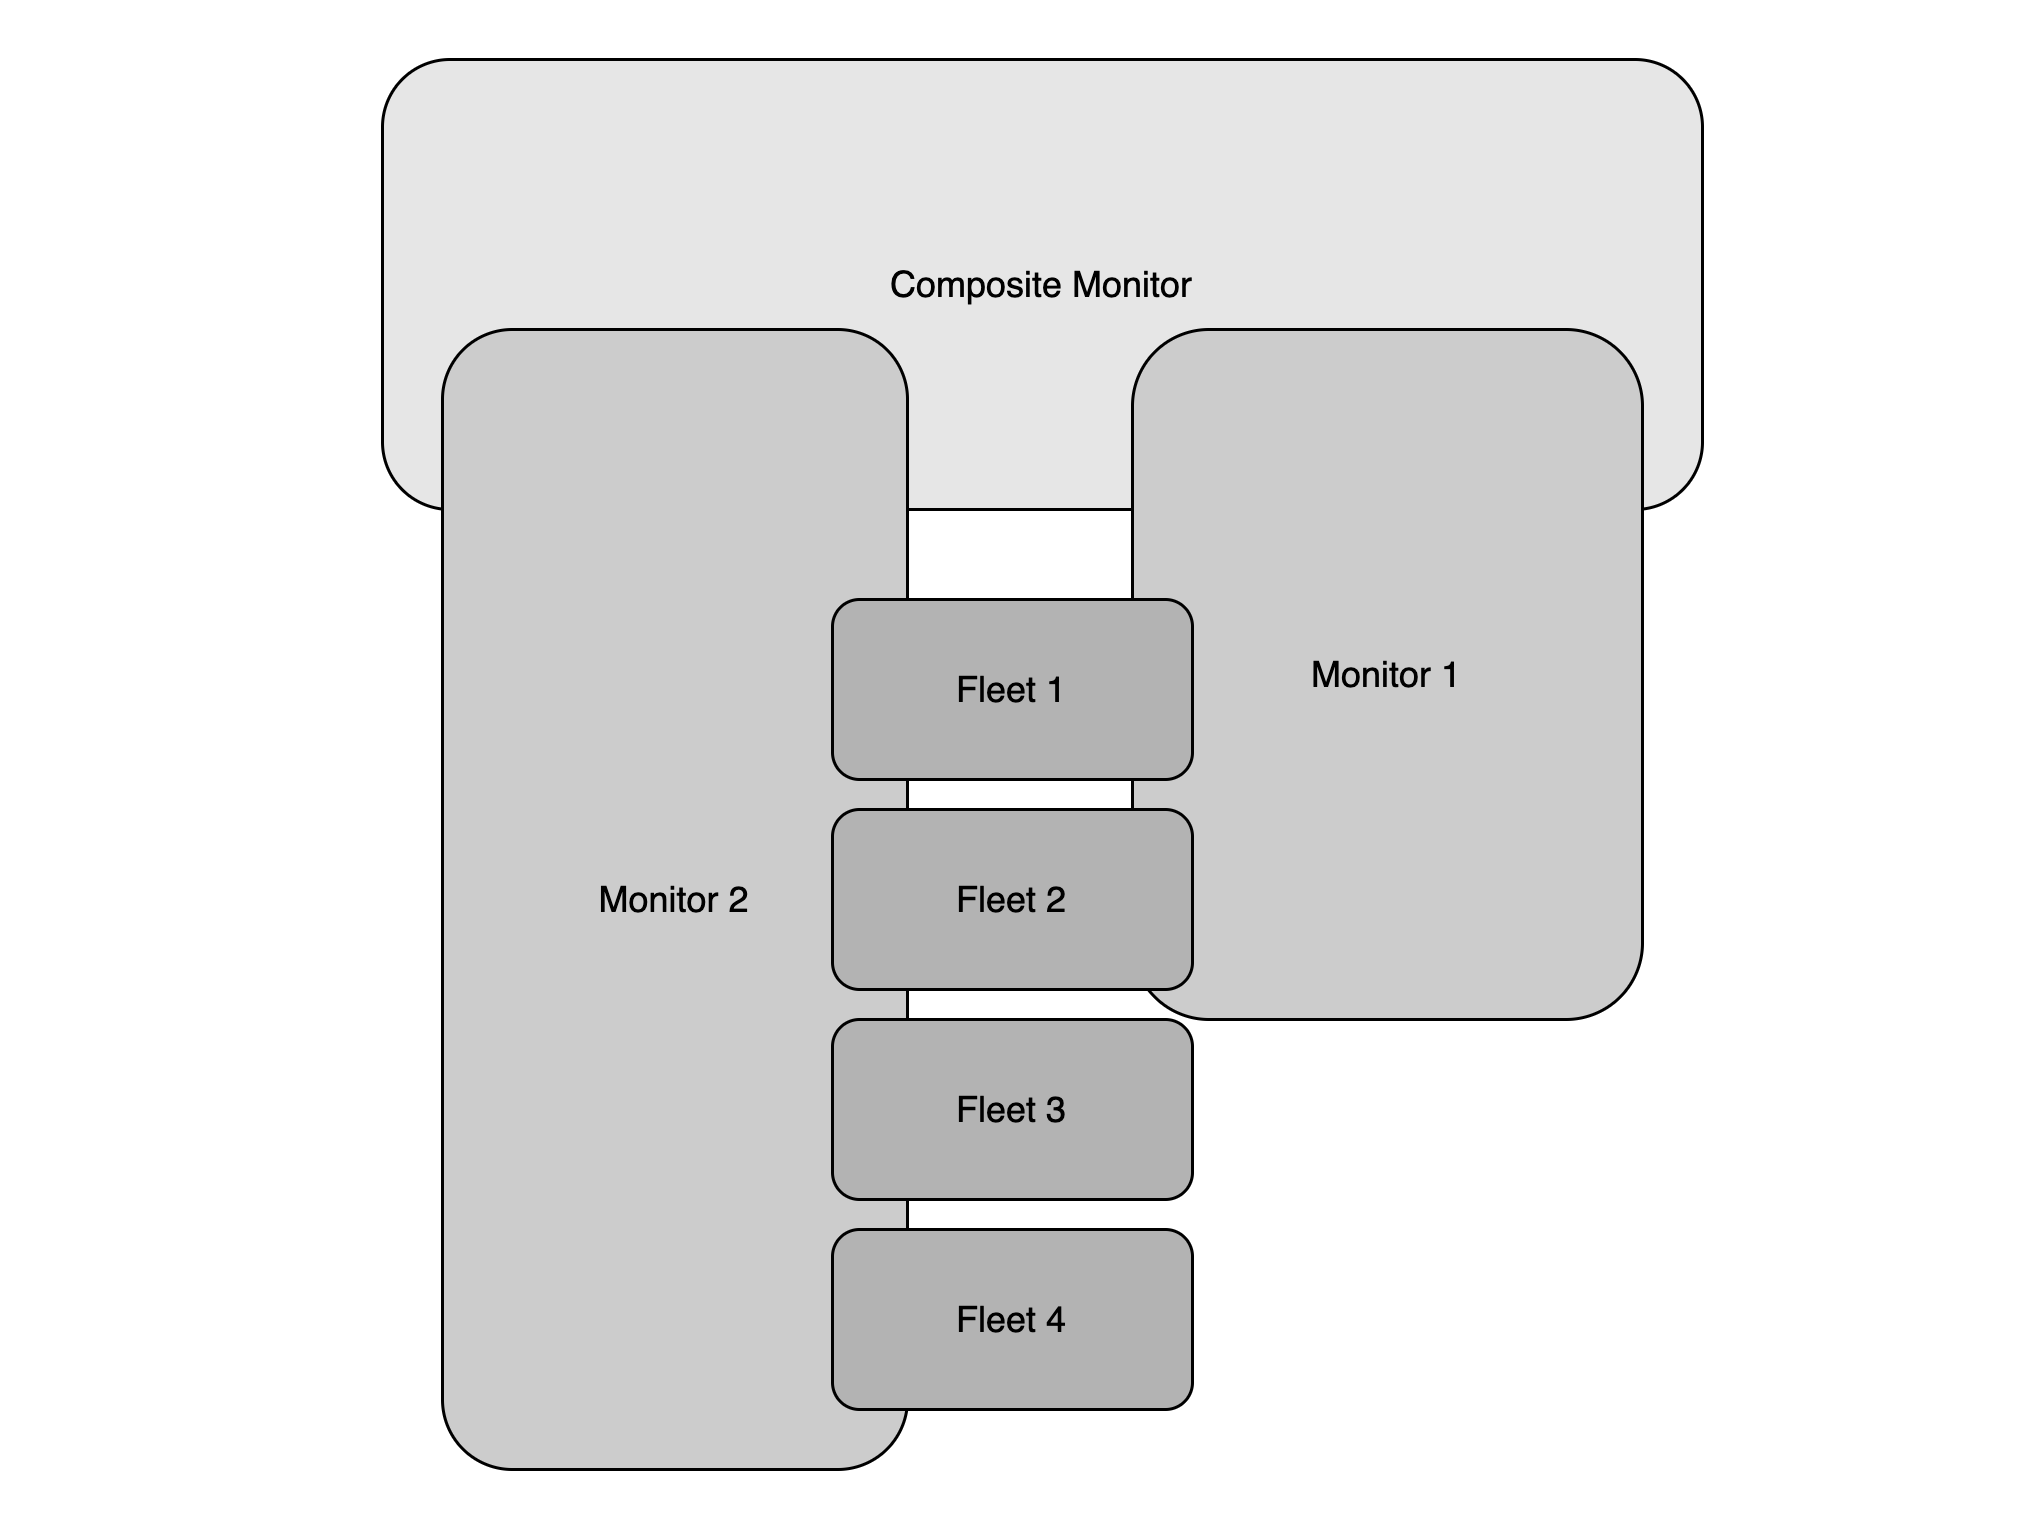
In this illustration, Monitor 1 evaluates pipelines 1 and 2, while Monitor 2 evaluates pipelines 1 to 4. The Composite Monitor evaluates Monitor 1 and Monitor 2. If the Composite Monitor is configured with AND logic, it will trigger a notification only when Monitors 1 and 2 are in triggered state.
Cross-Telemetry Correlation
Composite monitors enable correlation across different telemetry types to create context-aware alerting. Instead of monitoring metrics in isolation, you can combine signals from logs, metrics, and traces to detect issues that only manifest when multiple conditions align.
For example, correlate memory usage metrics with transaction latency to identify performance degradation. Configure one monitor to track memory metrics extracted from logs, another to monitor trace-based latency, and combine them in a composite monitor that alerts only when both thresholds are breached simultaneously.
Health Score Formulas
Create sophisticated health scores using weighted formulas across multiple monitors. This approach normalizes different metrics into a single score that represents overall system health.
Example health score calculation:
normalized_score = 1 - (w1 * normalized_memory + w2 * normalized_latency)

Where:
- normalized_memory = (memory_used - min_mem) / (max_mem - min_mem)
- normalized_latency = (latency - min_lat) / (max_lat - min_lat)
- w1 and w2 are weights (e.g., 0.5 each for equal importance)
Configure thresholds based on the composite score:
- Score > 0.9: System healthy (OK state)
- Score 0.8-0.9: Performance degradation (Warning state)
- Score < 0.8: Critical issues (Alert state)
Apply this pattern at the service level using service-specific monitors, or organization-wide by combining monitors from multiple services. Adjust weights based on business criticality - give higher weight to customer-facing services versus internal systems.
Create a Composite Monitor
To create a Composite monitor,
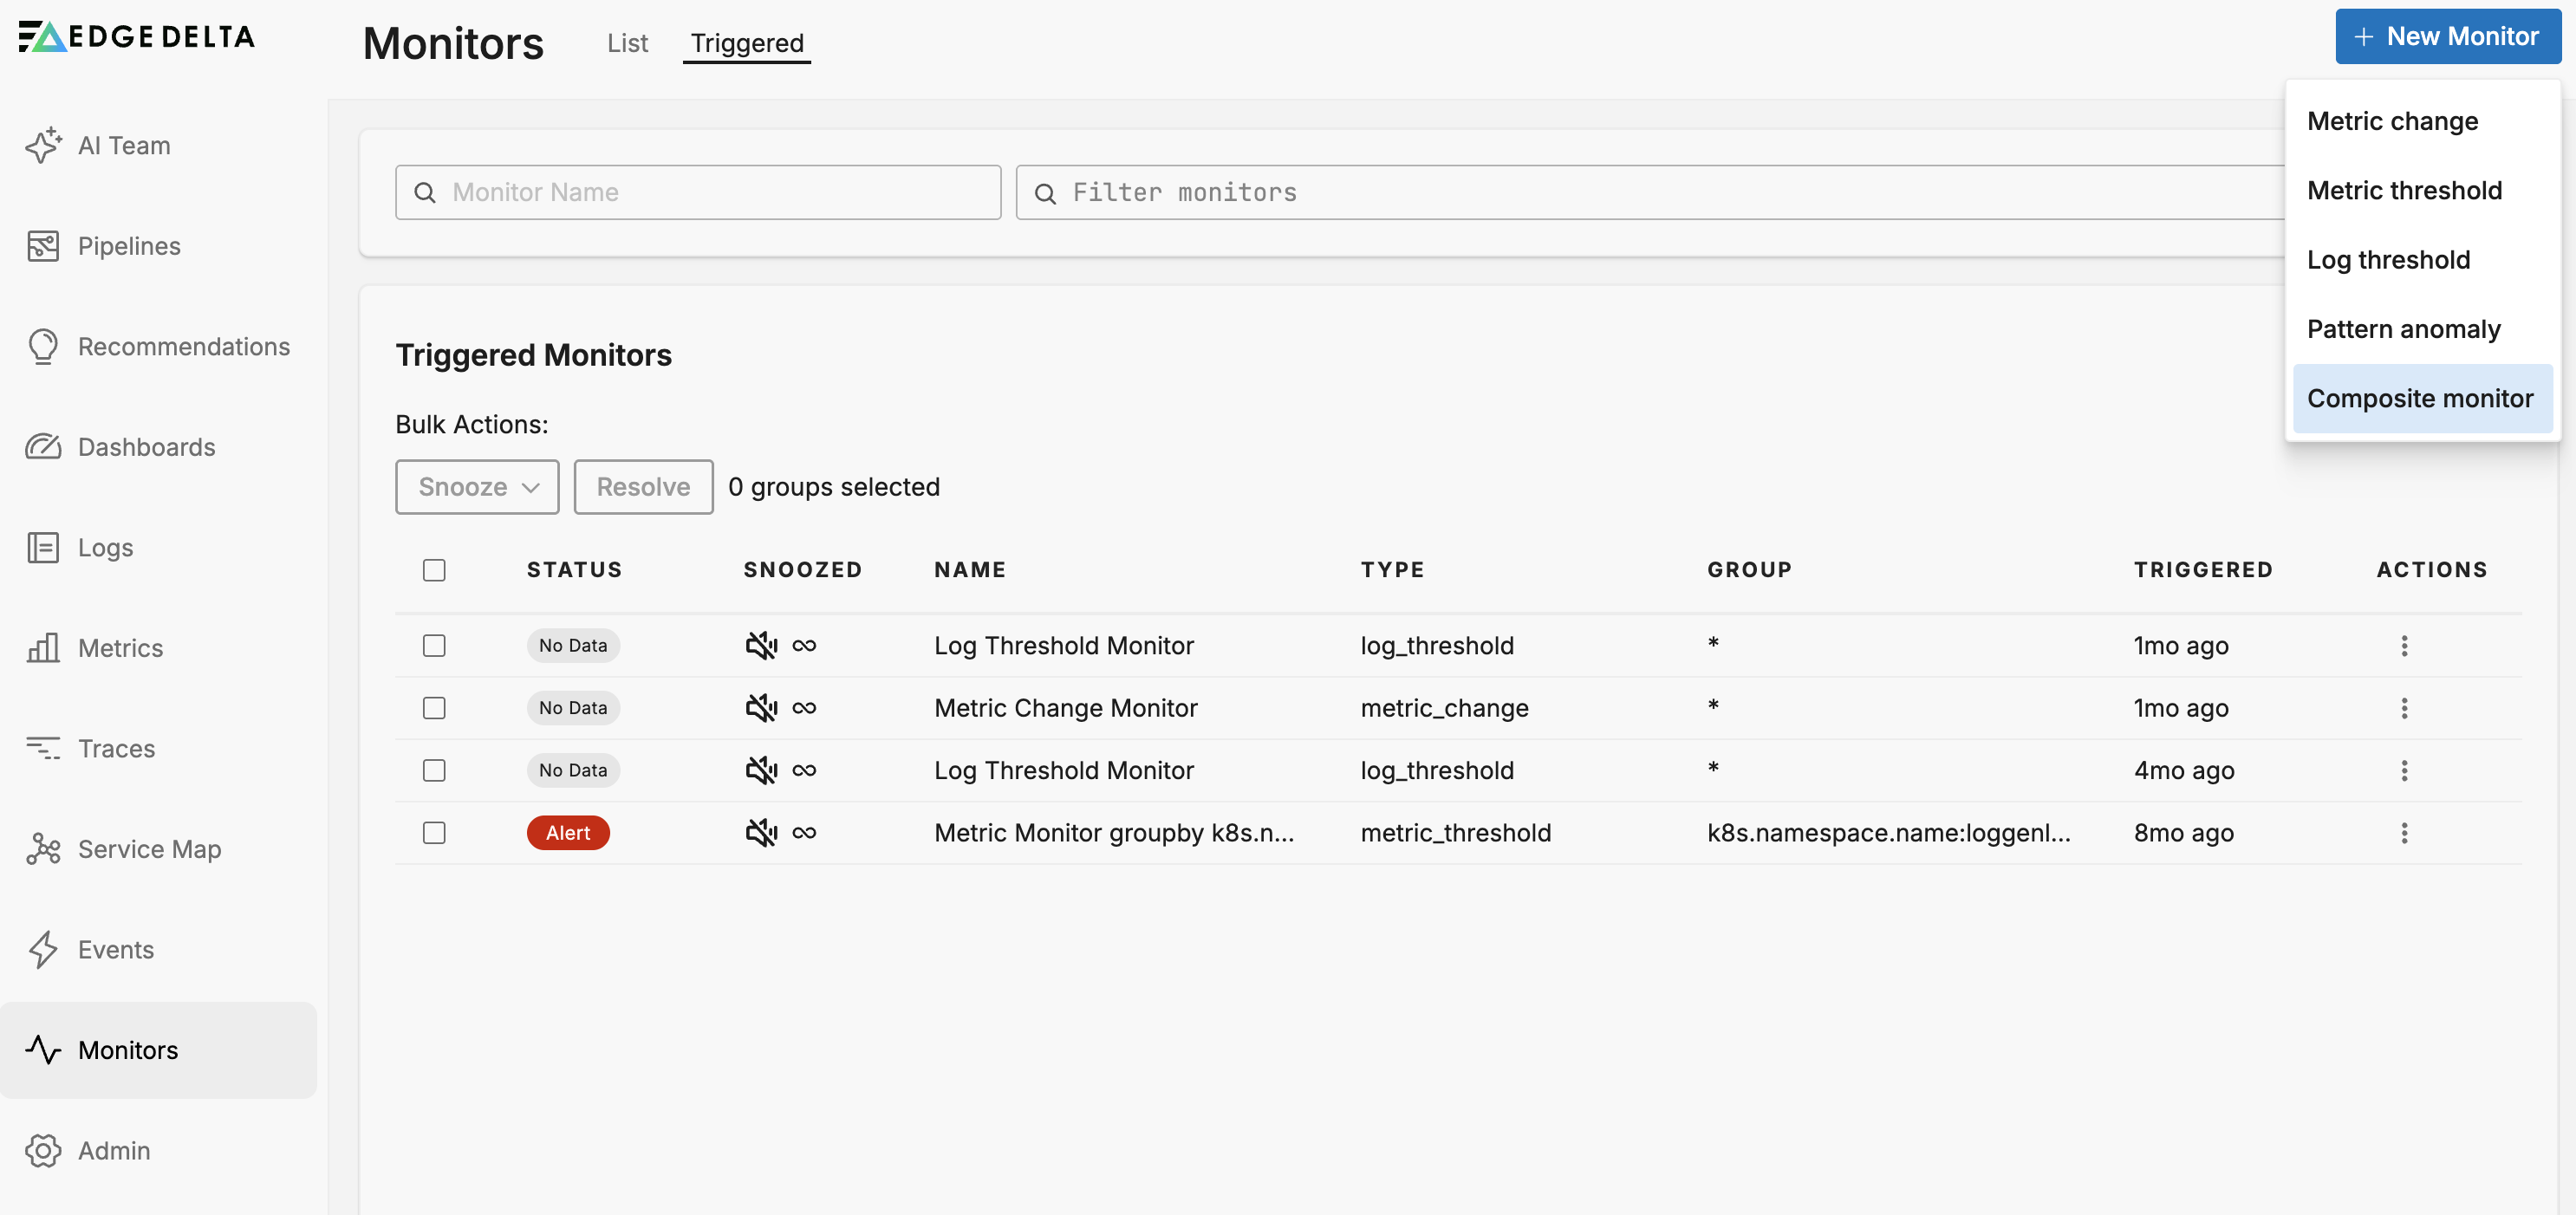
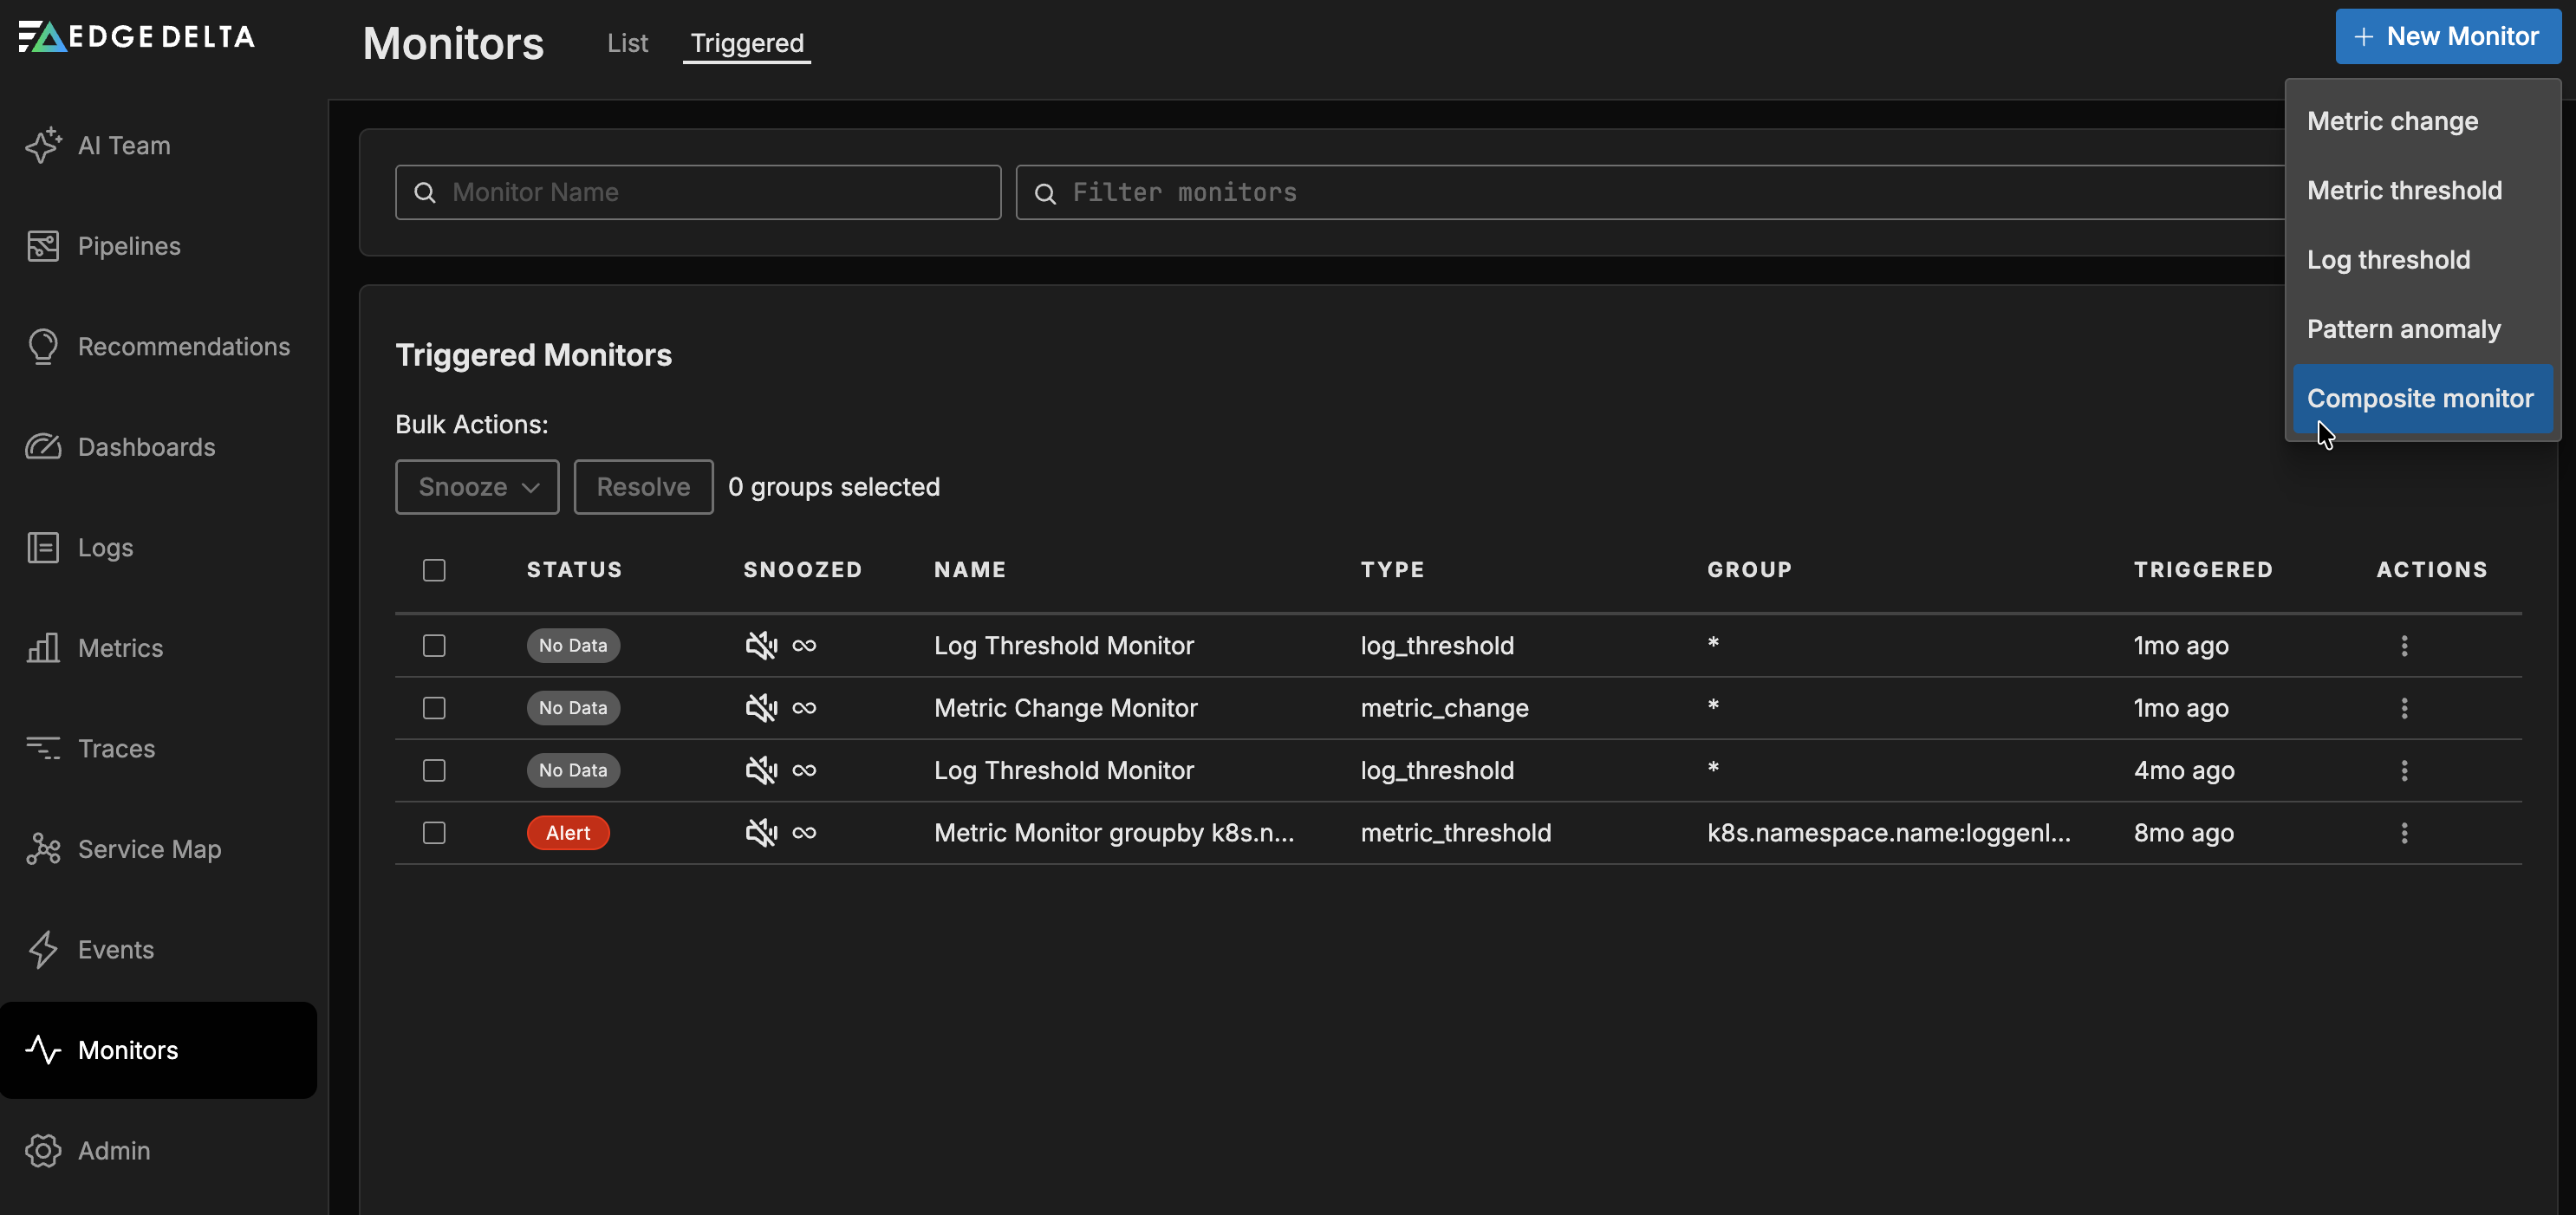
- Click Monitors and select the Triggered tab.
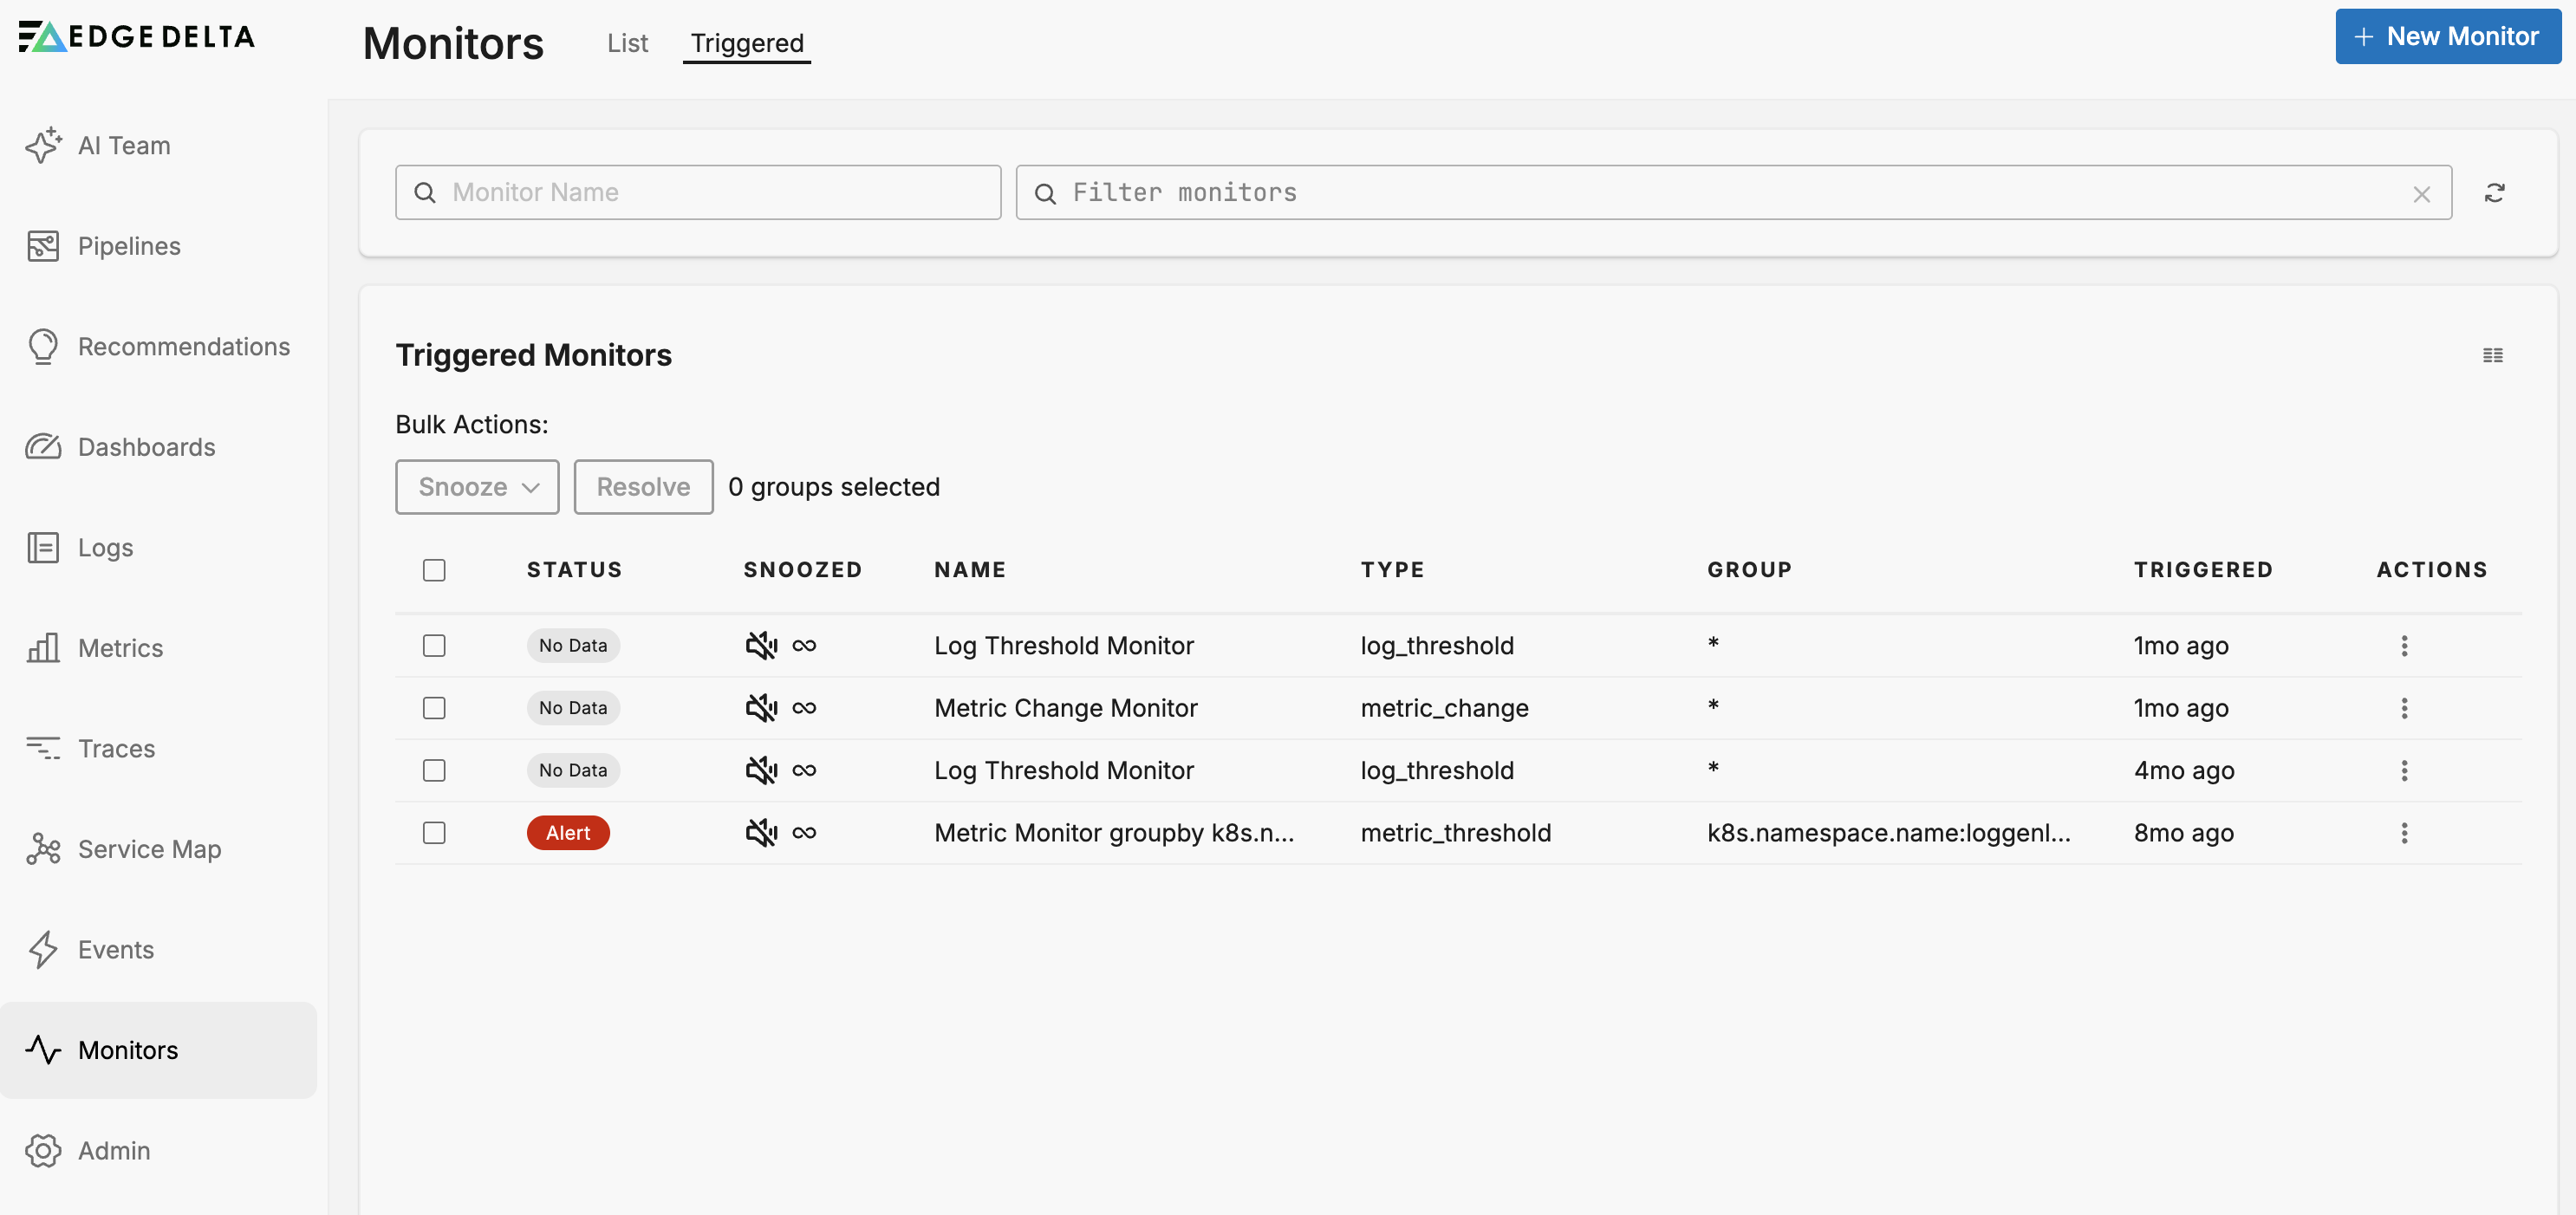
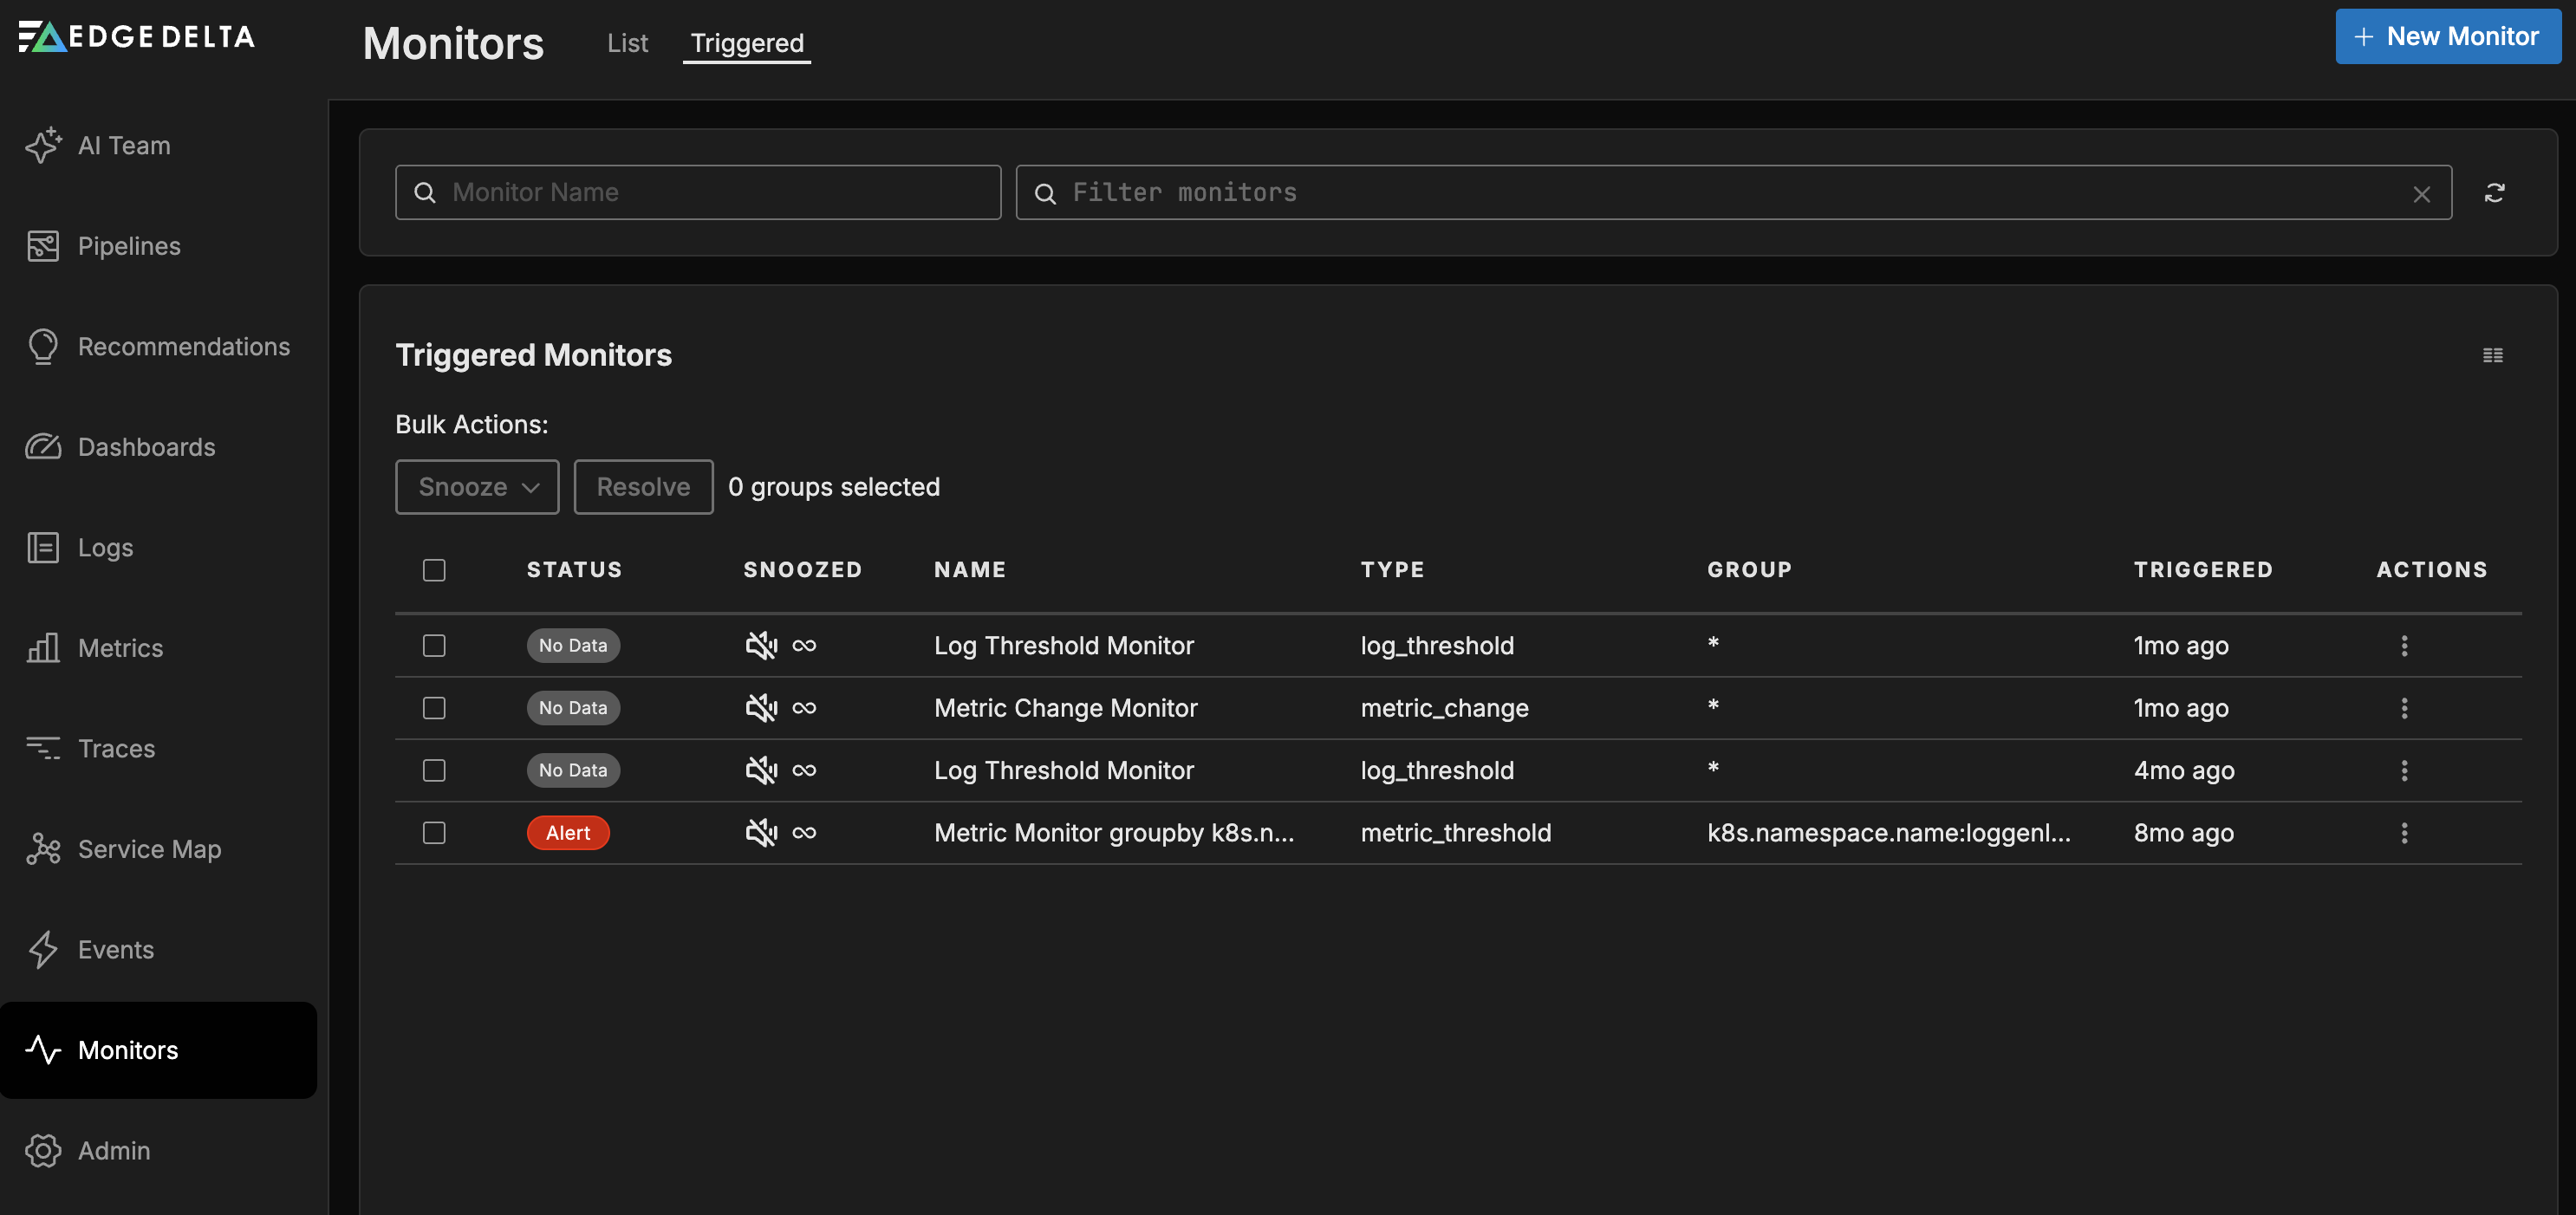
- Click + New Monitor and select Composite.
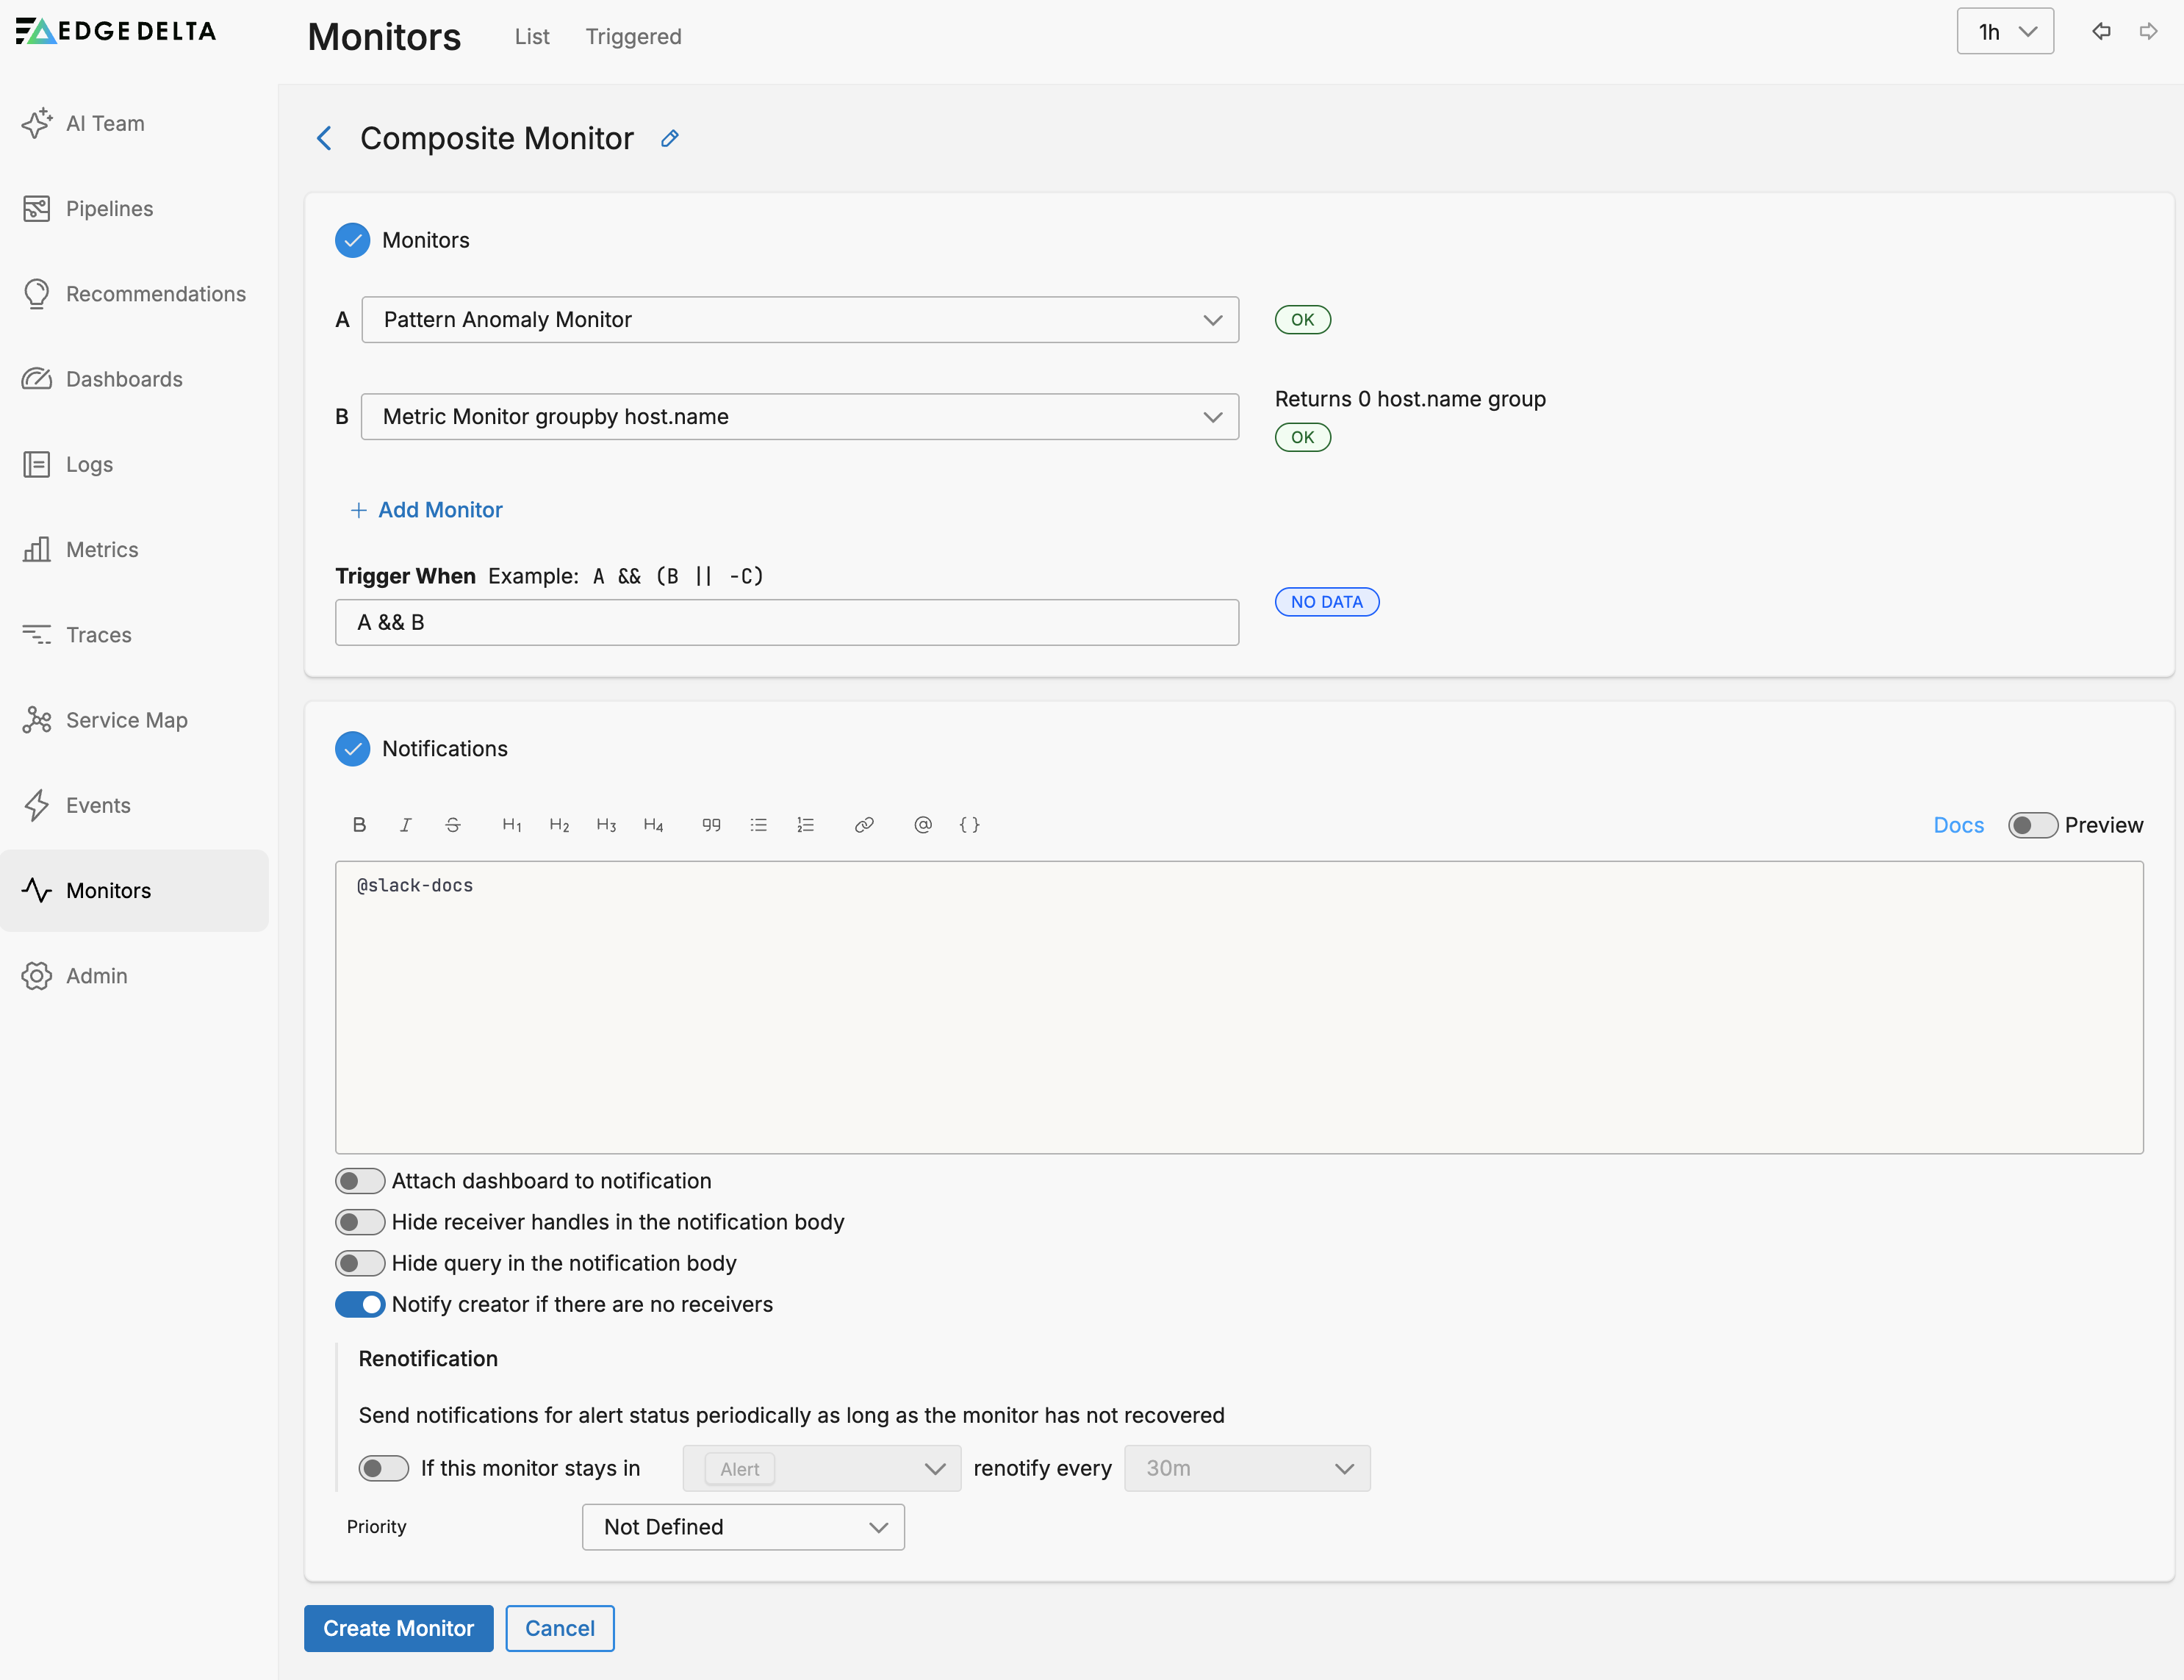
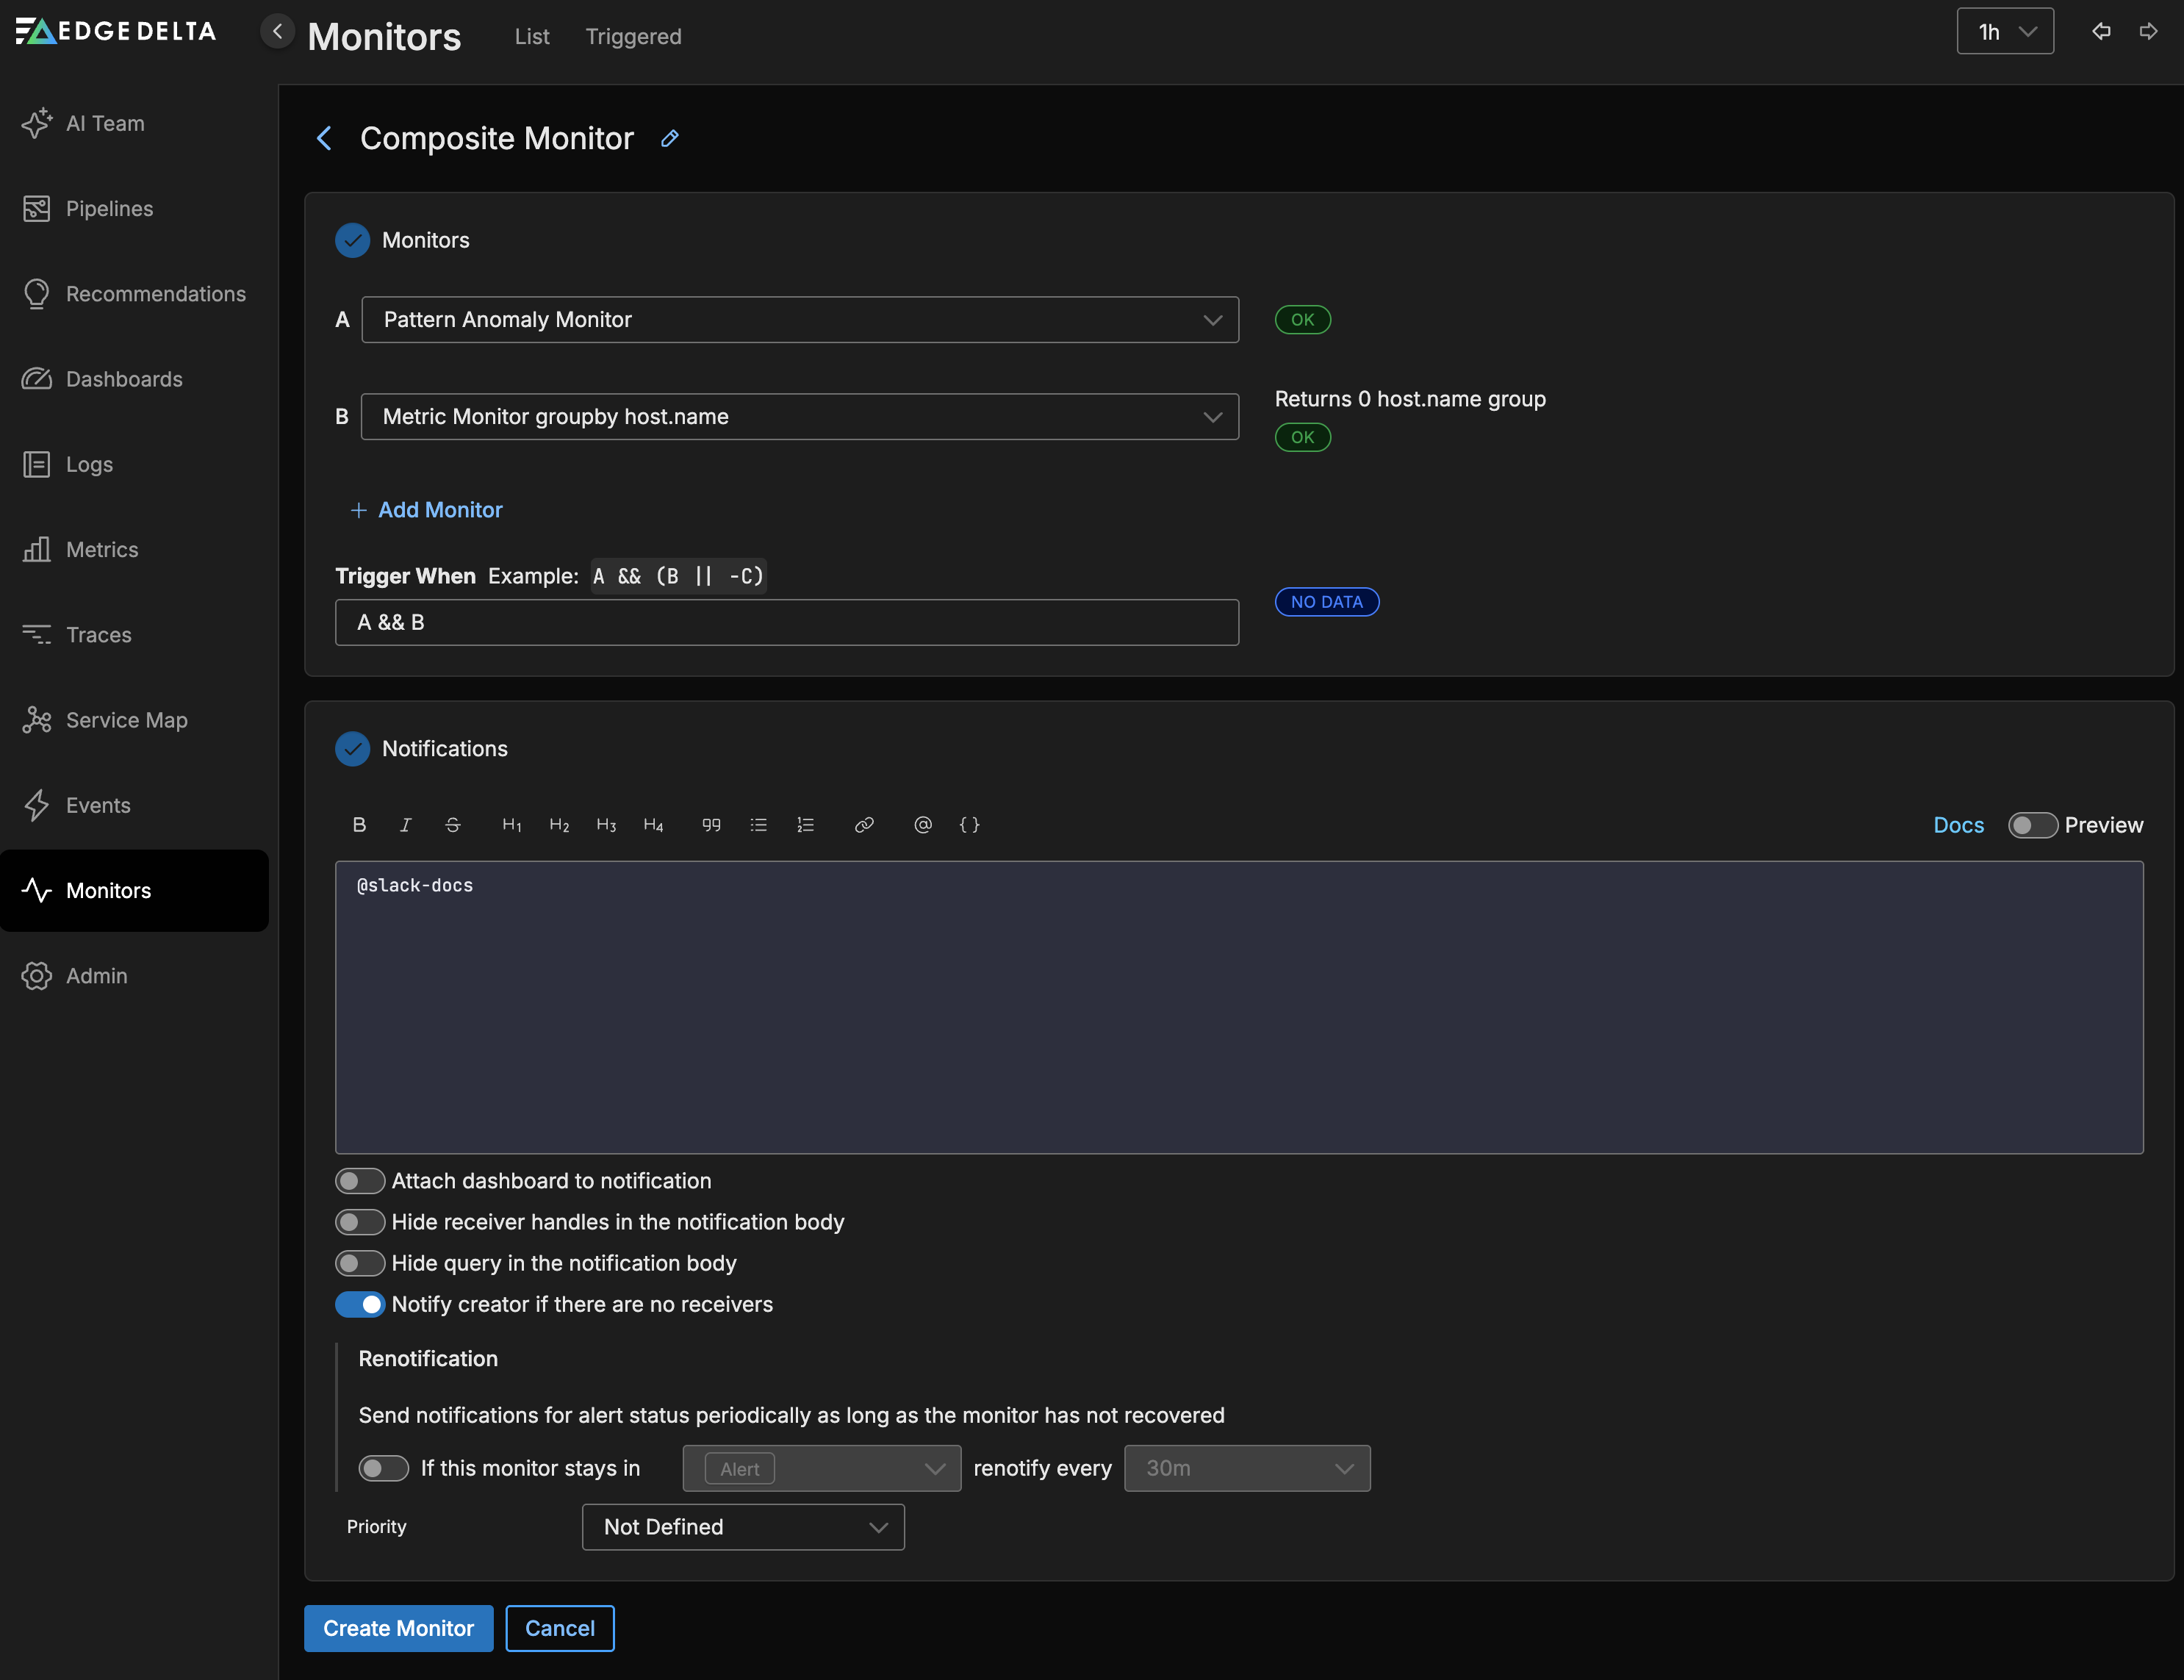
Configure a Composite Monitor
In the Monitors section, you select the monitors you want to include in the composite monitor scope. You can click Add Monitor to include additional monitors.

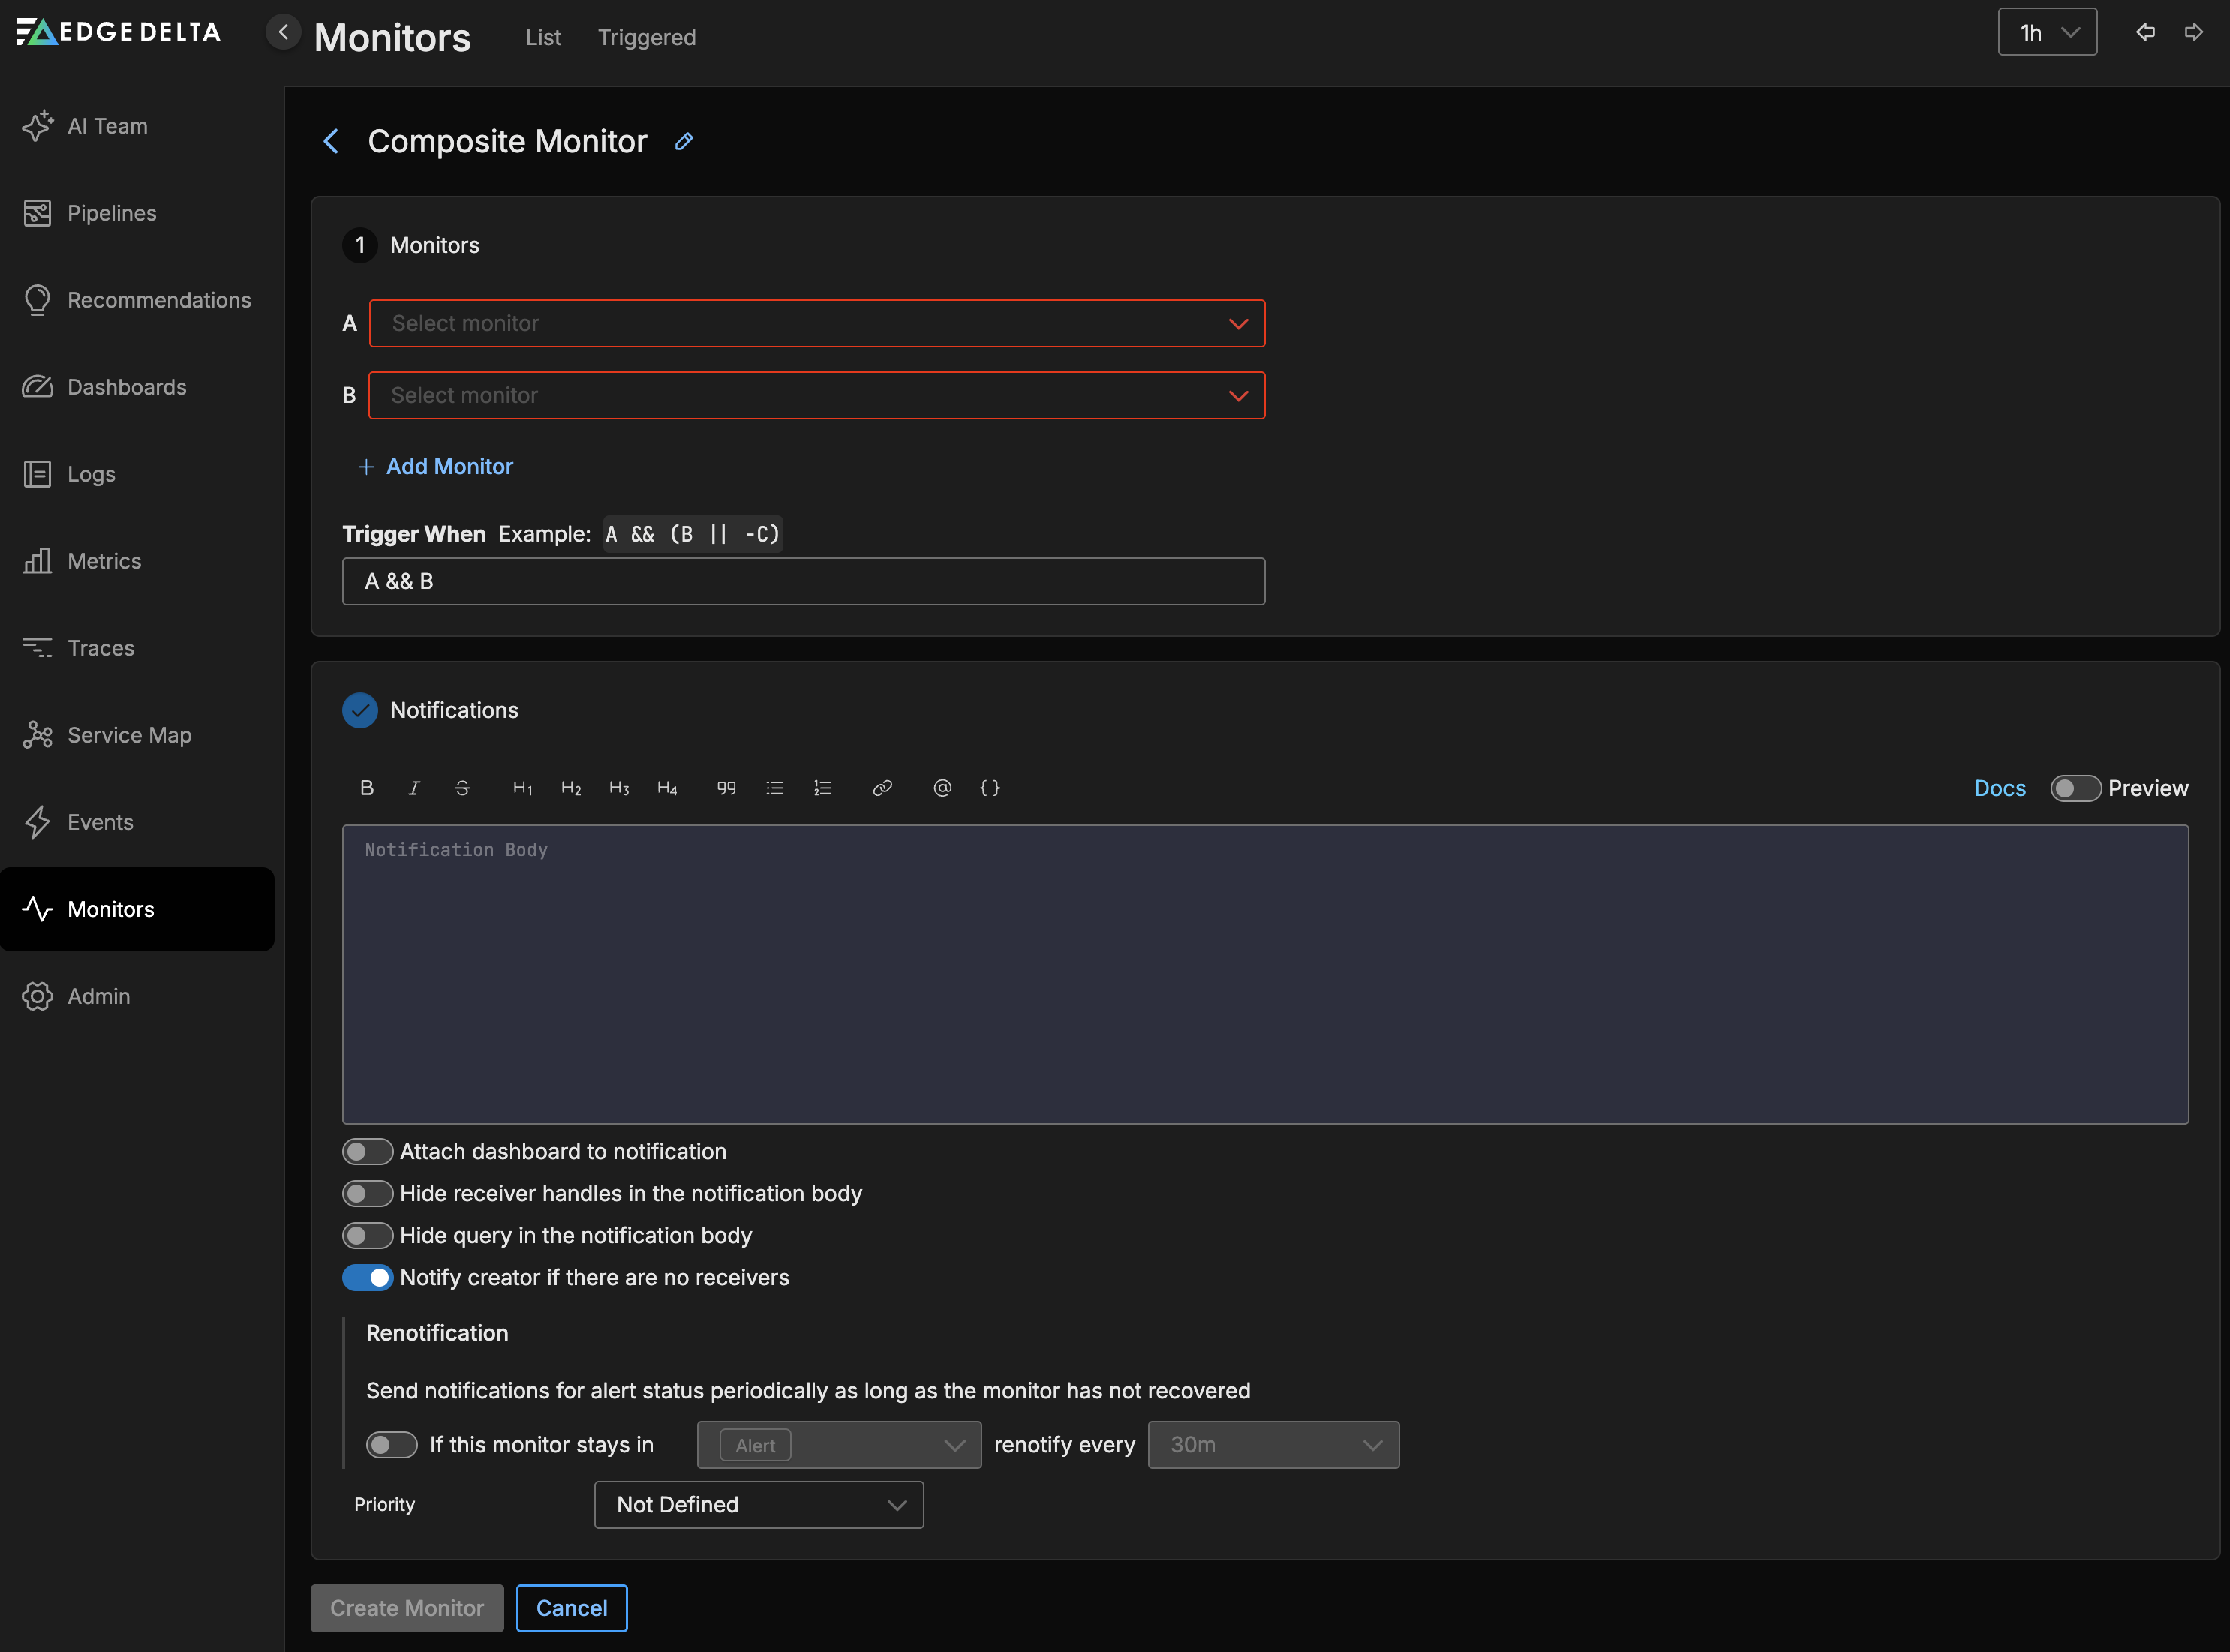
In the Trigger When field you configure the logic for triggering a notification. You can configure AND, OR, and NOT logic, and you can use brackets for grouping:
- A && B: This is the logical AND operation.
- A || B: This is the logical OR operation.
- A && -B: This represents A AND NOT B.
- A && (B || C): A must be true, and at least one of B or C must be true.
- (A && (B || (C && D))): A must be true, and B must be true OR (both C and D must be true).
The triggering of a composite monitor in response to different source monitor statuses is determined by the following logic:
AND Trigger
AND type triggers will match the lowest matching status of the source monitors:
| Monitor A | Monitor B | Composite Monitor |
|---|---|---|
| alert | alert | alert |
| warning | warning | warning |
| alert | warning | warning |
| warning | alert | warning |
OR Trigger
OR type triggers will match the highest matching status of the source monitors:
| Monitor A | Monitor B | Composite Monitor |
|---|---|---|
| alert | OK | alert |
| OK | warning | warning |
| alert | warning | alert |
The type of notification is determined by the configuration of the Notifications section:
Notification
You configure the notification section with different behavior for different composite trigger severity.
{{#is_warning}}
@me@example.com
{{/is_warning}}

{{#is_alert}}
@teams-Microsoft Teams Integration
{{/is_alert}}
For details on configuring notifications, see Monitor Notifications
Example
In this example, the alert will trigger when both monitors are in the alert state. It will send a notification to a Slack channel, and it will include a Dashboard called My Dashboard in the notification.