Default Edge Delta Configuration
2 minute read
Overview
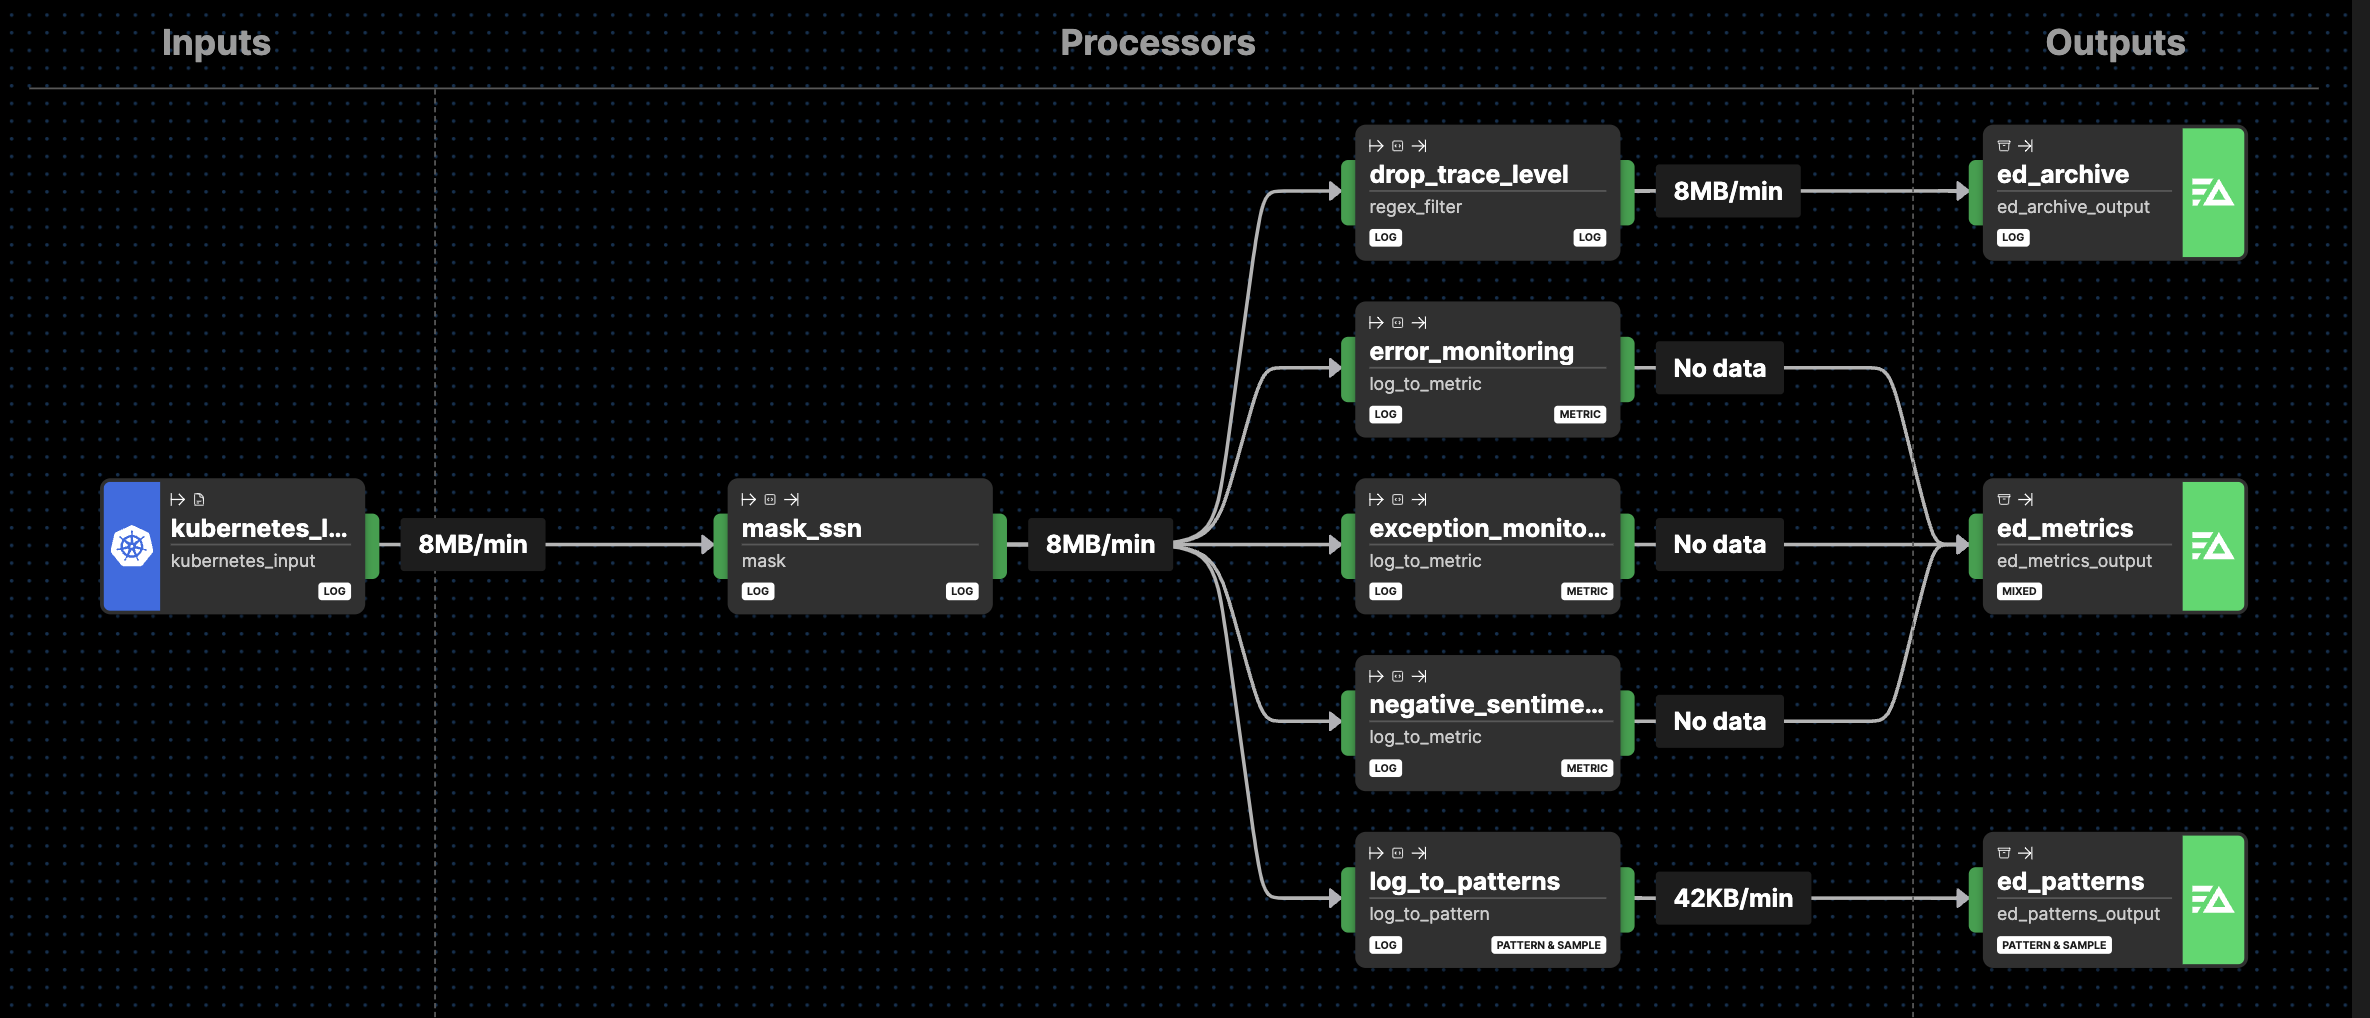
When you create a new pipeline, it includes a default pipeline configuration based on the options you select and the sources detected. This is an example of a default pipeline in a Kubernetes environment.
Nodes and Links
Inputs
kubernetes_input
The Kubernetes input node allows you to specify which Kubernetes pods and namespaces the agent should monitor. This node is configured to include logs from all namespaces (k8s.namespace.name=.*) while excluding logs from pods named edgedelta (k8s.pod.name=edgedelta).
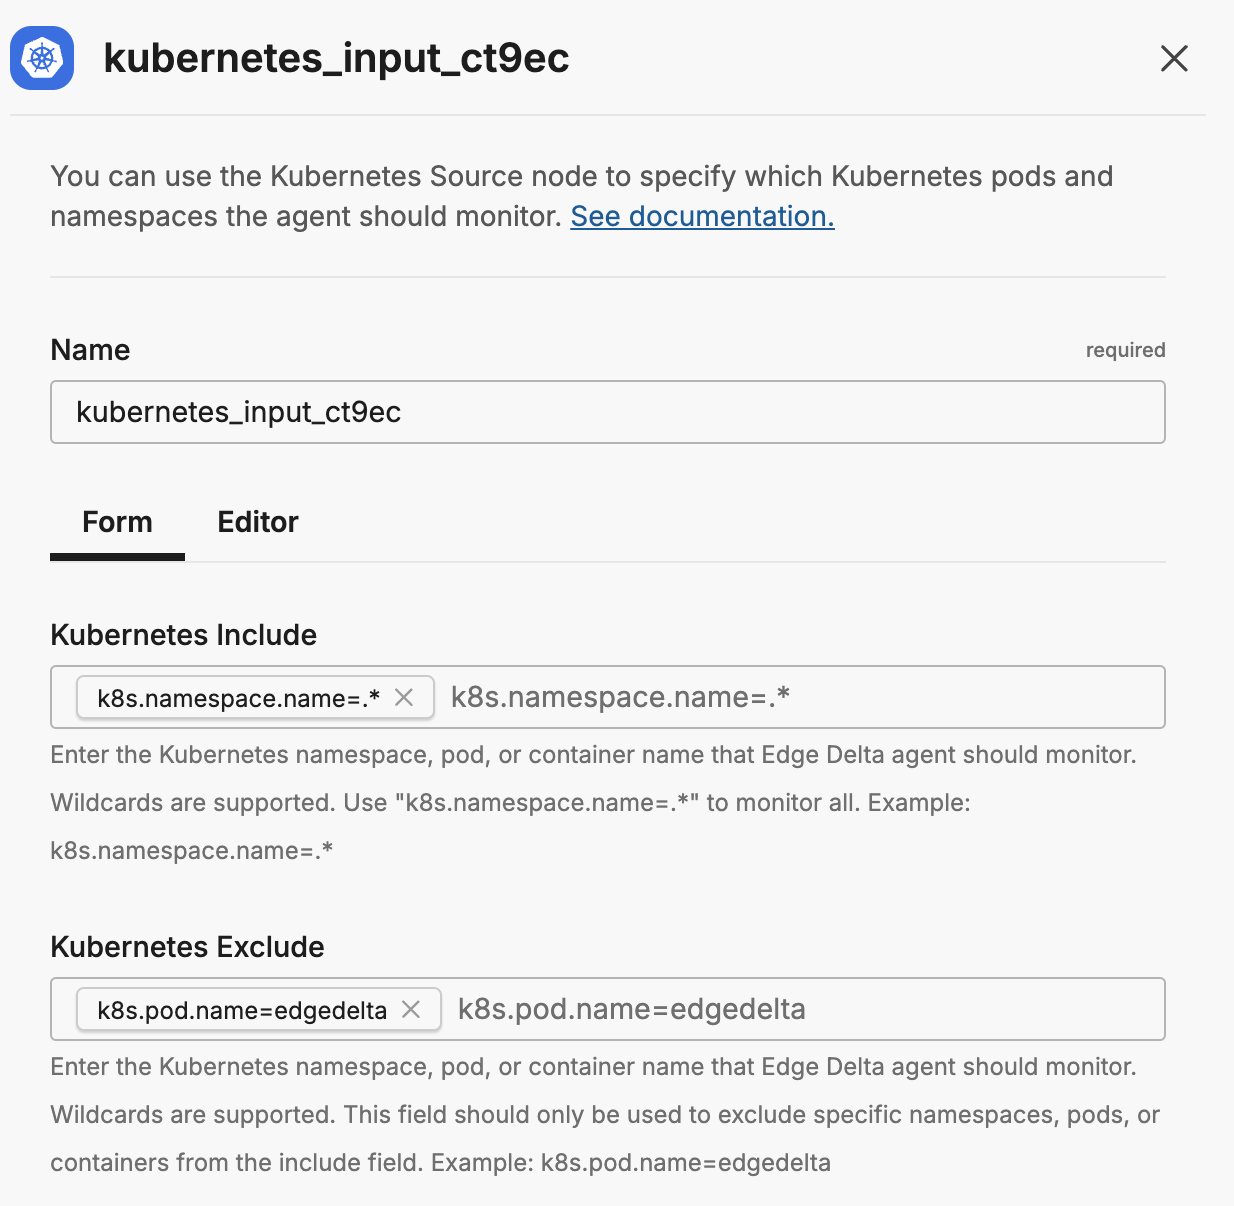
This form creates the following YAML configuration:
- name: kubernetes_input
  type: kubernetes_input
  include:
  - k8s.namespace.name=.*
  exclude:
  - k8s.pod.name=edgedelta
For more information on configuring Kubernetes input nodes, see the Kubernetes Source Documentation. It is connected to the mask node using a link.
Processors
Log to Pattern
A log to pattern node named log_to_patterns is connected downstream to the kubernetes_input node in the default configuration. It reports every minute to the edgedelta destination node with any patterns and samples detected on the edge.
Patterns and samples detected by this node on the edge, as well as any detected in post-processing on the backend, can be explored on the Patterns tab of the Logs page.
See Log to Pattern node for more information.
Outputs
The default configuration sends data to an Edge Delta output:
Edge Delta Destination
The Edge Delta Destination node is used to send all pipeline data to the Edge Delta back end to power various functionalities including Log Search, metrics explorer, and pattern detection.