Live Capture and In-Stream Debugging
Explore Live Capture and In-Stream Debugging for building and testing pipelines using live data with Edge Delta.
6 minute read
Overview
Effective pipeline design turns on your knowledge of your data. Live capture makes your actual data visible and enables you to preview the expected output of pipeline processors as you build them.
A coordinator is required for live tail to work in clusters with more than 20 nodes. For smaller clusters, a coordinator is optional but recommended for production deployments—it reduces backend overhead and improves live capture coverage across nodes.
Live Capture is designed with enterprise security in mind. The live capture data:
- Temporary Storage: Data is stored in secure Redis-based cache with automatic expiration:
- Payload data (captured items): 10 minutes
- Task status information: 1 hour
- Note: These TTL limits are enforced when a write occurs. If no new data is written to the cache, existing items may remain visible beyond the stated limits until the next write operation triggers expiration cleanup.
- Secure Transmission: All data is transmitted over TLS-encrypted HTTPS connections between the agent and Edge Delta backend.
- Transient by Design: Data is not persisted to permanent storage and is automatically removed when the capture window expires.
- Data Flow: The agent polls for capture tasks every 5 seconds and uploads captured data every 1 second via encrypted HTTPS POST requests to the Edge Delta backend API.
Resource Impact
Live Capture has a measurable resource cost that scales with data volume:
Resource Consumption:
- Memory: 15-20% overhead in high-volume environments due to in-memory caching of captured items
- CPU: Additional processing for JSON marshaling and serialization
- Network: Periodic uploads to Edge Delta backend (every 1 second during active capture)
When Resource Impact Matters:
- High-volume production environments (>50GB/day per agent)
- Resource-constrained deployments
- Agents already experiencing memory pressure
For detailed optimization strategies, see Reducing Agent Resource Consumption.
Configuring Live Capture
Minimum Agent Version for Pipeline Settings: v2.11.0
Starting with agent v2.11.0, live capture settings can be configured in the Pipeline Settings tab or with environment variables. To avoid unexpected behavior, ensure pipeline settings and environment variables are set to the same values.
Disabling Live Capture
If either the pipeline setting or the ED_DISABLE_LIVE_CAPTURE environment variable disables live capture, it is disabled. Both must enable live capture for it to be active.
You can disable live capture using the Pipeline Settings tab (v2.11.0+) or the ED_DISABLE_LIVE_CAPTURE environment variable:
Via Pipeline Settings (Recommended):
Navigate to your pipeline’s Settings tab, open the Live Tail section, and toggle the Enabled switch off.
Via Environment Variable:
ED_DISABLE_LIVE_CAPTURE=1
Configuration via Helm:
helm upgrade edgedelta edgedelta/edgedelta \
  --set 'envs[0].name=ED_DISABLE_LIVE_CAPTURE' \
  --set 'envs[0].value=1' \
  -n edgedelta
Linux/macOS:
export ED_ENV_VARS="ED_DISABLE_LIVE_CAPTURE=1"
Docker:
-e "ED_DISABLE_LIVE_CAPTURE=1"
When disabled, the agent will not collect or transmit any live capture data to the Edge Delta backend. This is useful in environments where:
- Resource Optimization: High-volume production environments where 15-20% resource savings are significant
- Security/Compliance: Regulatory requirements prohibit real-time data sampling
- Network Restrictions: Network policies restrict outbound data transmission (see Firewall Rules for required endpoints)
- Data Control: Security policies mandate strict control over data leaving the environment
Note: Disabling live capture will prevent you from using in-stream debugging features and viewing live data samples in the Edge Delta UI. Consider keeping it enabled in development and staging environments where pipeline building and troubleshooting are active.
Note: After disabling live capture, existing data in the cache does not expire automatically based on time alone. Old data only expires when new data is written, which triggers the TTL cleanup. If no new data is being written to the pipeline, previously captured data may remain visible in the UI indefinitely until the pipeline is re-enabled and new data flows through.
For complete documentation on environment variables, see Environment Variables.
Managing Large Payloads
When viewing large payloads in live capture, the Edge Delta UI may experience performance issues or freezing. To prevent this, you can configure payload truncation using Pipeline Settings (v2.11.0+) or environment variables (v2.7.0+).
Via Pipeline Settings (Recommended for v2.11.0+):
Navigate to your pipeline’s Settings tab, open the Live Tail section, and configure the Item Max Body Size and Item Truncation Size fields.
Via Environment Variables:
ED_CAPTURER_ITEM_MAX_BODY_SIZE: Controls the maximum size of the body field in captured items before truncation is applied. Specify the size with units (e.g.,
500KB,1MB).ED_CAPTURER_ITEM_TRUNCATION_SIZE: Defines the size threshold that triggers item truncation. When a captured item exceeds this size, it will be truncated to prevent UI performance issues. Specify the size with units (e.g.,
100KB,200KB).
Configuration via Helm:
helm upgrade edgedelta edgedelta/edgedelta \
  --set 'envs[0].name=ED_CAPTURER_ITEM_MAX_BODY_SIZE' \
  --set 'envs[0].value=500KB' \
  --set 'envs[1].name=ED_CAPTURER_ITEM_TRUNCATION_SIZE' \
  --set 'envs[1].value=100KB' \
  -n edgedelta
Linux/macOS:
export ED_ENV_VARS="ED_CAPTURER_ITEM_MAX_BODY_SIZE=500KB ED_CAPTURER_ITEM_TRUNCATION_SIZE=100KB"
Docker:
-e "ED_CAPTURER_ITEM_MAX_BODY_SIZE=500KB" \
-e "ED_CAPTURER_ITEM_TRUNCATION_SIZE=100KB"
These settings help maintain UI responsiveness when working with pipelines that process large log entries or payloads during the design and testing phase.
For complete documentation on environment variables, see Environment Variables.
Live Tail Samples
To view live tail samples, open a processor node in edit mode:
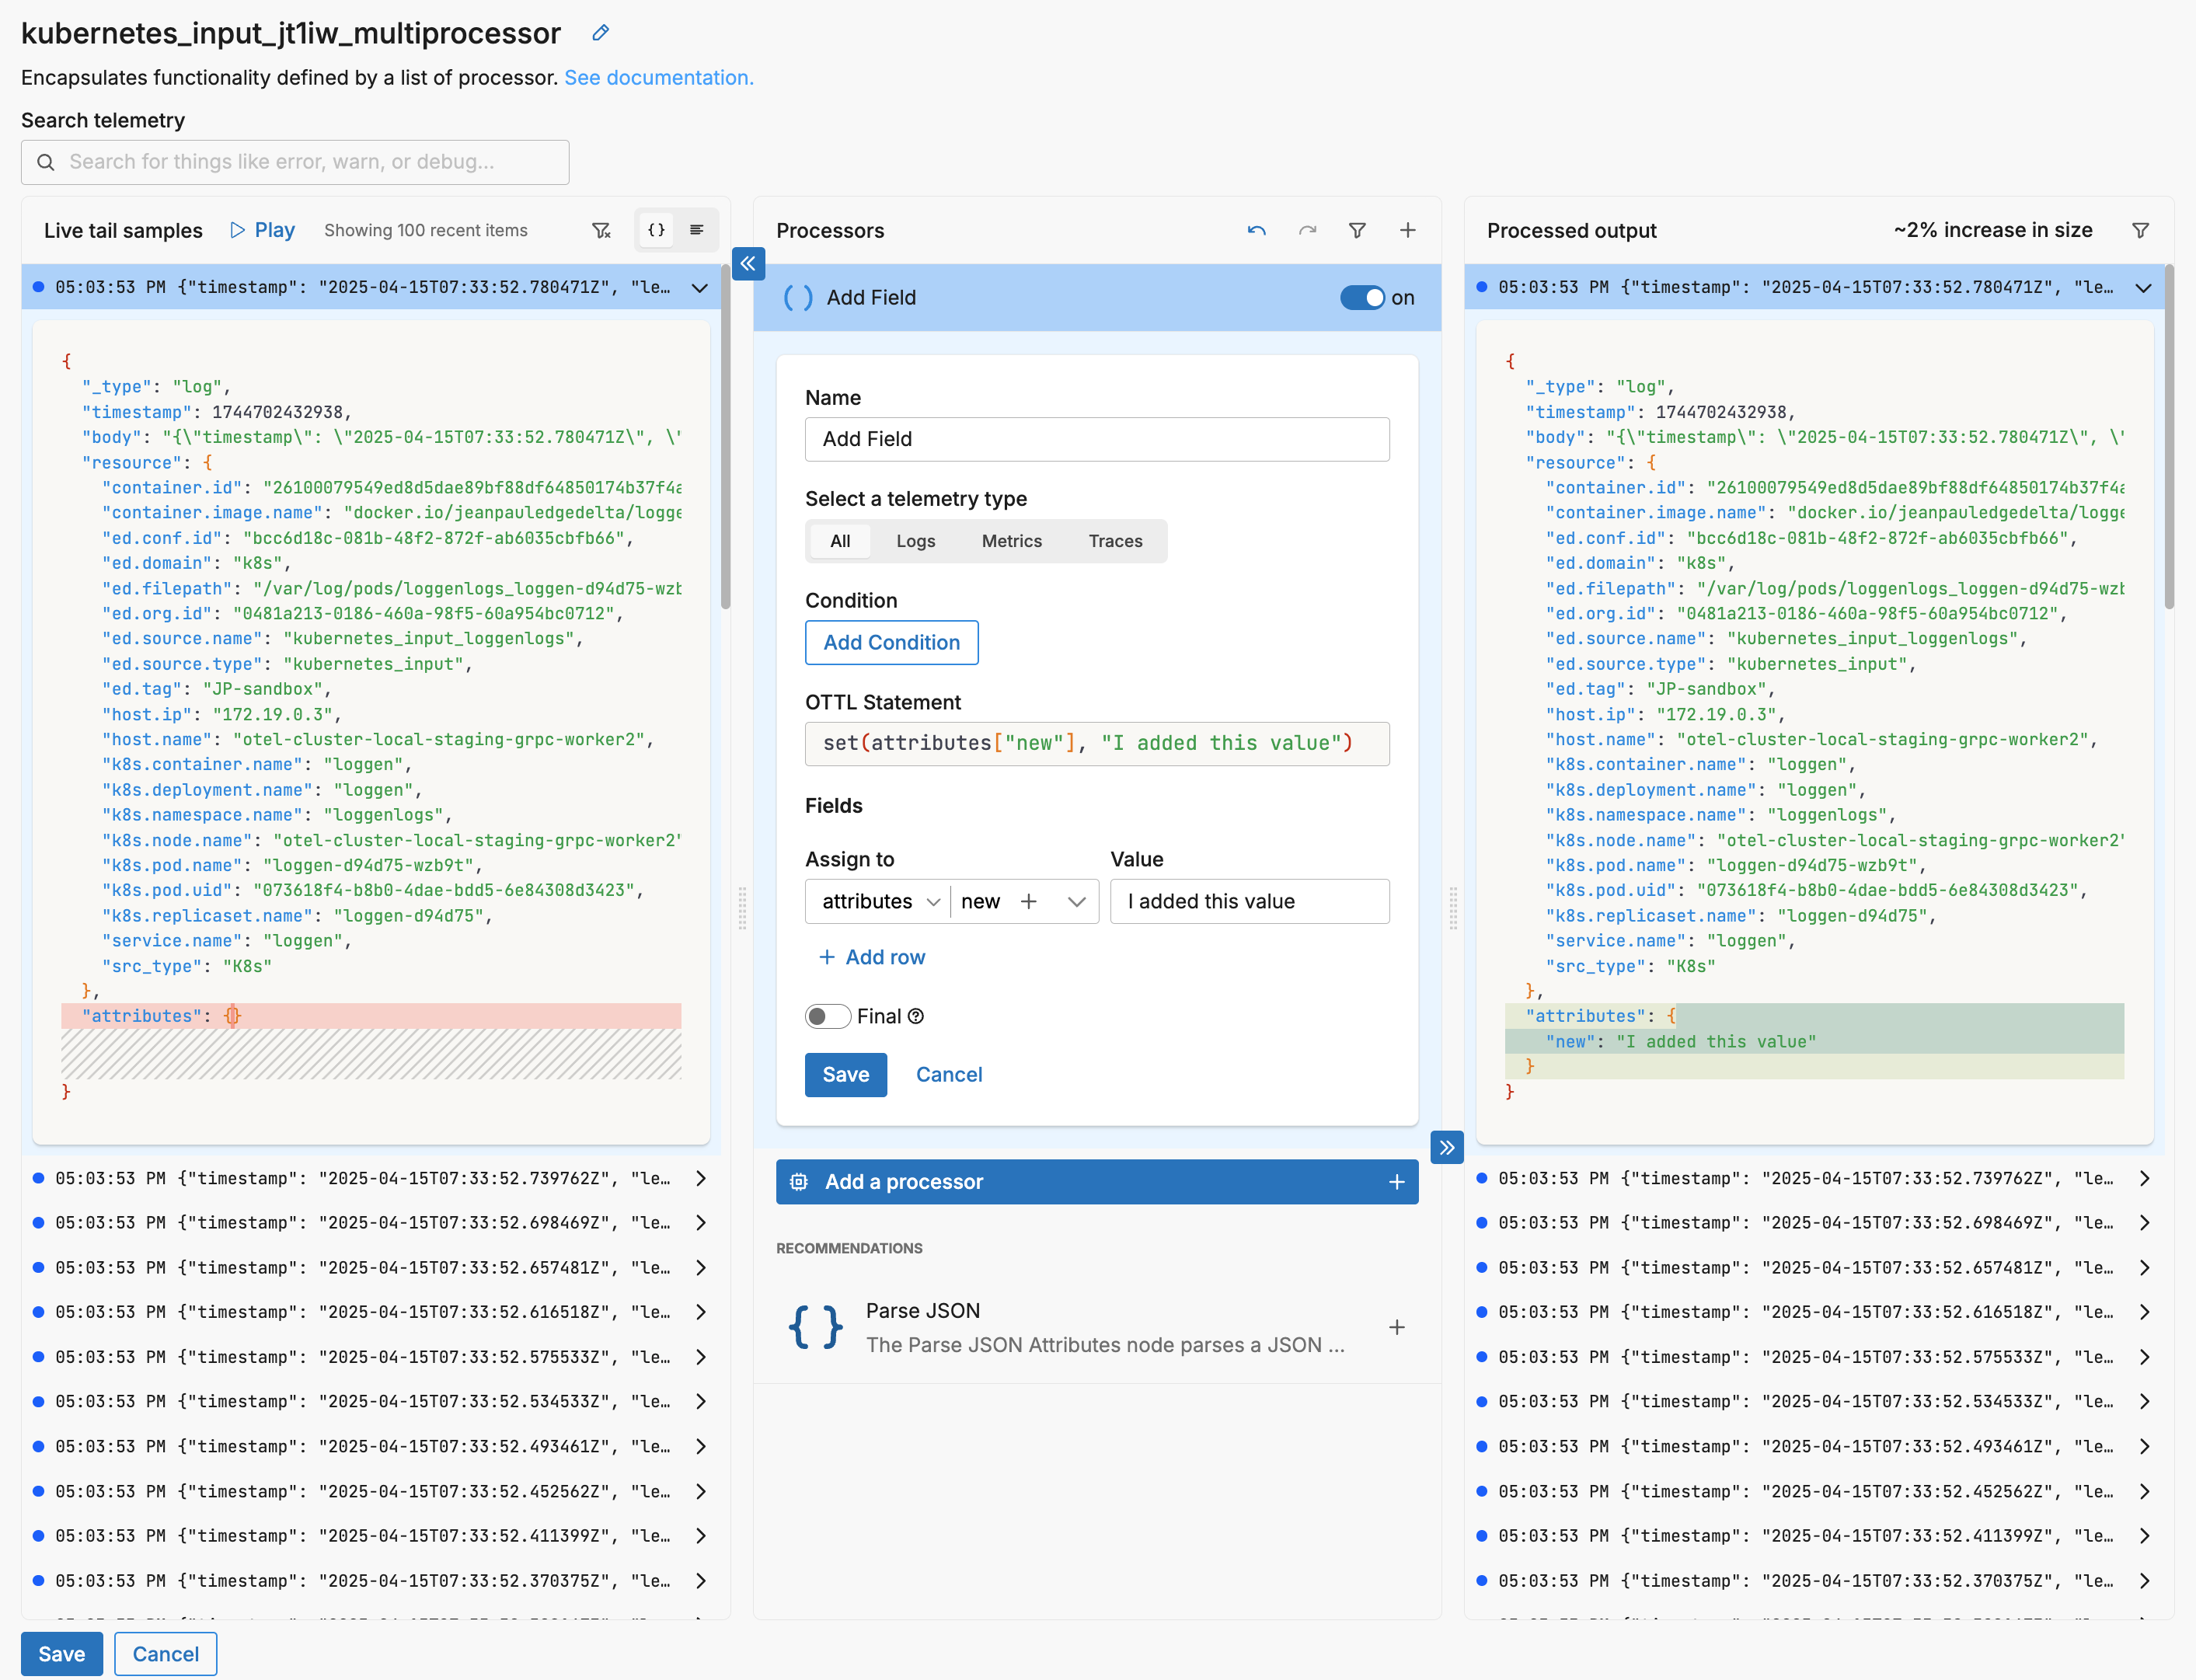
The left pane shows the last 100 data items that were detected passing through the node. You configure your processor in the centre pane, and preview the output in the pane on the right.
You can select a specific data item in the left pane to view its details. The diff for the data item is shown in the right pane. When you select a data item the live capture is paused and the last 100 data items are listed. You click Play to resume capturing the latest data items.
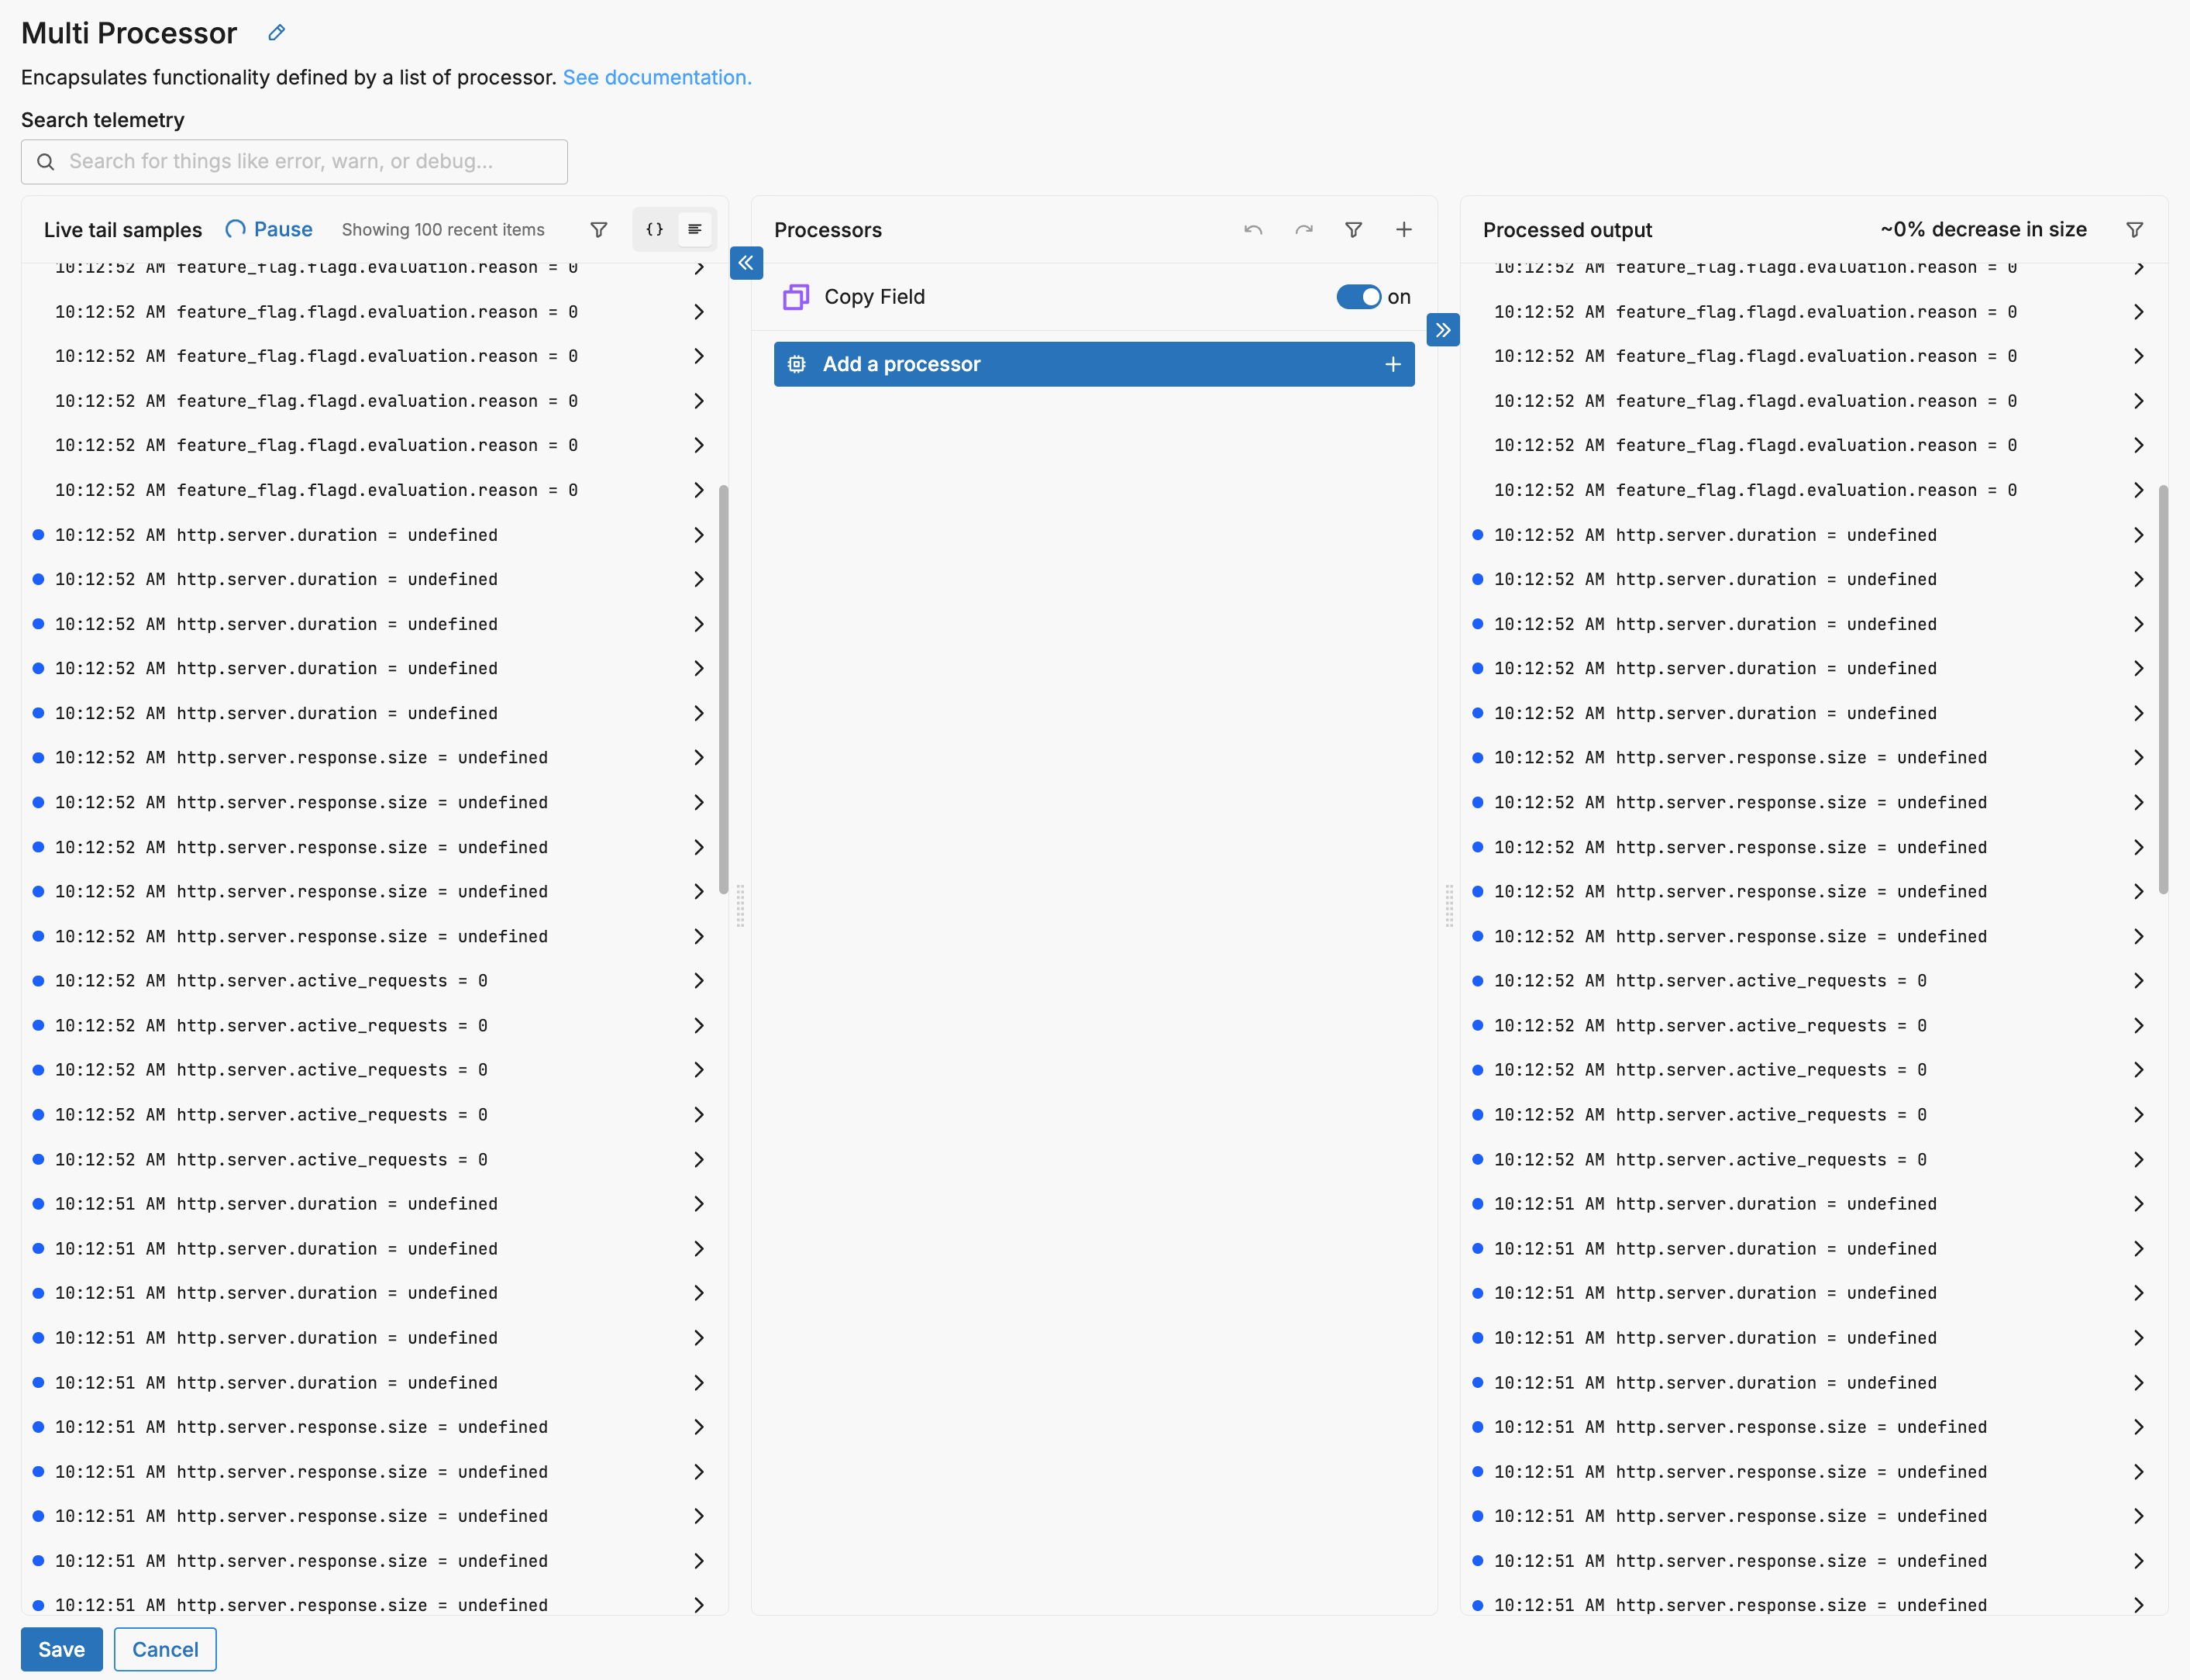
AI-Powered Recommendations
While working in Live Capture, Edge Delta’s Recommendations feature can suggest optimal processors based on your actual data patterns. The multiprocessor view displays recommended processors in the center pane, helping you quickly identify opportunities to filter, sample, or transform your data for better pipeline efficiency. These contextual recommendations are generated by analyzing your live data stream and identifying patterns that could benefit from optimization.
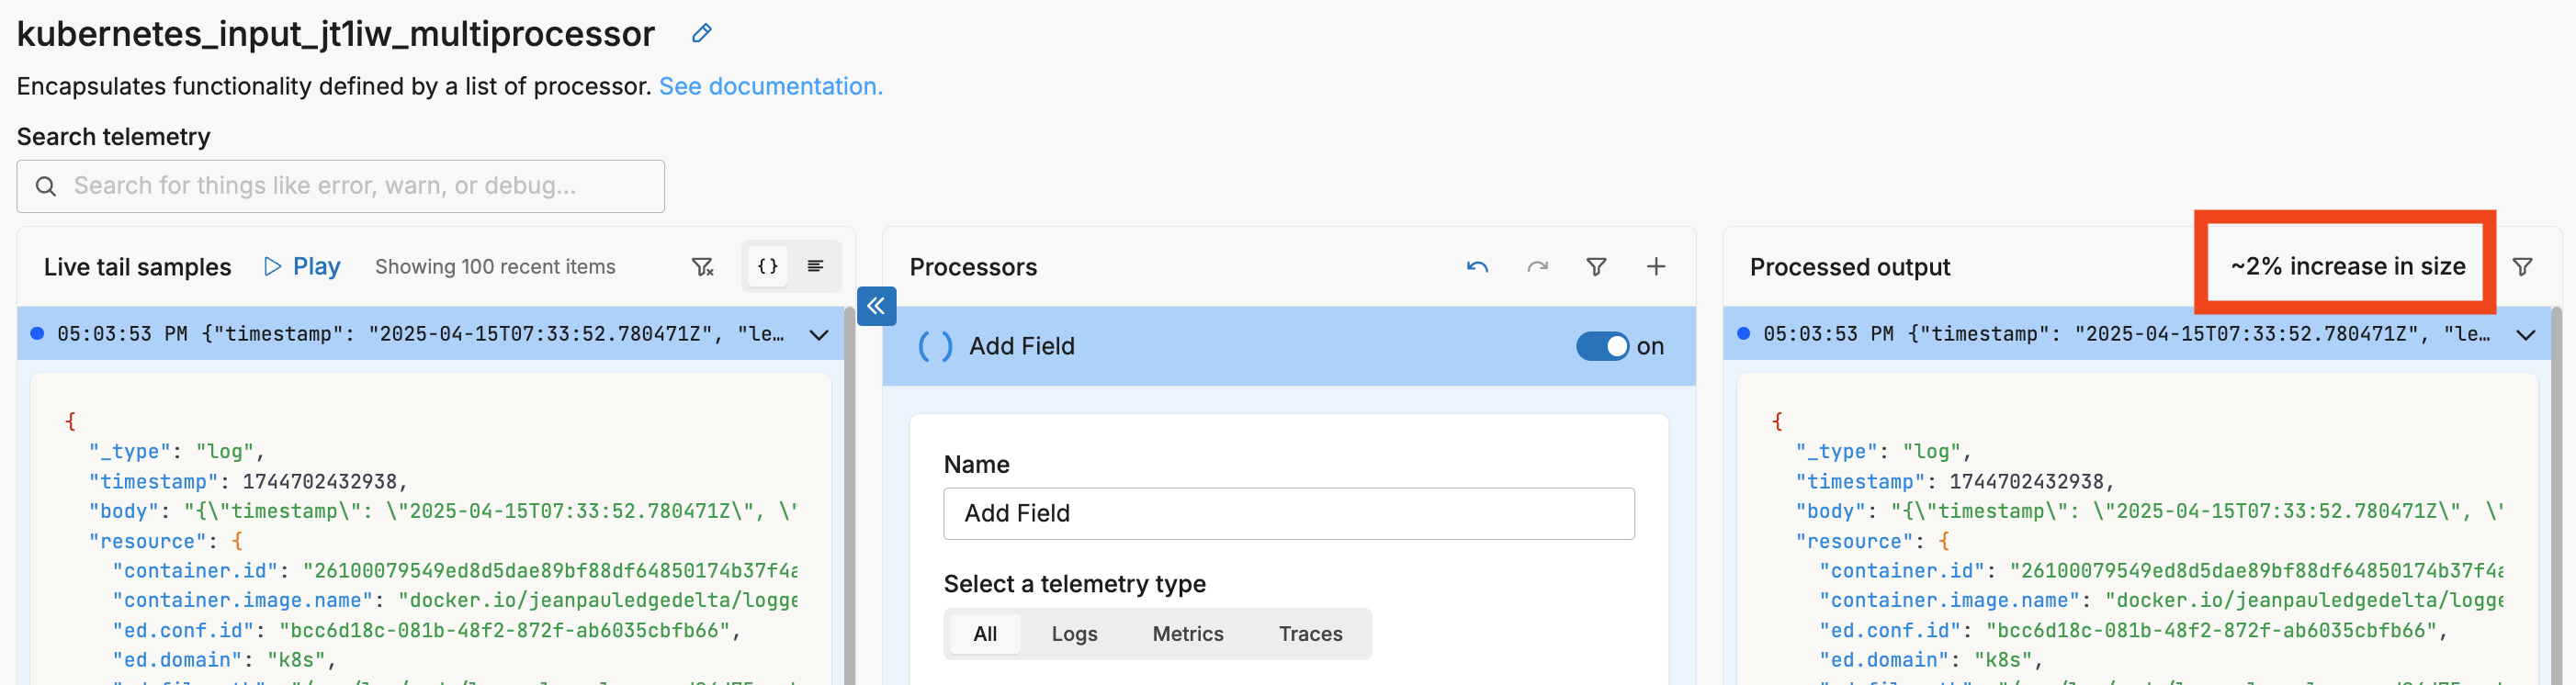
Optimization Rate
A key metric to take note of is the percentage increase of decrease in data size as a result of logic in the centre pane. This is calculated against the 100 items in the left pane.
Affected Indicator
Data items that are modified by a processor are marked with a blue marker in the input and output live capture panes. This is likely to happen when a condition is set in the processor:
Pretty View
You can switch between a code view and a “pretty” view of the data items:
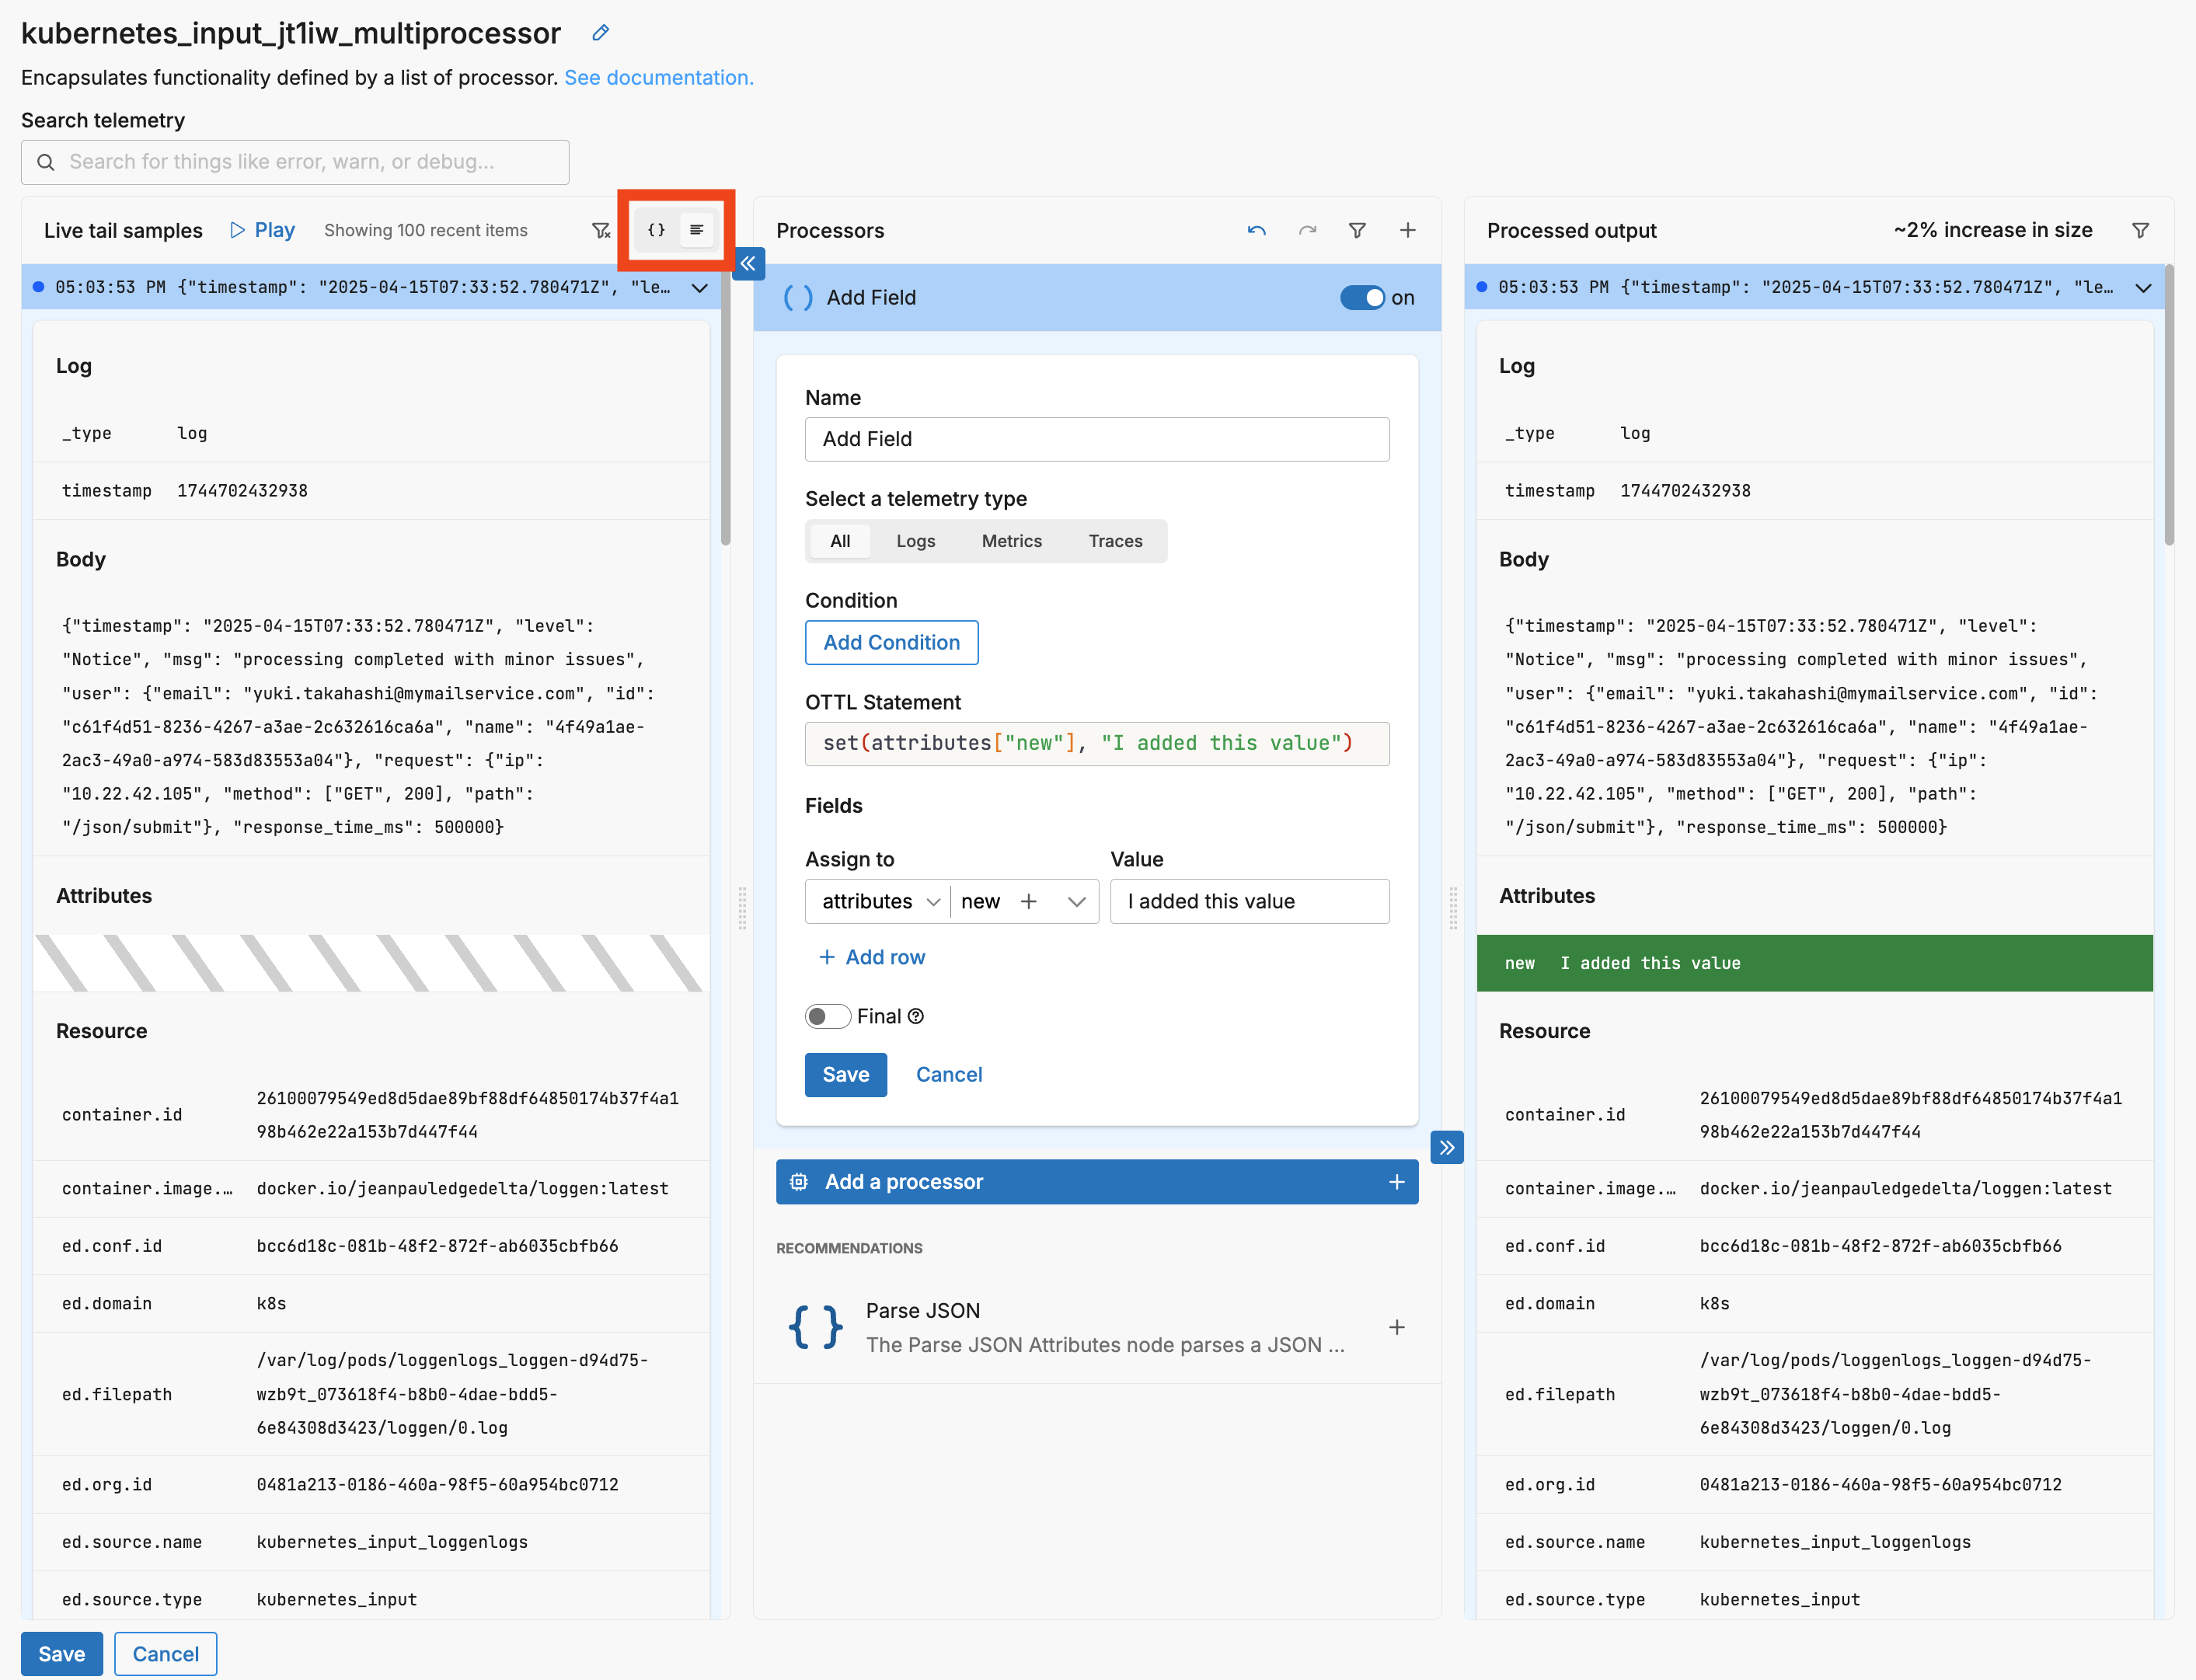
With pretty view enabled you can select a field to view shortcuts for creating processors using that field:
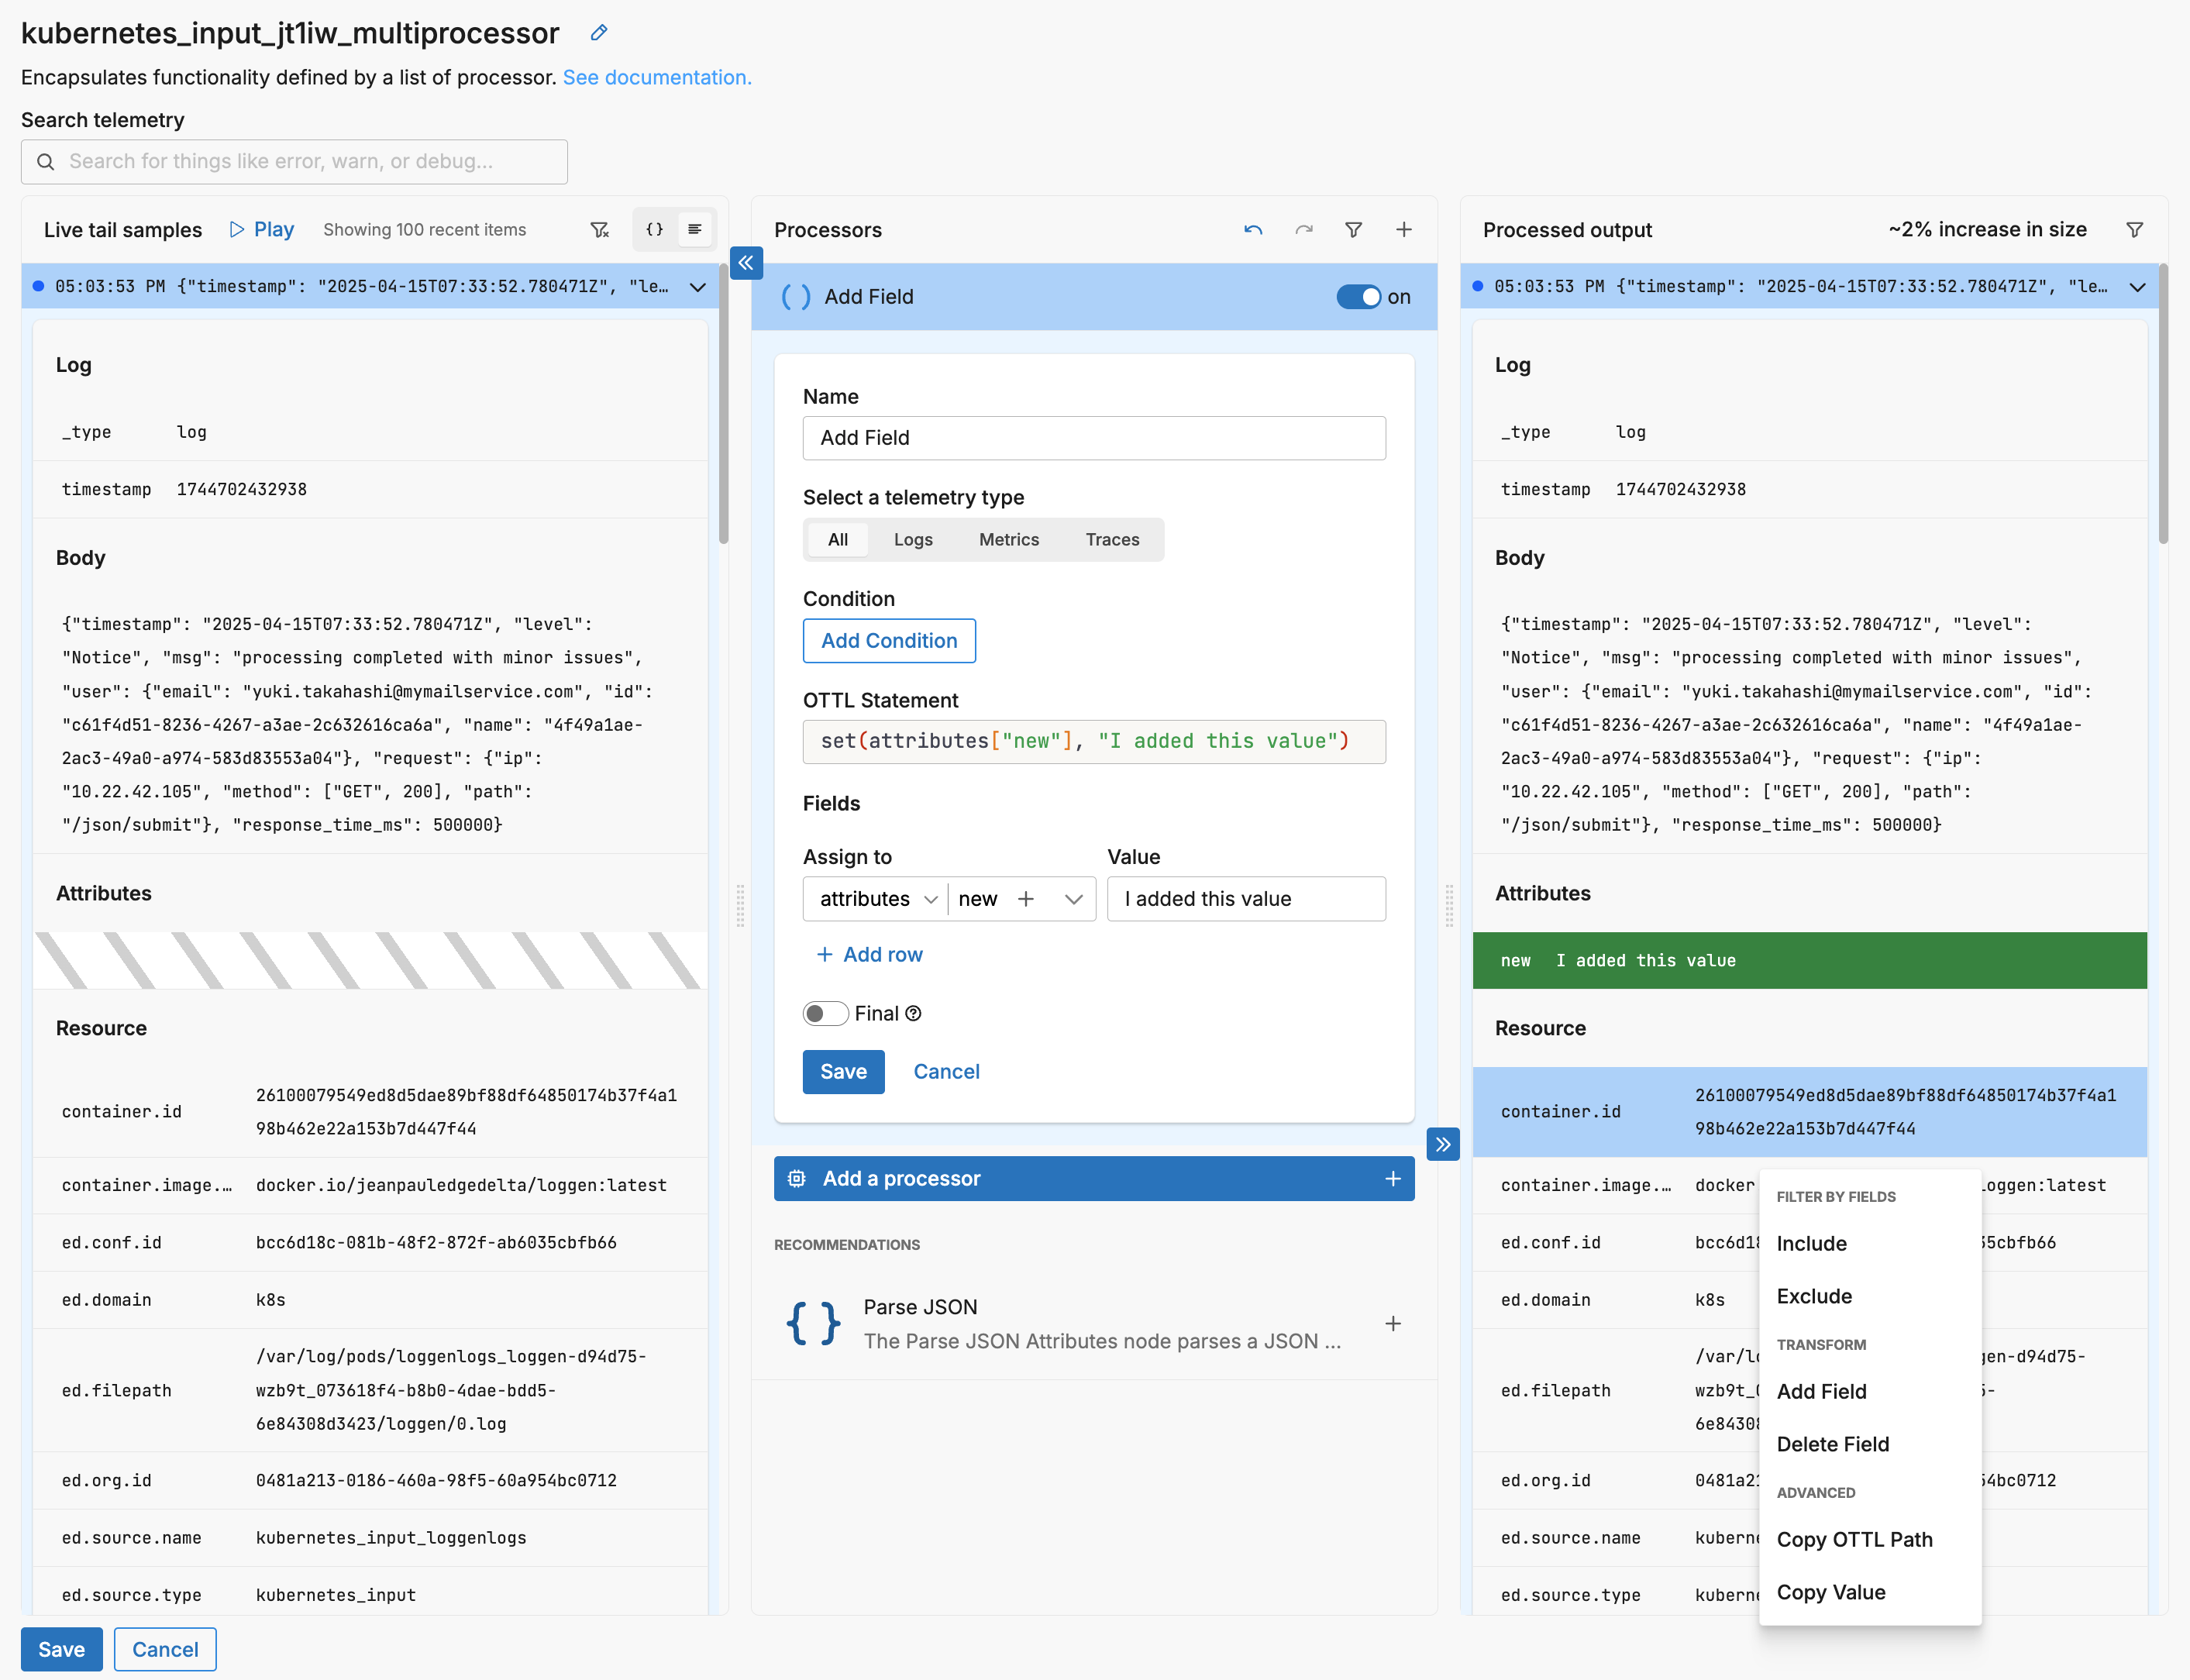
Filters
You can filter each live capture pane to view one specific data type. For example you might want to see logs in the left and resulting metrics in the right.
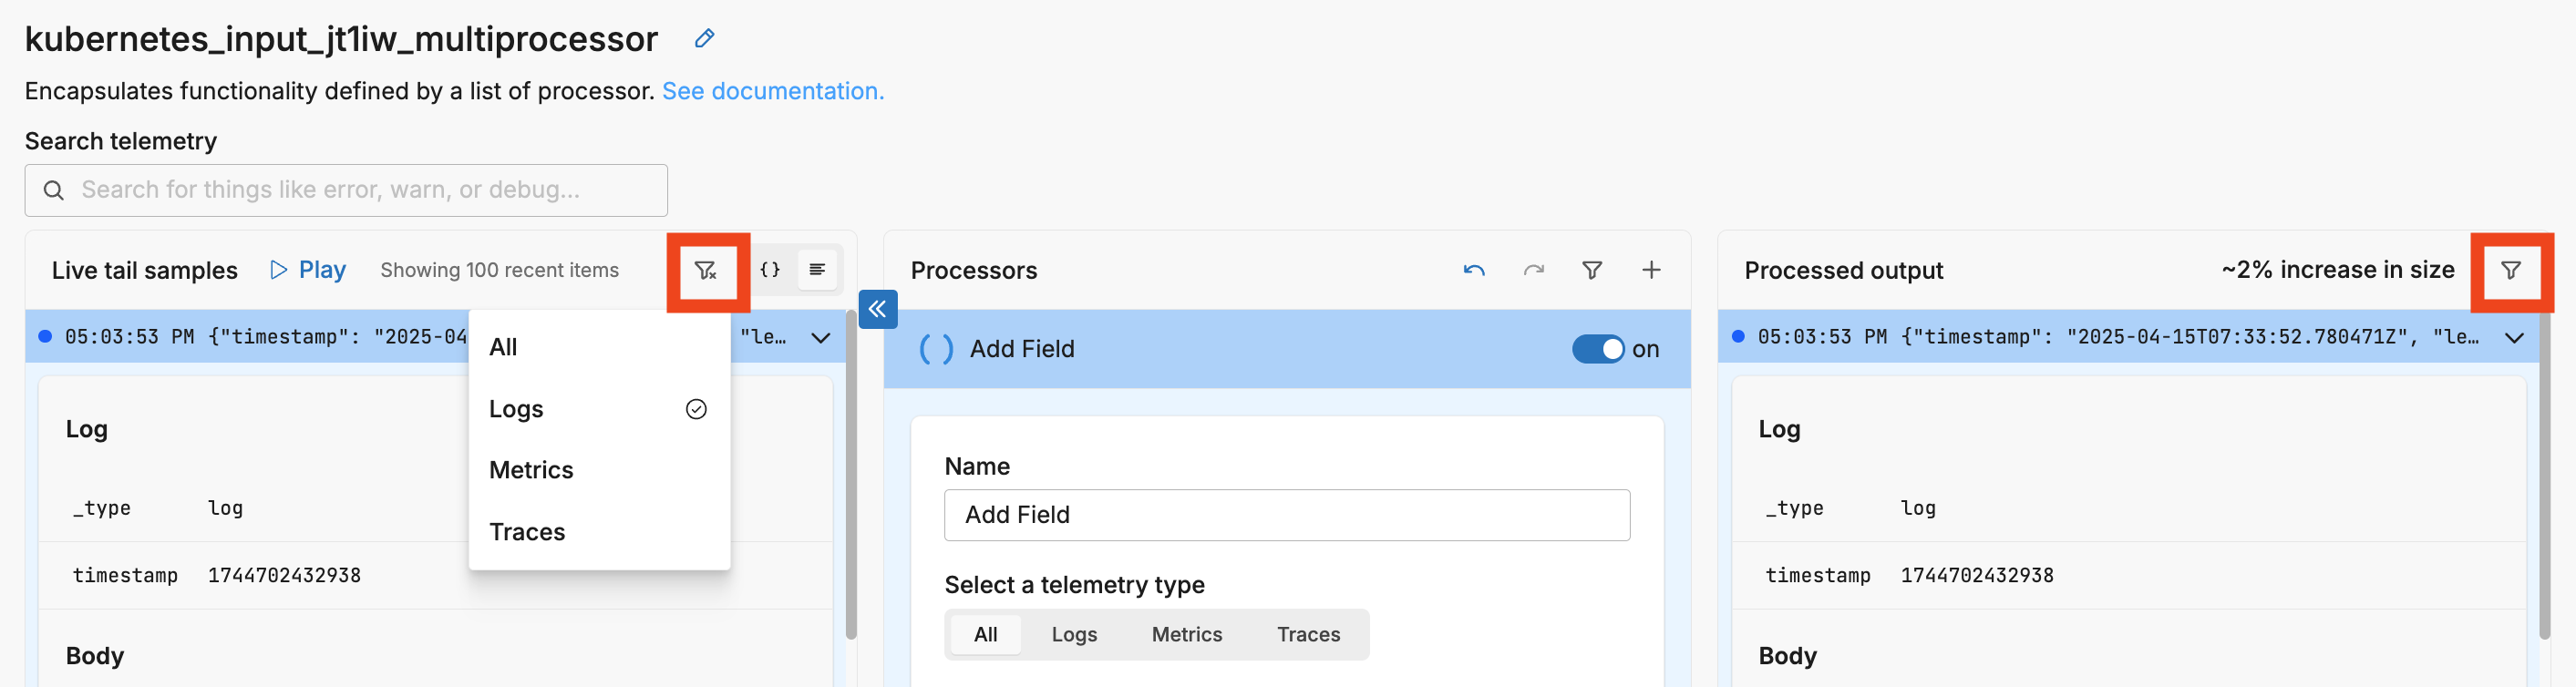
Note: this changes the view only, it does not apply a filter to the processor.
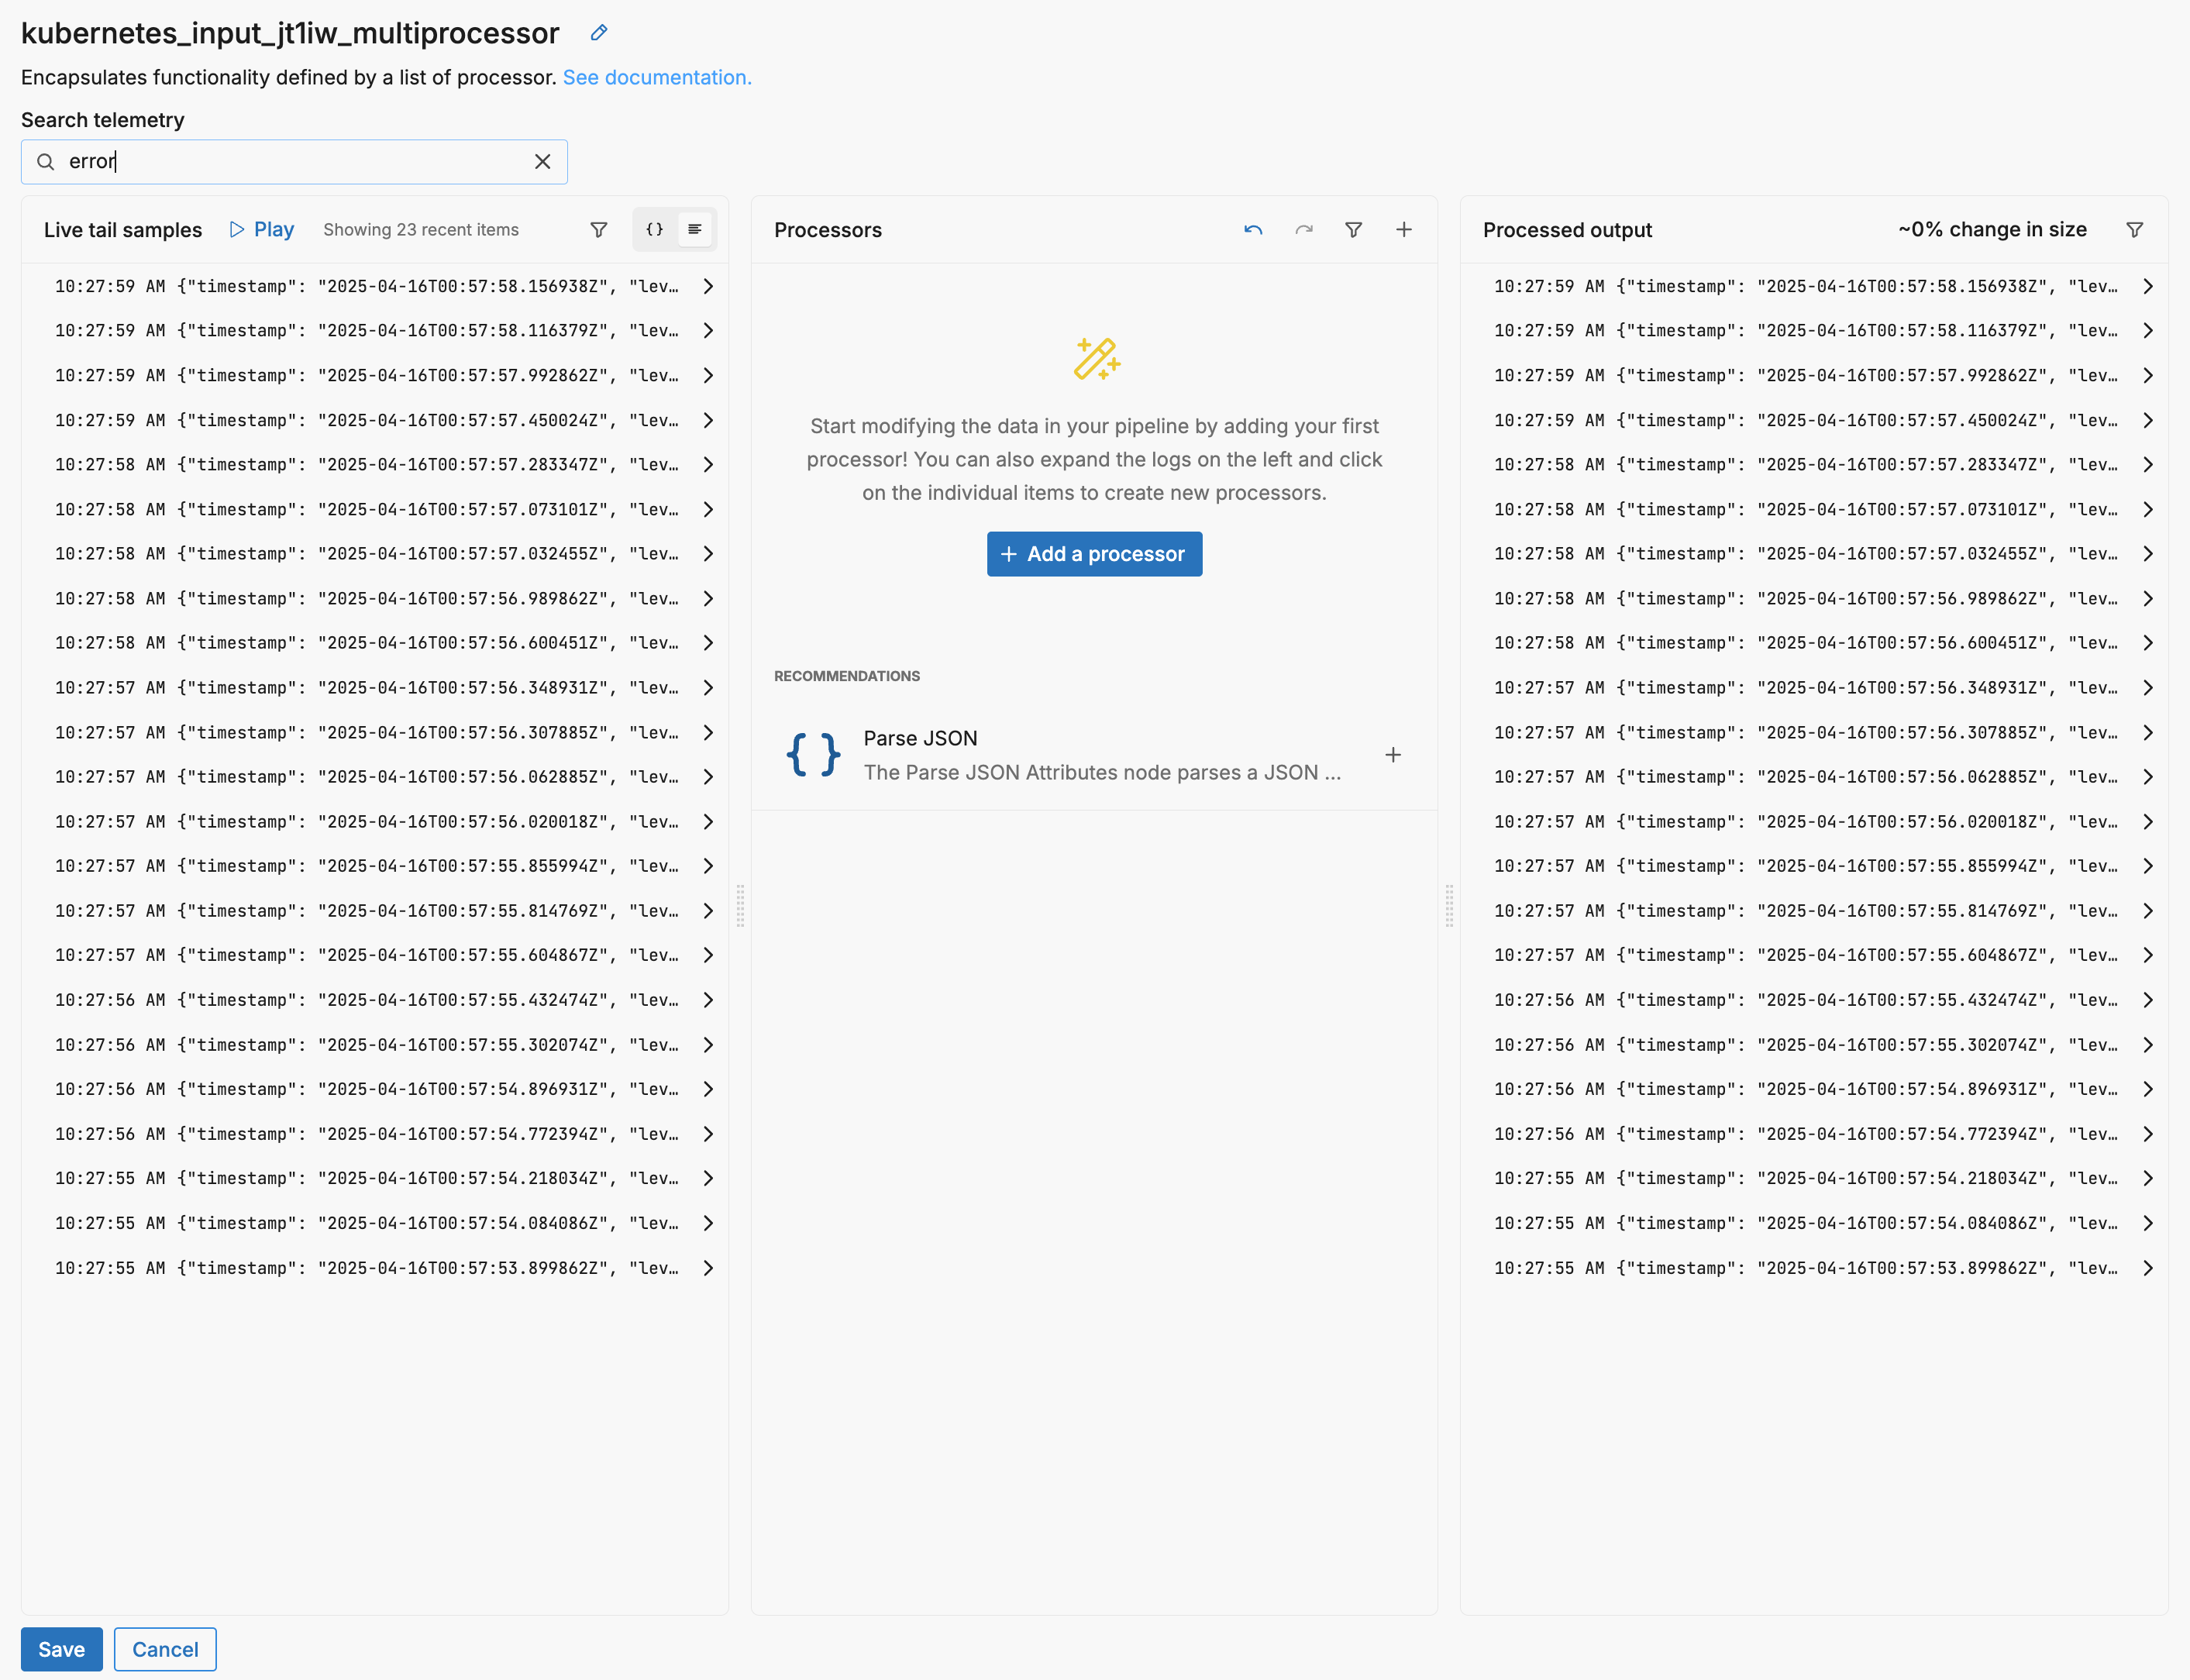
You can also search the input logs for a keyword. This further filters the input and output panes. For example, of the 100 samples, 23 contain the word error:
See Also
- Troubleshooting and Diagnostics - Debug pipelines and diagnose issues
- Monitoring and Visibility - Track pipeline health and performance
- Debug Output Destination - Configure debug output nodes for in-stream debugging