Best Practices for Edge Delta Processors
6 minute read
Overview
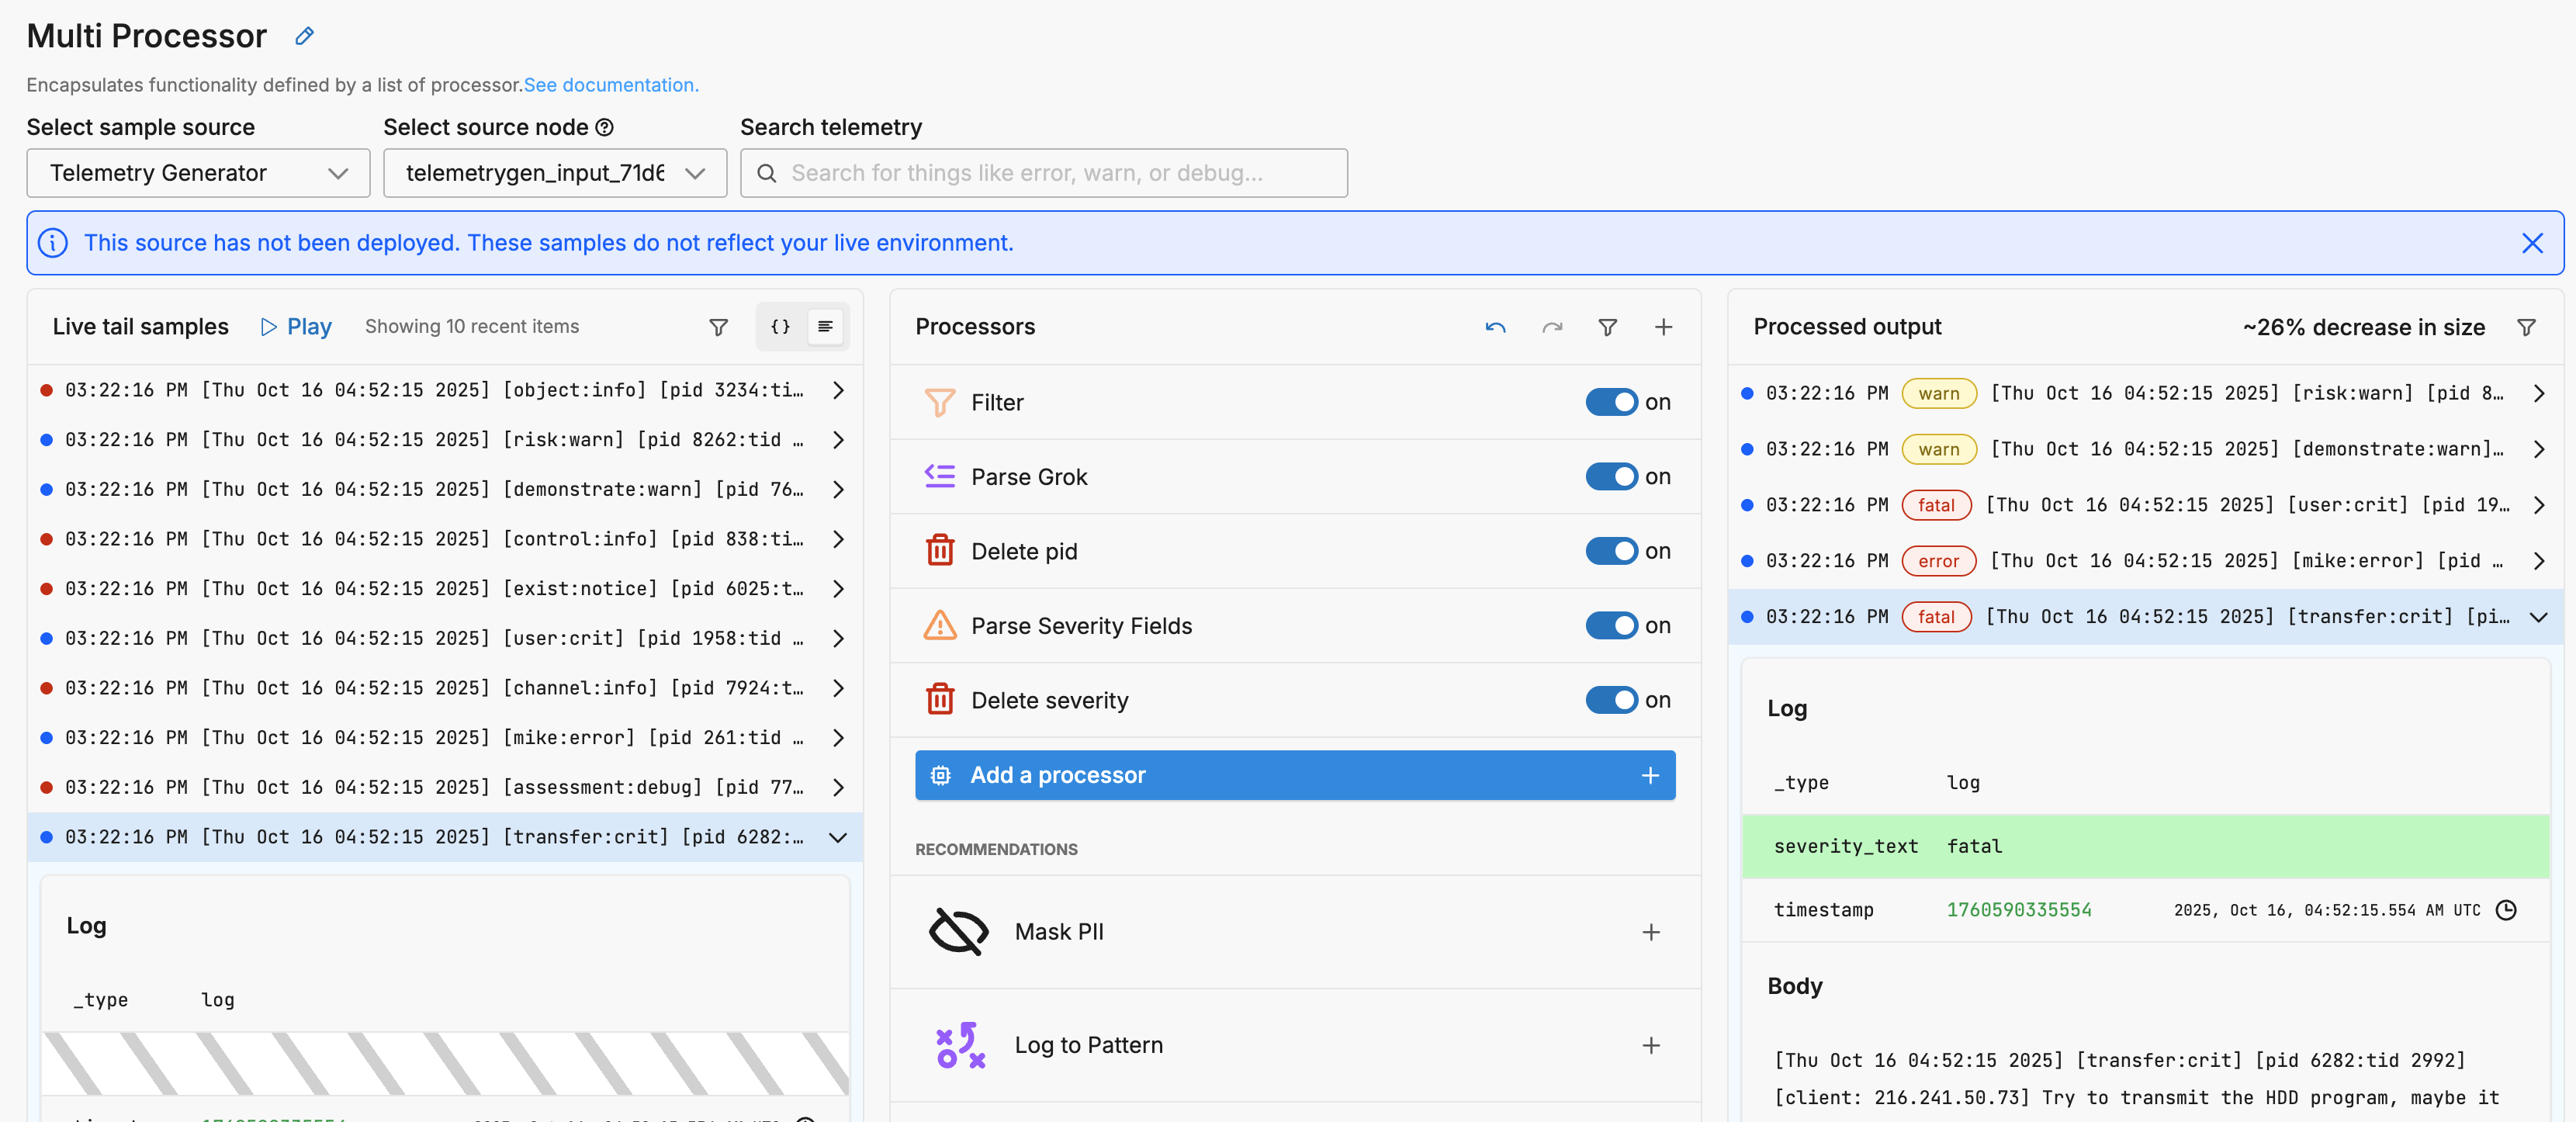
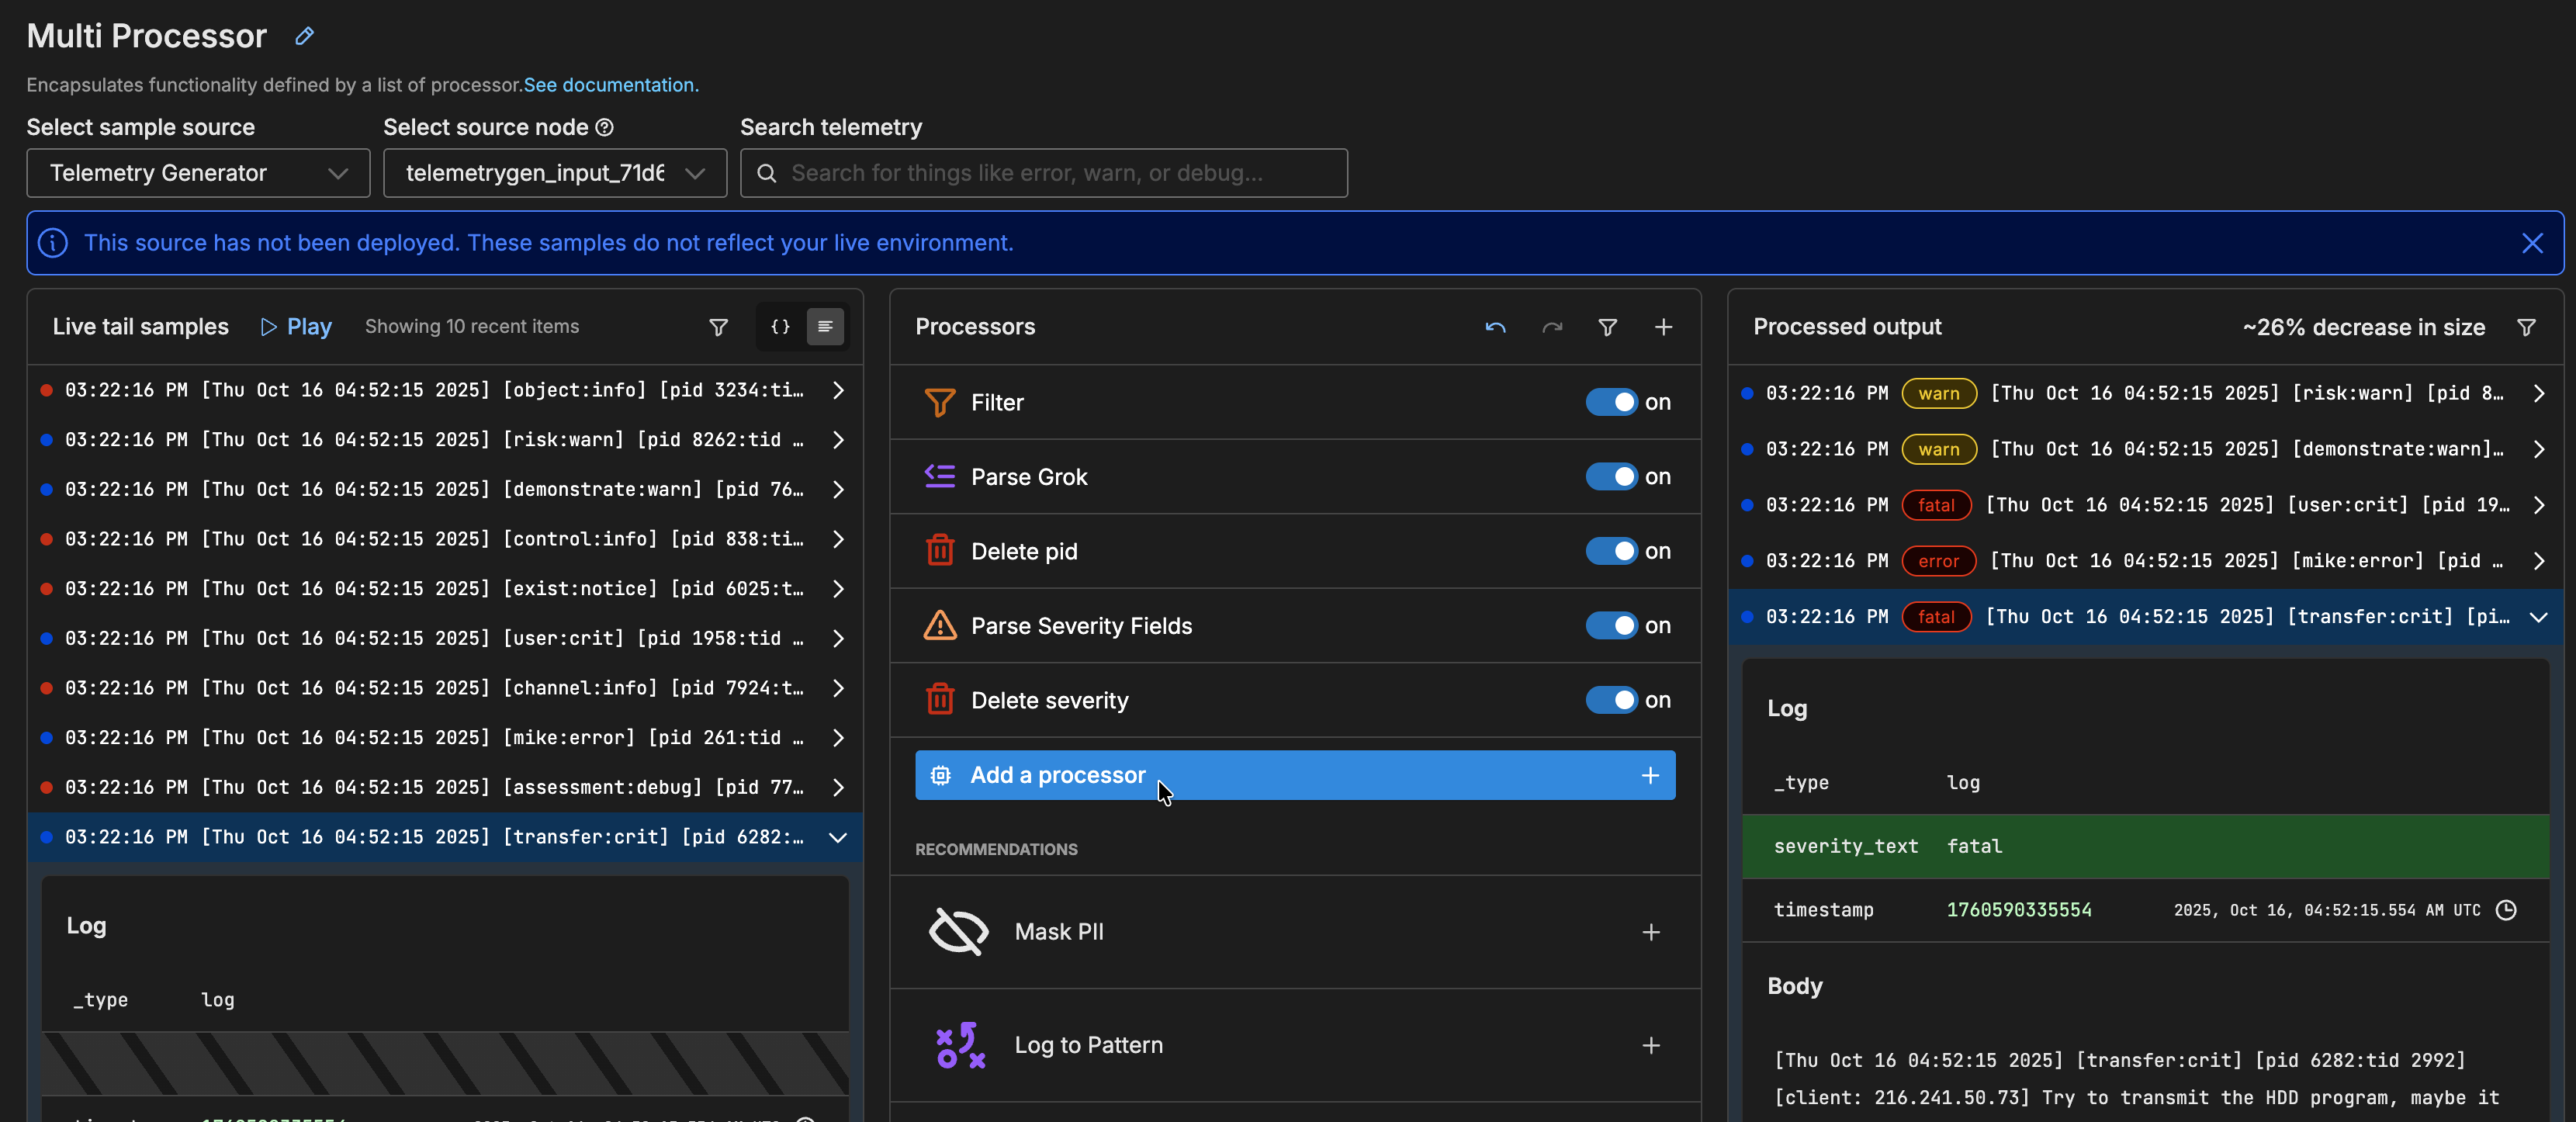
The Edge Delta Processor nodes (formerly known as multi-processor nodes) enable you to organize and manage multiple processors (such as extract and aggregate metric processors) under a unified logic block. This is helpful for building structured processing flows using conditional logic and reusable groups. However, improper configuration can lead to high memory usage, excessive metric generation, and agent instability. This guide outlines configuration best practices to help you avoid these issues.
When to Use a Processor Node
Use a processor node to:
- Encapsulate related processors under a shared telemetry type and condition.
- Create modular logic flows that are easier to manage.
- Branch logic using conditional groups.
Avoid using a single processor to handle many unrelated logic flows, especially if they share relaxed conditions or overlapping scopes.
Common Pitfalls
1. Broad or Overlapping Conditions
When multiple conditional groups or extract/aggregate rules match the same data, each one may execute independently—leading to multiple versions of the same metric.
Issue: Metric duplication, excessive memory use, and difficulty tracking root cause.
Solution:
- Use mutually exclusive conditions for each rule or group.
- Use
name ==checks to tightly couple aggregate metrics to corresponding extract metrics. - Avoid duplicating logic across groups unless absolutely necessary.
2. Overloading One Processor Node
Stacking too many extract and aggregate metric rules into one processor (especially without exclusive conditions) can overwhelm the agent.
Issue: CPU/memory spikes, OOMKills, and pipeline restarts.
Solution:
- Split logic into multiple processors when:
- You have more than 2–3 extract-aggregate metric chains.
- Different chains process different telemetry types.
- Different chains operate under separate logic scopes.
3. Missing or Loose name == Conditions in Aggregate Processors
Aggregate metrics without a scoping condition may pick up more metric items than expected.
Issue: Metrics aggregate unrelated data, balloon in cardinality, and consume memory.
Solution:
- Always use a
name == "..."condition in your aggregate rule to ensure it only matches the corresponding extract metric.
4. Ineffective Sampling Configuration
When using the Sample Processor, consistent sampling may appear static if your configuration does not vary enough across data items.
Issue: Unexpectedly uniform sampling behavior or ineffective volume reduction.
Solution:
- Ensure that your timestamp granularity is not too coarse (e.g., use
1sor100msrather than1m). - Use appropriate field paths to increase sampling key entropy (e.g., include
user_idorcluster). - When using Sample Rate Override, confirm that:
- The field is present in all items.
- Values vary across items.
- Values are valid (numeric or numeric strings between 0–100).
5. Sampling Override Defaults to 100%
Issue: If all data items contain the override field with a constant value of 100, all items will pass through—negating the purpose of sampling.
Solution:
- Ensure override values are meaningful and variable.
- If you’re applying sampling to reduce volume, avoid setting default override values to
100in preprocessing logic.
6. Processor Sequencing Missteps
Improper sequencing can lead to dropped data, skipped processors, or inflated output volumes.
Issue:
- Original logs lost when
Keep Originalis not enabled after metric/pattern extraction - Downstream processors skipped due to premature
Final - Filters discarding telemetry that was intended for enrichment or extraction
Solution:
- Use
Keep Originalwhen deriving new data types (metrics, patterns) to retain original telemetry - Be deliberate with
Final—only use when you’re certain downstream logic should be skipped - Filter after transformation if downstream processors rely on enriched fields
Recommendations
Use Separate Processors per Metric Flow
- type: sequence
  processors:
  - type: extract_metric
    extract_metric_rules:
    - name: latency
      gauge:
        value: attributes["response_time_ms"]
  - type: aggregate_metric
    condition: name == "latency"
    aggregate_metric_rules:
    - name: latency_avg
      interval: 1m
      aggregation_type: avg
Use Conditional Groups for Clean Branching
- type: sequence
  processors:
  - type: sequence
    condition: attributes["level"] == "Error"
    processors:
    - type: extract_metric
      ...
    - type: aggregate_metric
      ...
Disable Unused Logic Safely
- Toggle the parent conditional group, not just individual processors.
- Confirm that child processors are truly inactive by inspecting pipeline behavior.
Understand Processor Flow
Processors in a multiprocessor node execute top-down, with each processor acting on the outputs of the one above it. This allows you to build powerful, streamlined pipelines—but the order and configuration of processors significantly impact performance, data integrity, and routing behavior.
Key behaviors:
- Sequential Execution: Each processor receives the data items emitted by the one above it. This includes modified, passed-through, or failed items.
- Conditional Logic: Processors may apply only to certain telemetry types or conditions, and non-matching items are passed unchanged.
FinalOption: Processed items exit the node early, skipping any remaining processors. Unprocessed items continue through the stack.Keep Original Telemetry Item: When enabled, both the transformed and original data items are emitted. Without this, the original item is dropped—often unintentionally.
Sequencing Considerations
There is no strict rule for the order of processors. Instead, focus on managing flow behavior and output expectations:
- Be intentional with
Keep Originalwhen creating derived data like metrics or cluster patterns. If not enabled, the original telemetry (e.g., logs) will be dropped—even if it was only partially processed. - Use
Finalcarefully: It can prevent further processing (like filtering, enrichment, or routing) of successfully transformed items. - Filtering early can help reduce volume and processor overhead, but may also drop telemetry you need to transform. Ensure filters don’t remove valuable data upstream of enrichment or extraction.
- Use scoped conditions to control flow more predictably without relying on processor order alone.
Understanding processor sequencing is critical for maintaining telemetry visibility, reducing duplicate or lost data, and optimizing performance.
For a deeper explanation of flow control and examples, see Processors.
For hands-on configuration details, see Configure a Processor.
Debugging and Optimization
Detecting Excess Metric Volume
- Use the Metrics Explorer to visualize:
- Metric count over time
- Cardinality grouped by
nameorattributes
Profiling High Memory Agents
- Enable profiling via the UI for affected agents.
- Look for spikes tied to:
- Metric extraction and aggregation
- ebpf-based sources (Service Map, K8s Trace)
Triage Checklist
- Is metric volume increasing after a recent pipeline change?
- Are conditions overlapping across extract/aggregate rules?
- Are processors grouped under a single high-traffic node?
- Are logs or pprof showing GC pressure or agent crashes (OOMKills)?
- Are sample rates too high or fixed at
100across items? - Is timestamp granularity too coarse for consistent sampling?
Summary
| Problem | Impact | Best Practice |
|---|---|---|
| Overlapping conditions | Duplicate or bloated metrics | Use name == and mutually exclusive filters |
| Too many processors in one MP | Memory/CPU pressure, crashes | Split flows into separate processors |
| No scoping in aggregates | Aggregates capture wrong data | Use specific name == conditions |
| Disabled logic still executing | Unexpected metric generation | Toggle conditional group, not just children |
| Static sampling behavior | Sampling doesn’t reduce volume | Use varied field paths and lower timestamp granularity |
| Sample Rate Override = 100 | All data passed through | Ensure override values are dynamic and meaningful |
| Processor sequencing mistakes | Data loss or skipped processors | Use Keep Original and Final with intention |