Pipeline View
7 minute read
Overview
See Quickstart: Basic Pipeline Configuration.
This section describes the Pipelines Interface.
- In the Edge Delta App, click Pipelines.
- Select the pipeline you want to view.
- The pipeline opens in the pipeline builder tab.
The configuration structure is a graph consisting of three types of nodes, the links between them, and the data handled by the pipeline:
- Source, Processor, and Destination Nodes.
- Links
- Data Items
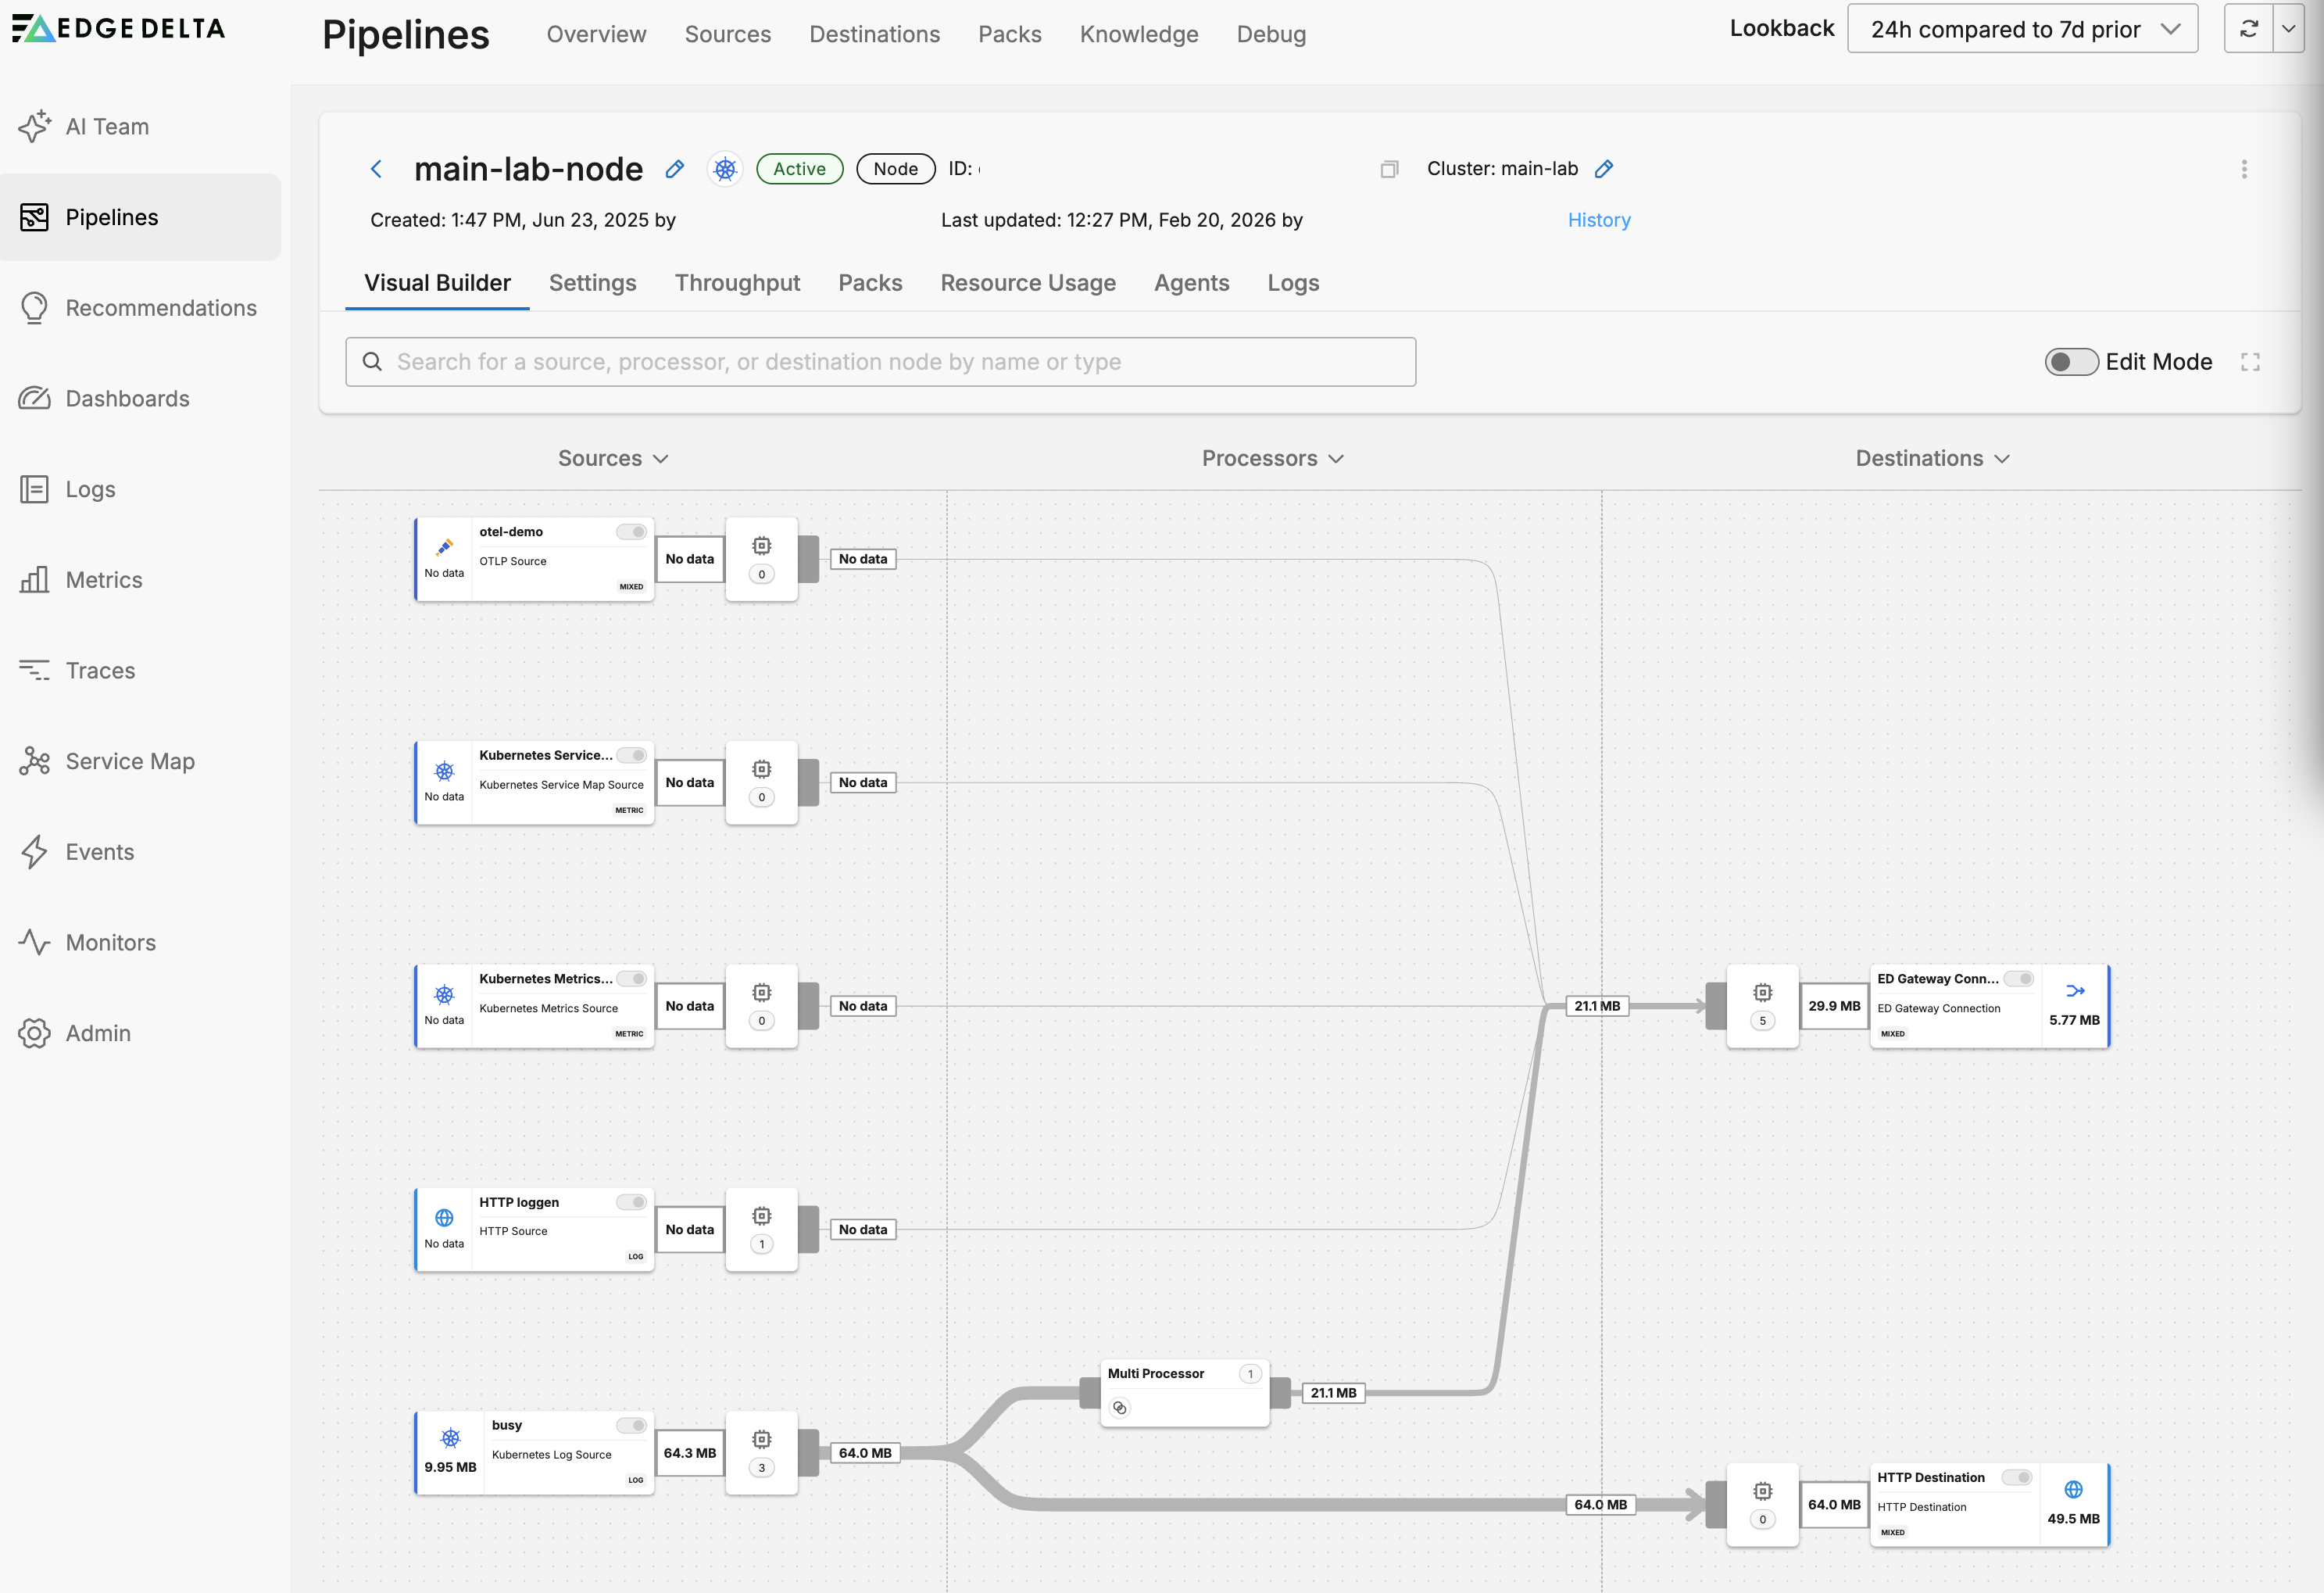
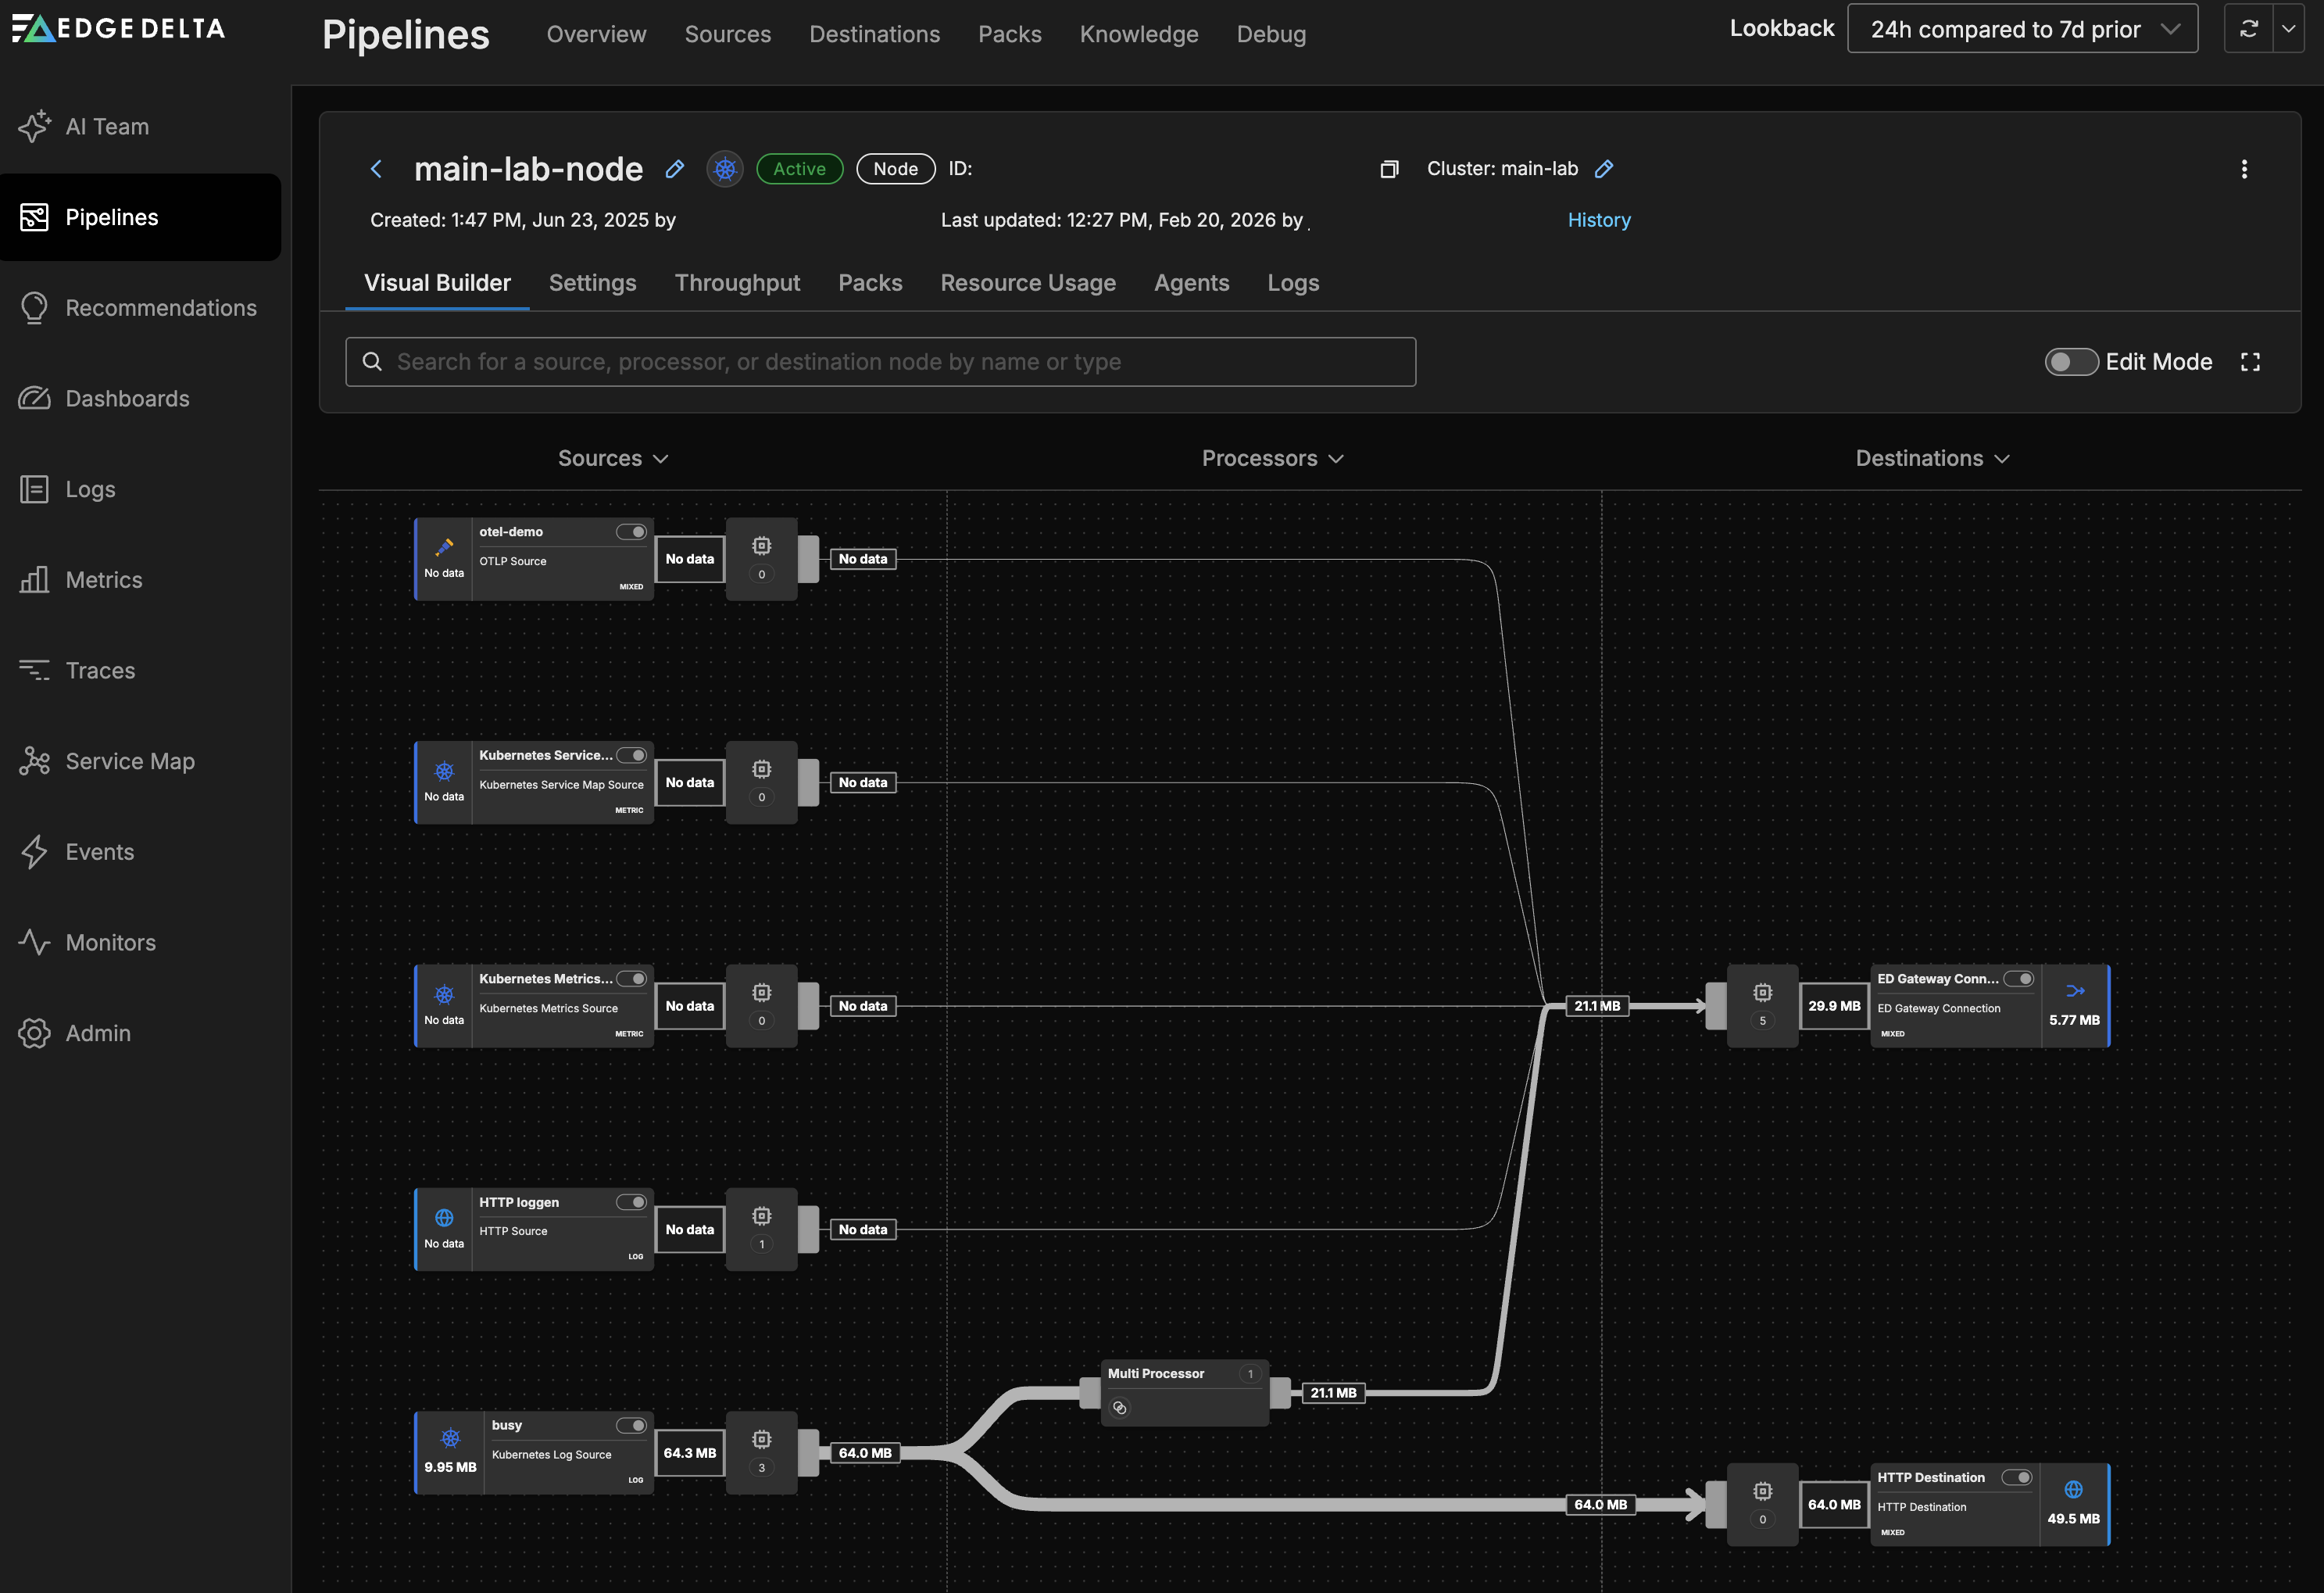
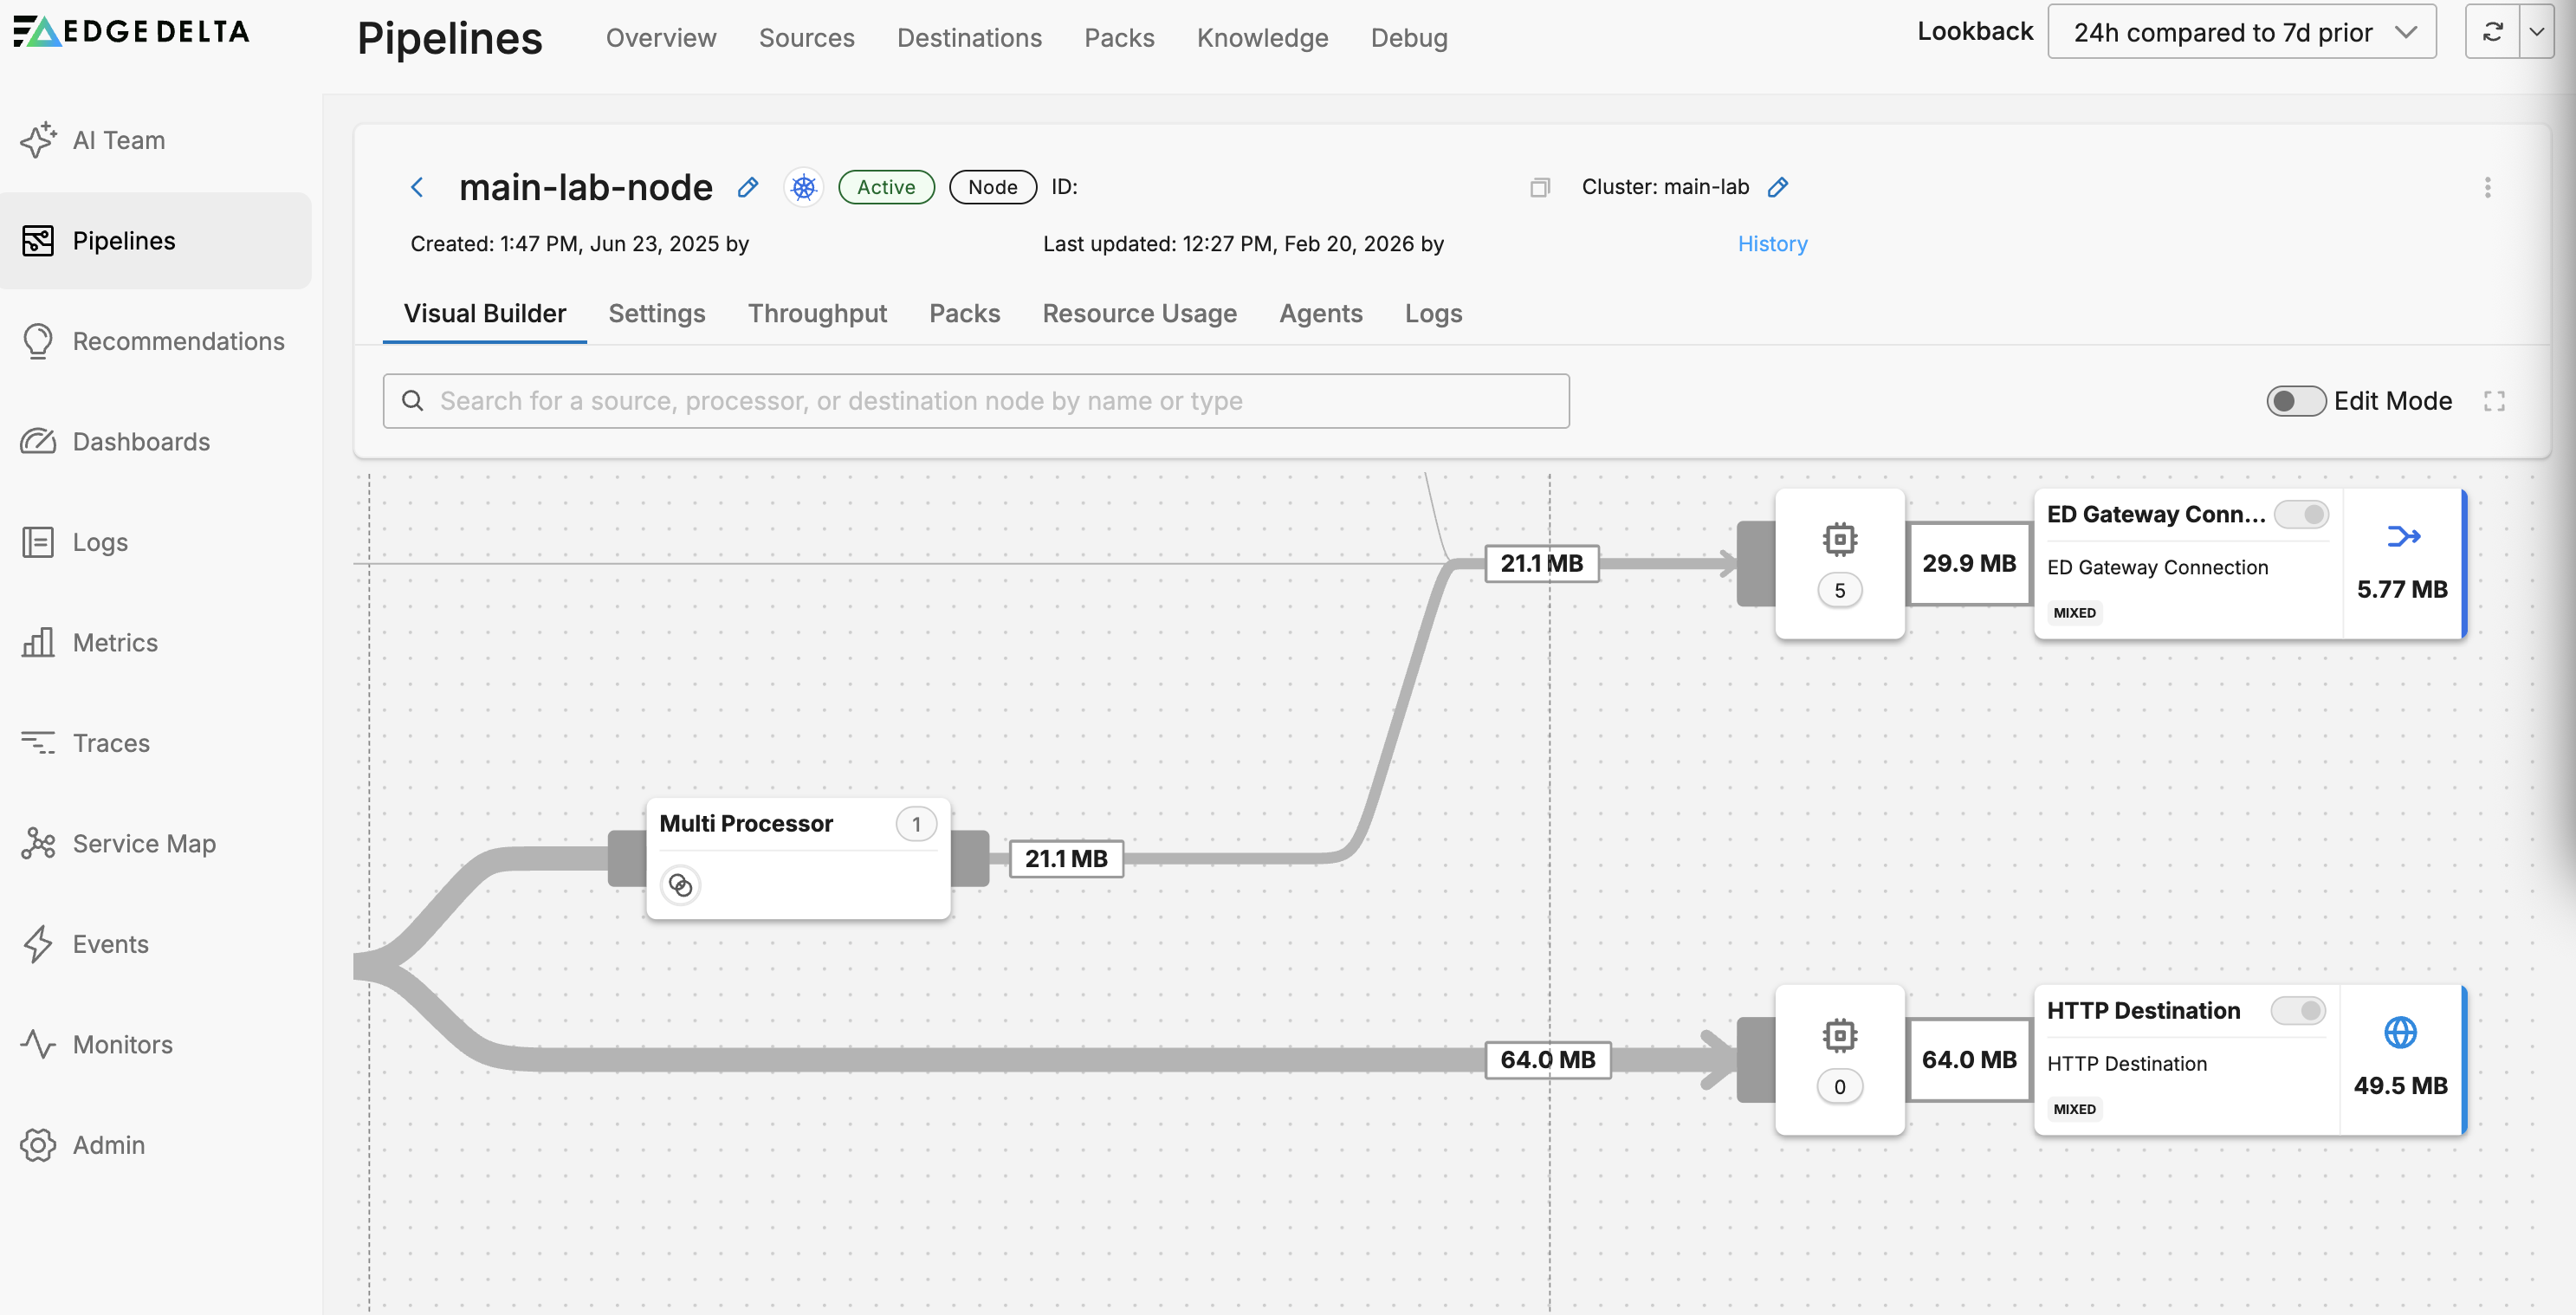
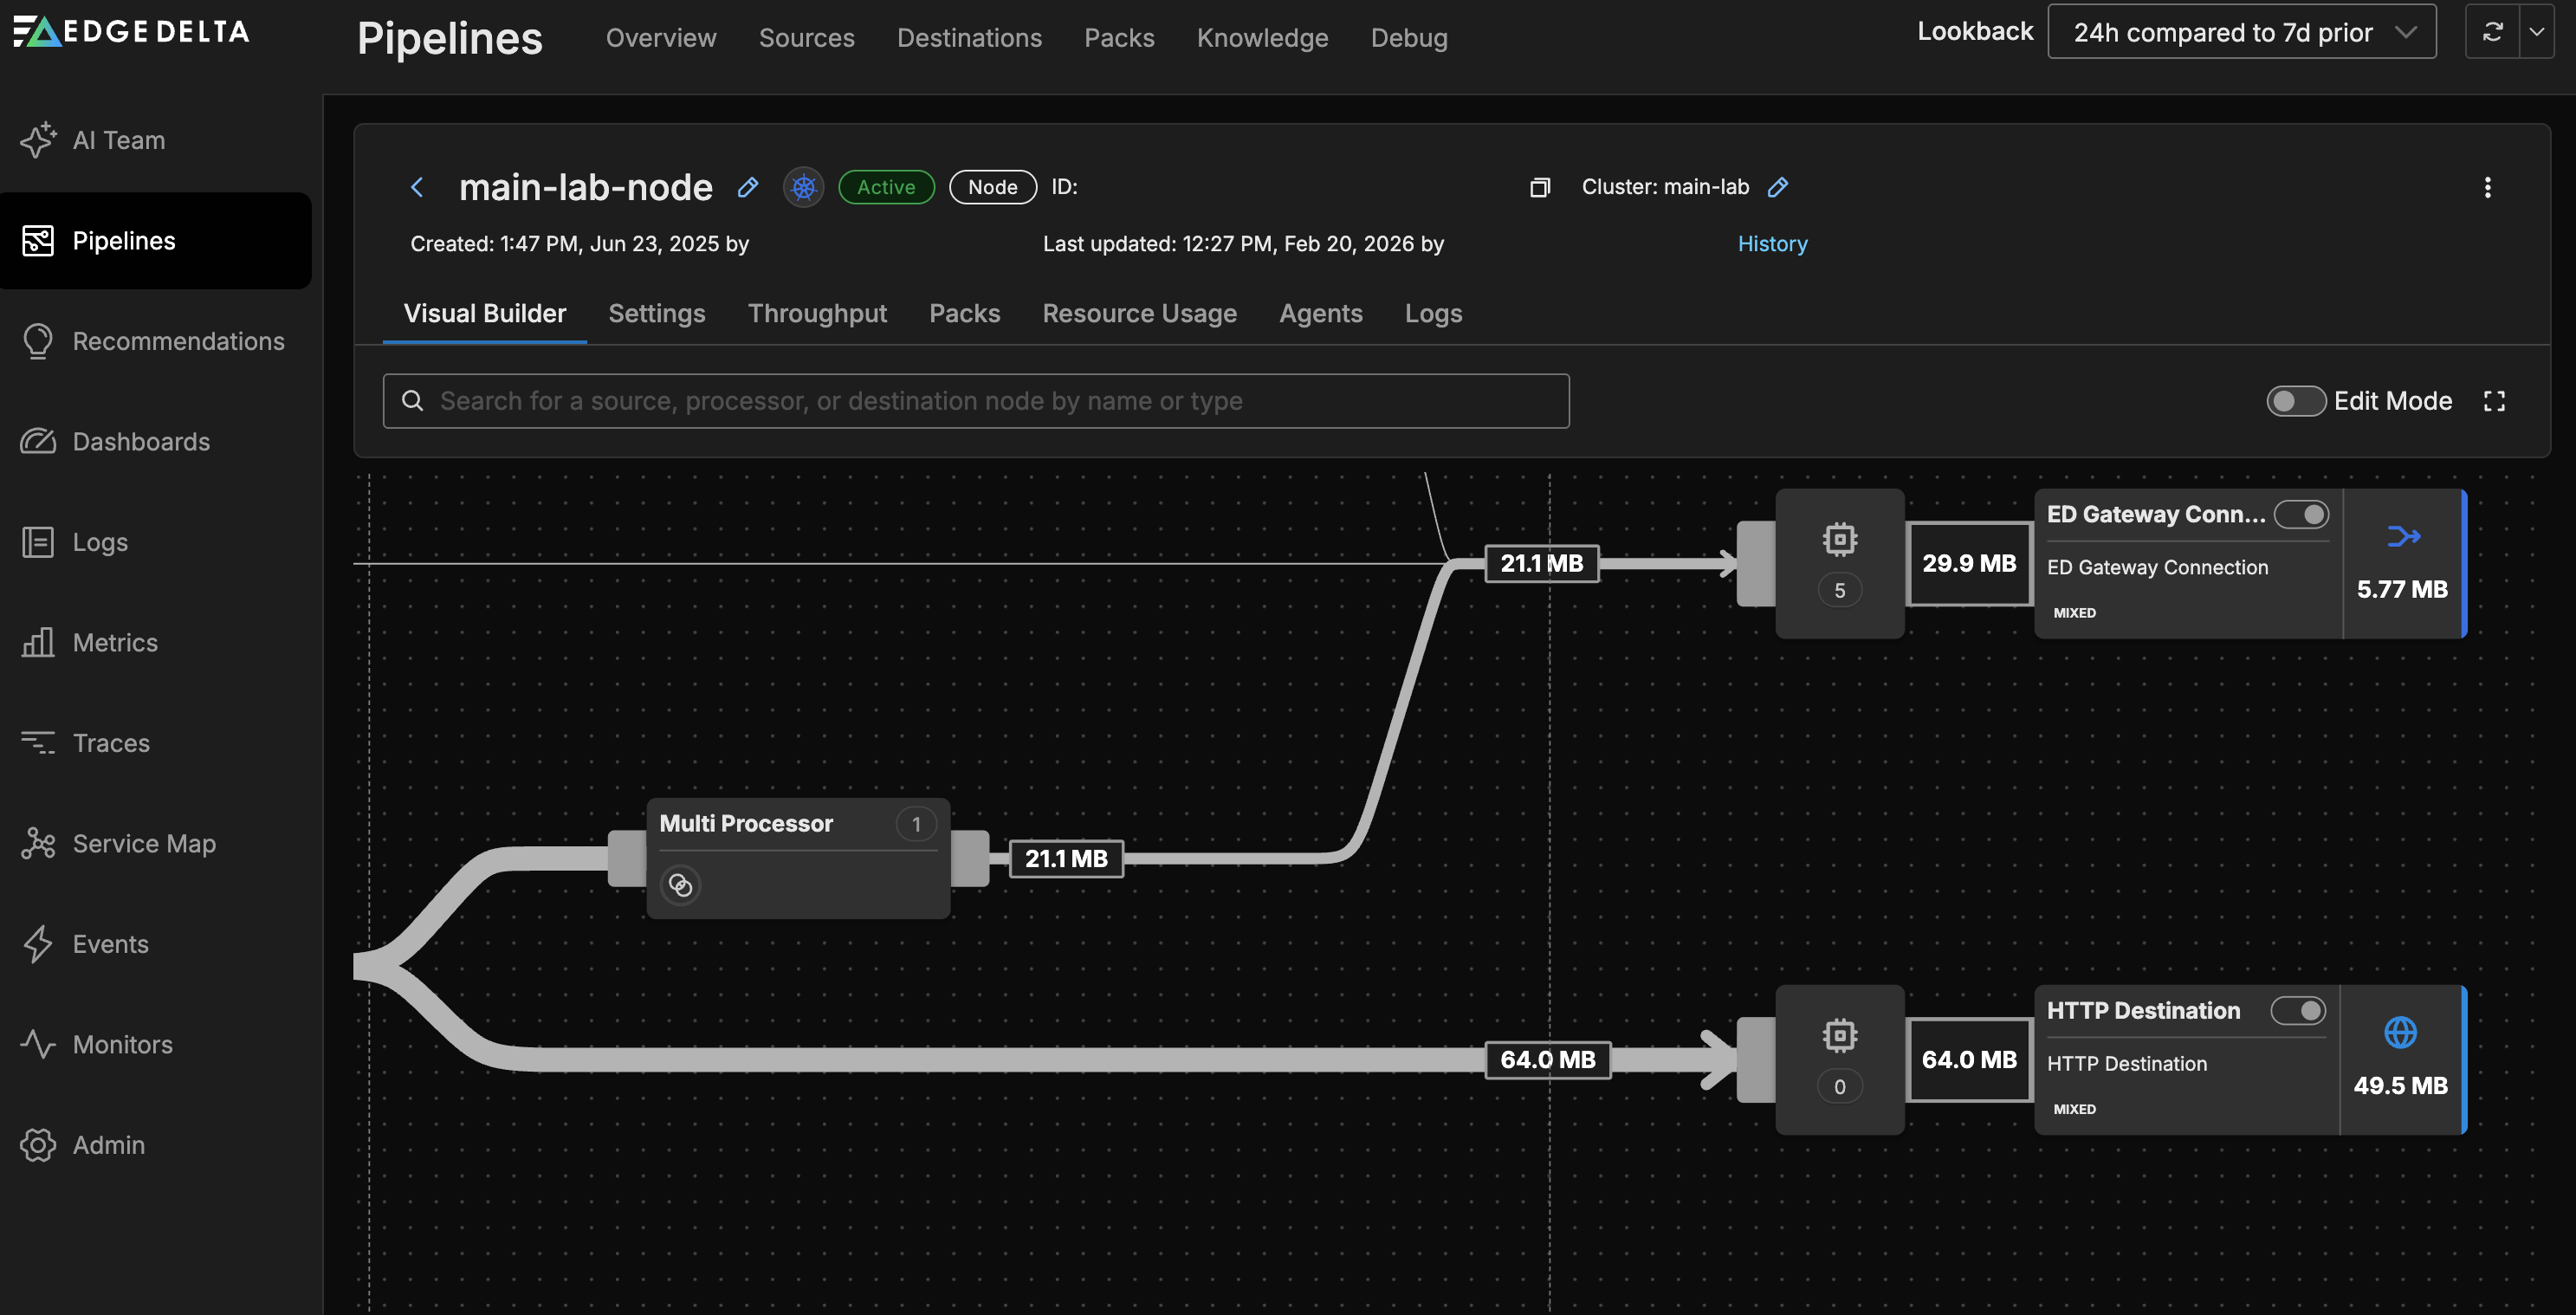
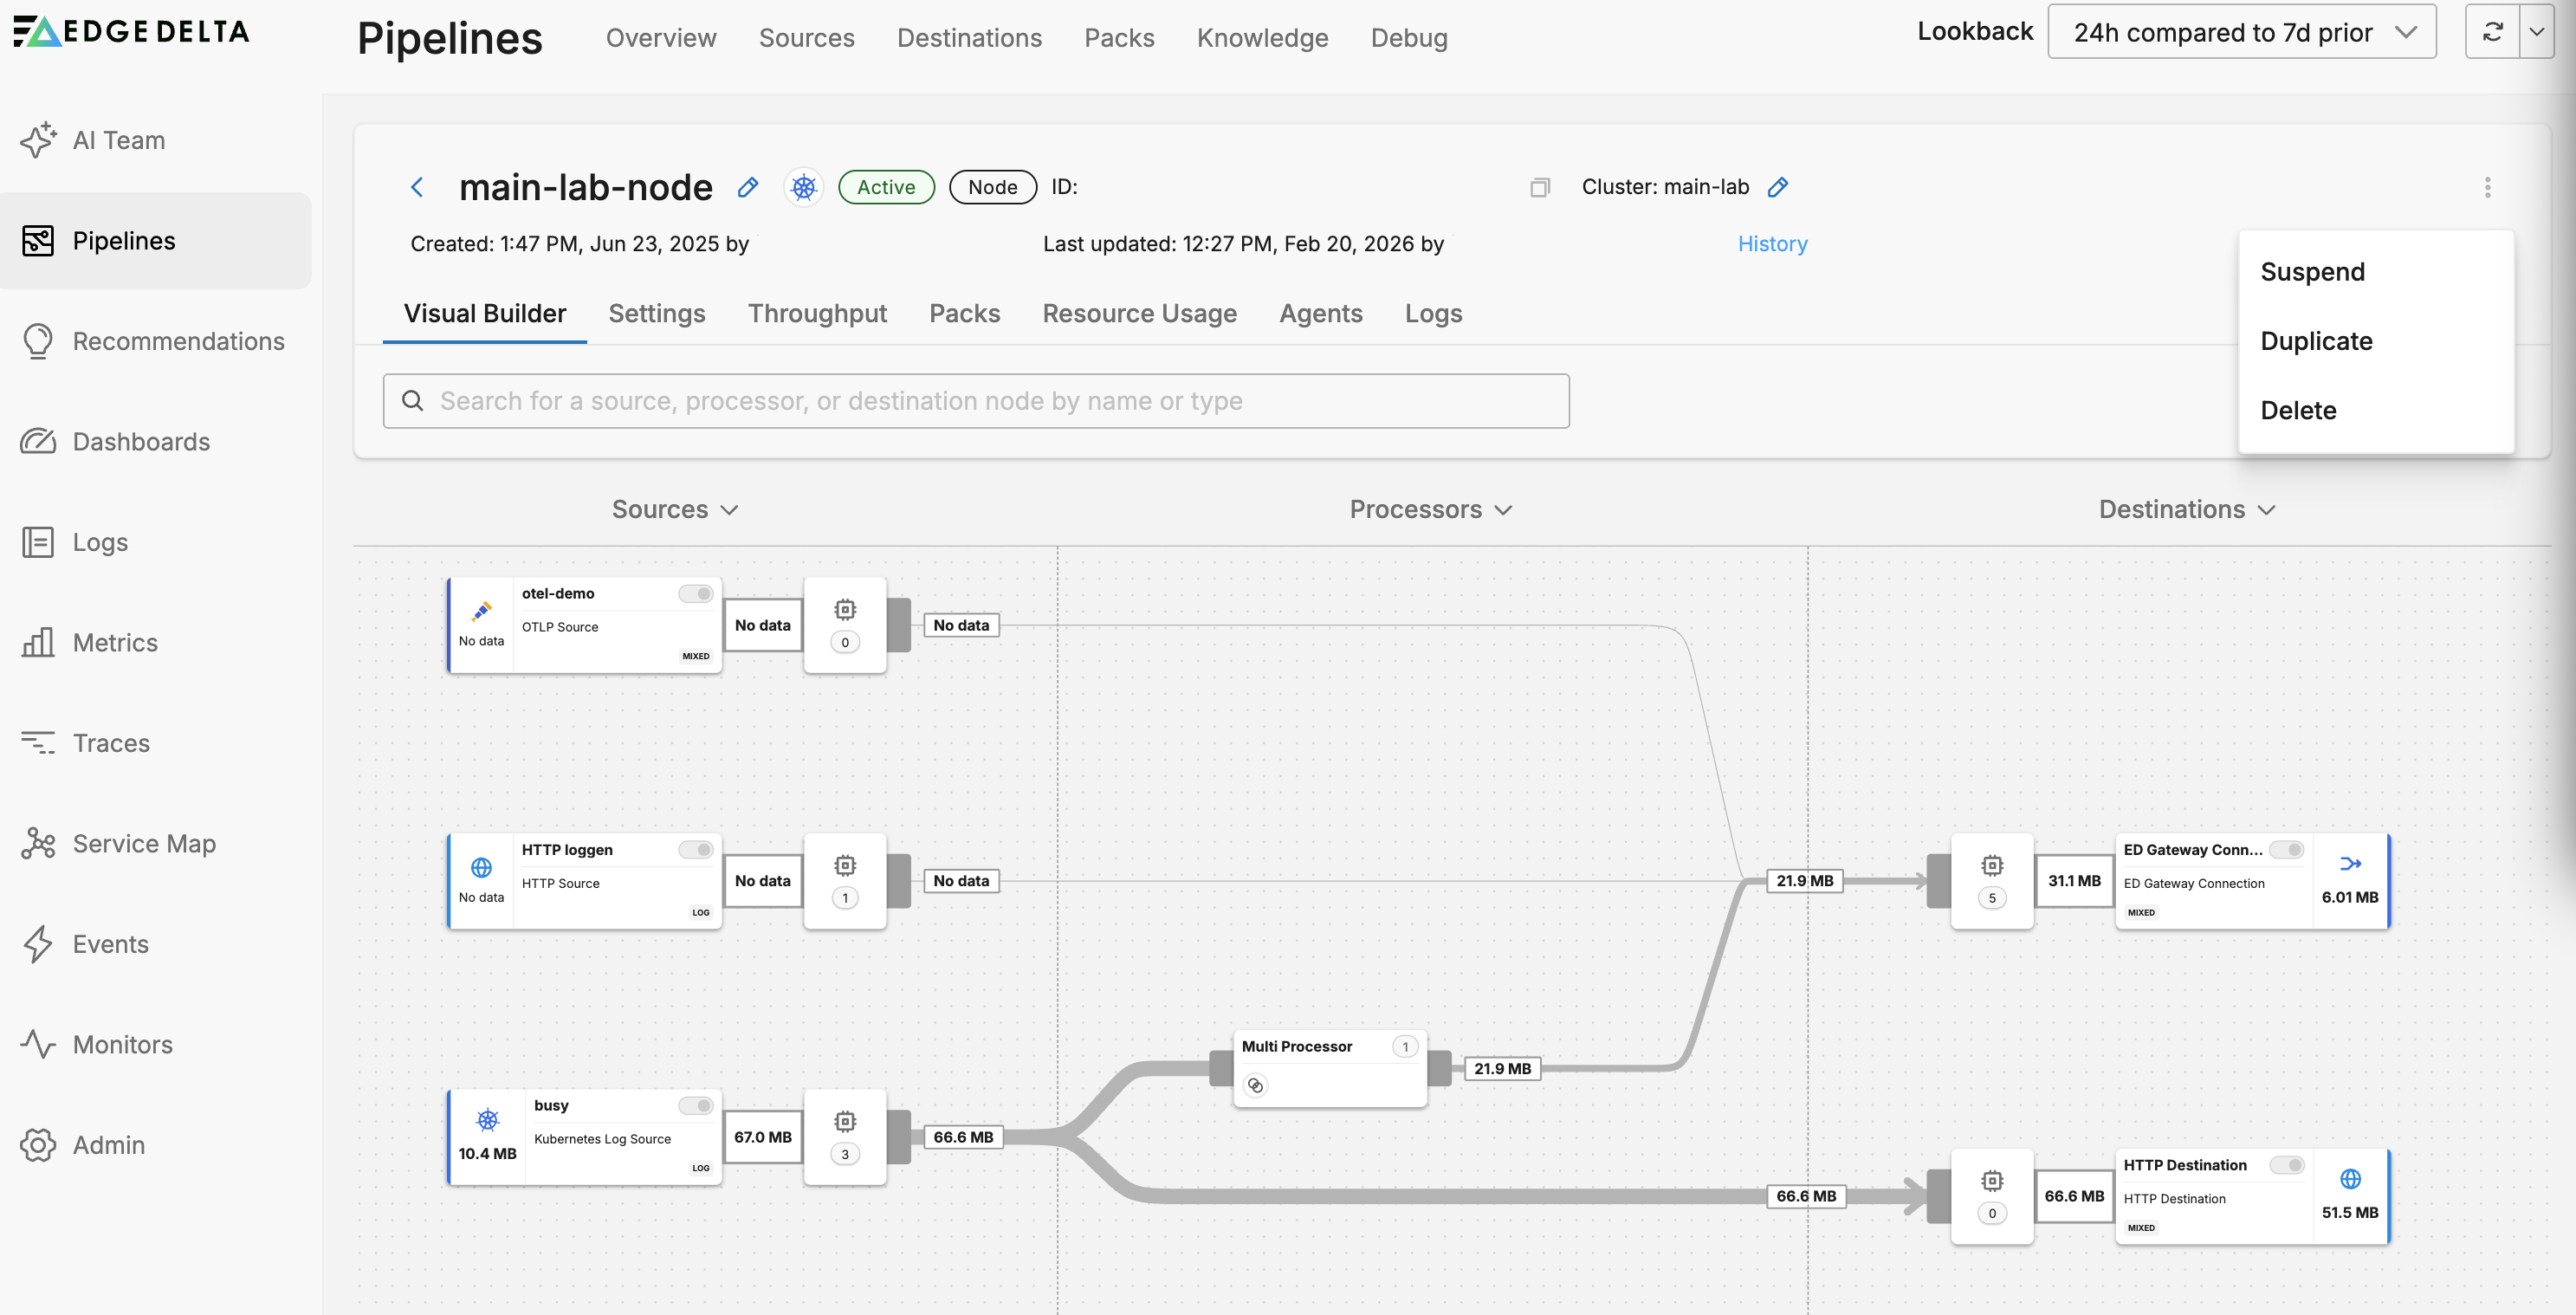
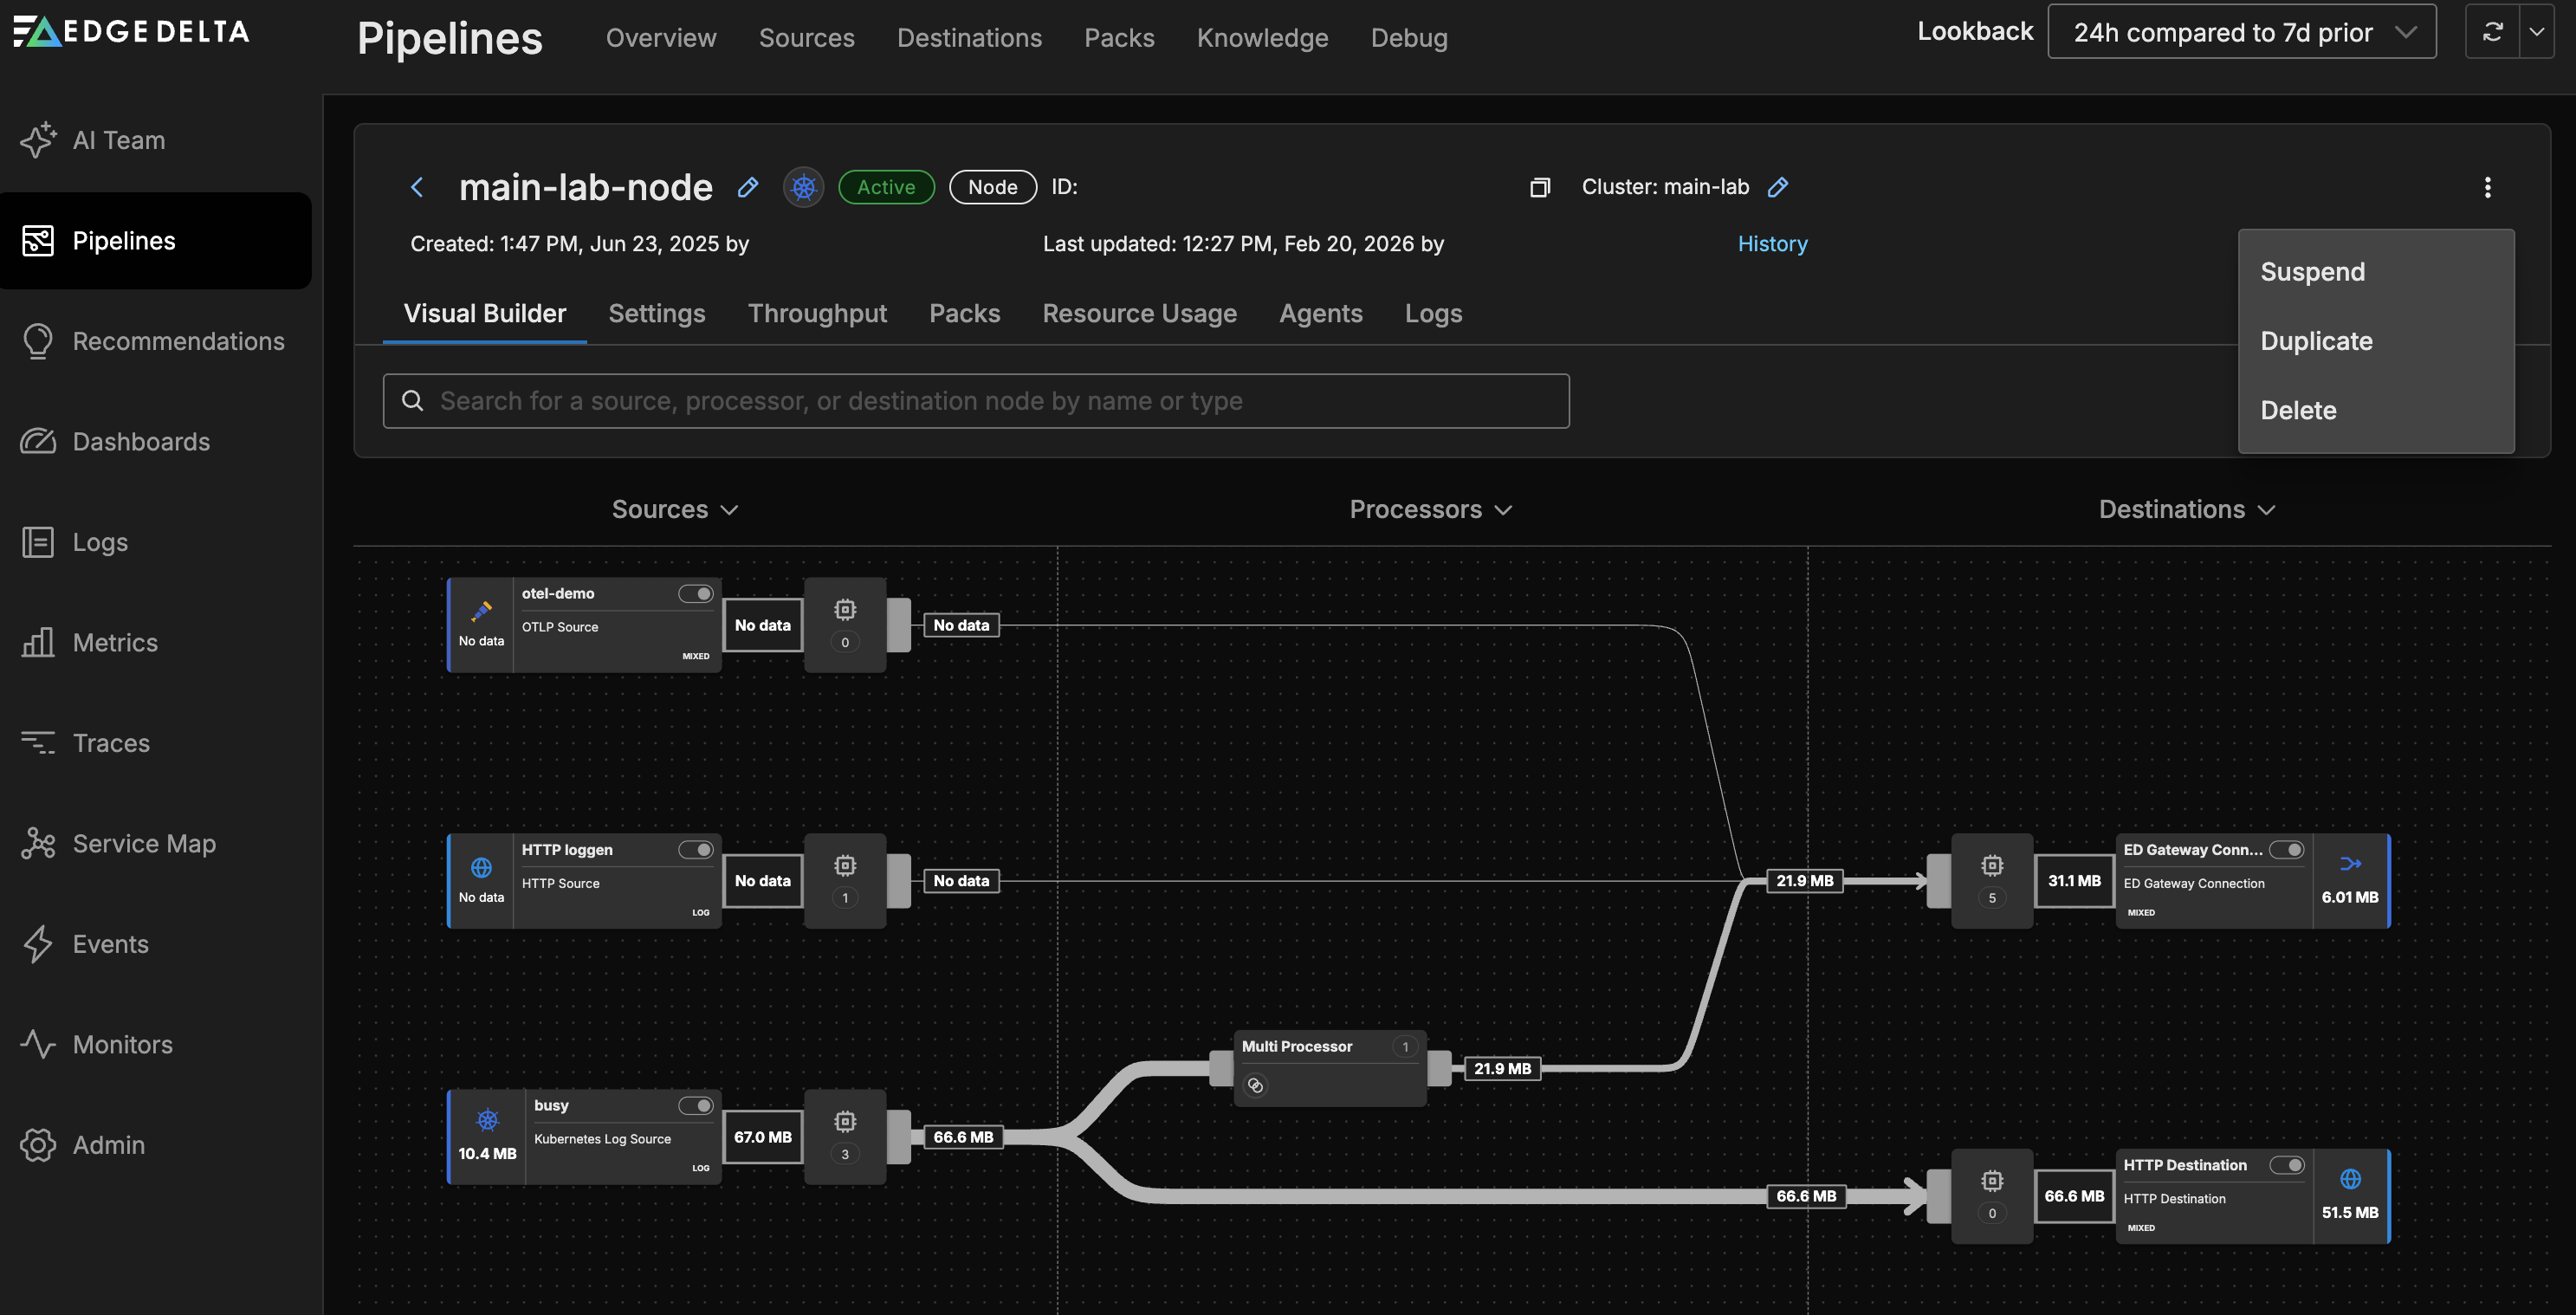
Pipeline Builder
The pipeline builder opens with Edit Mode off. Turn it on to build a pipeline.
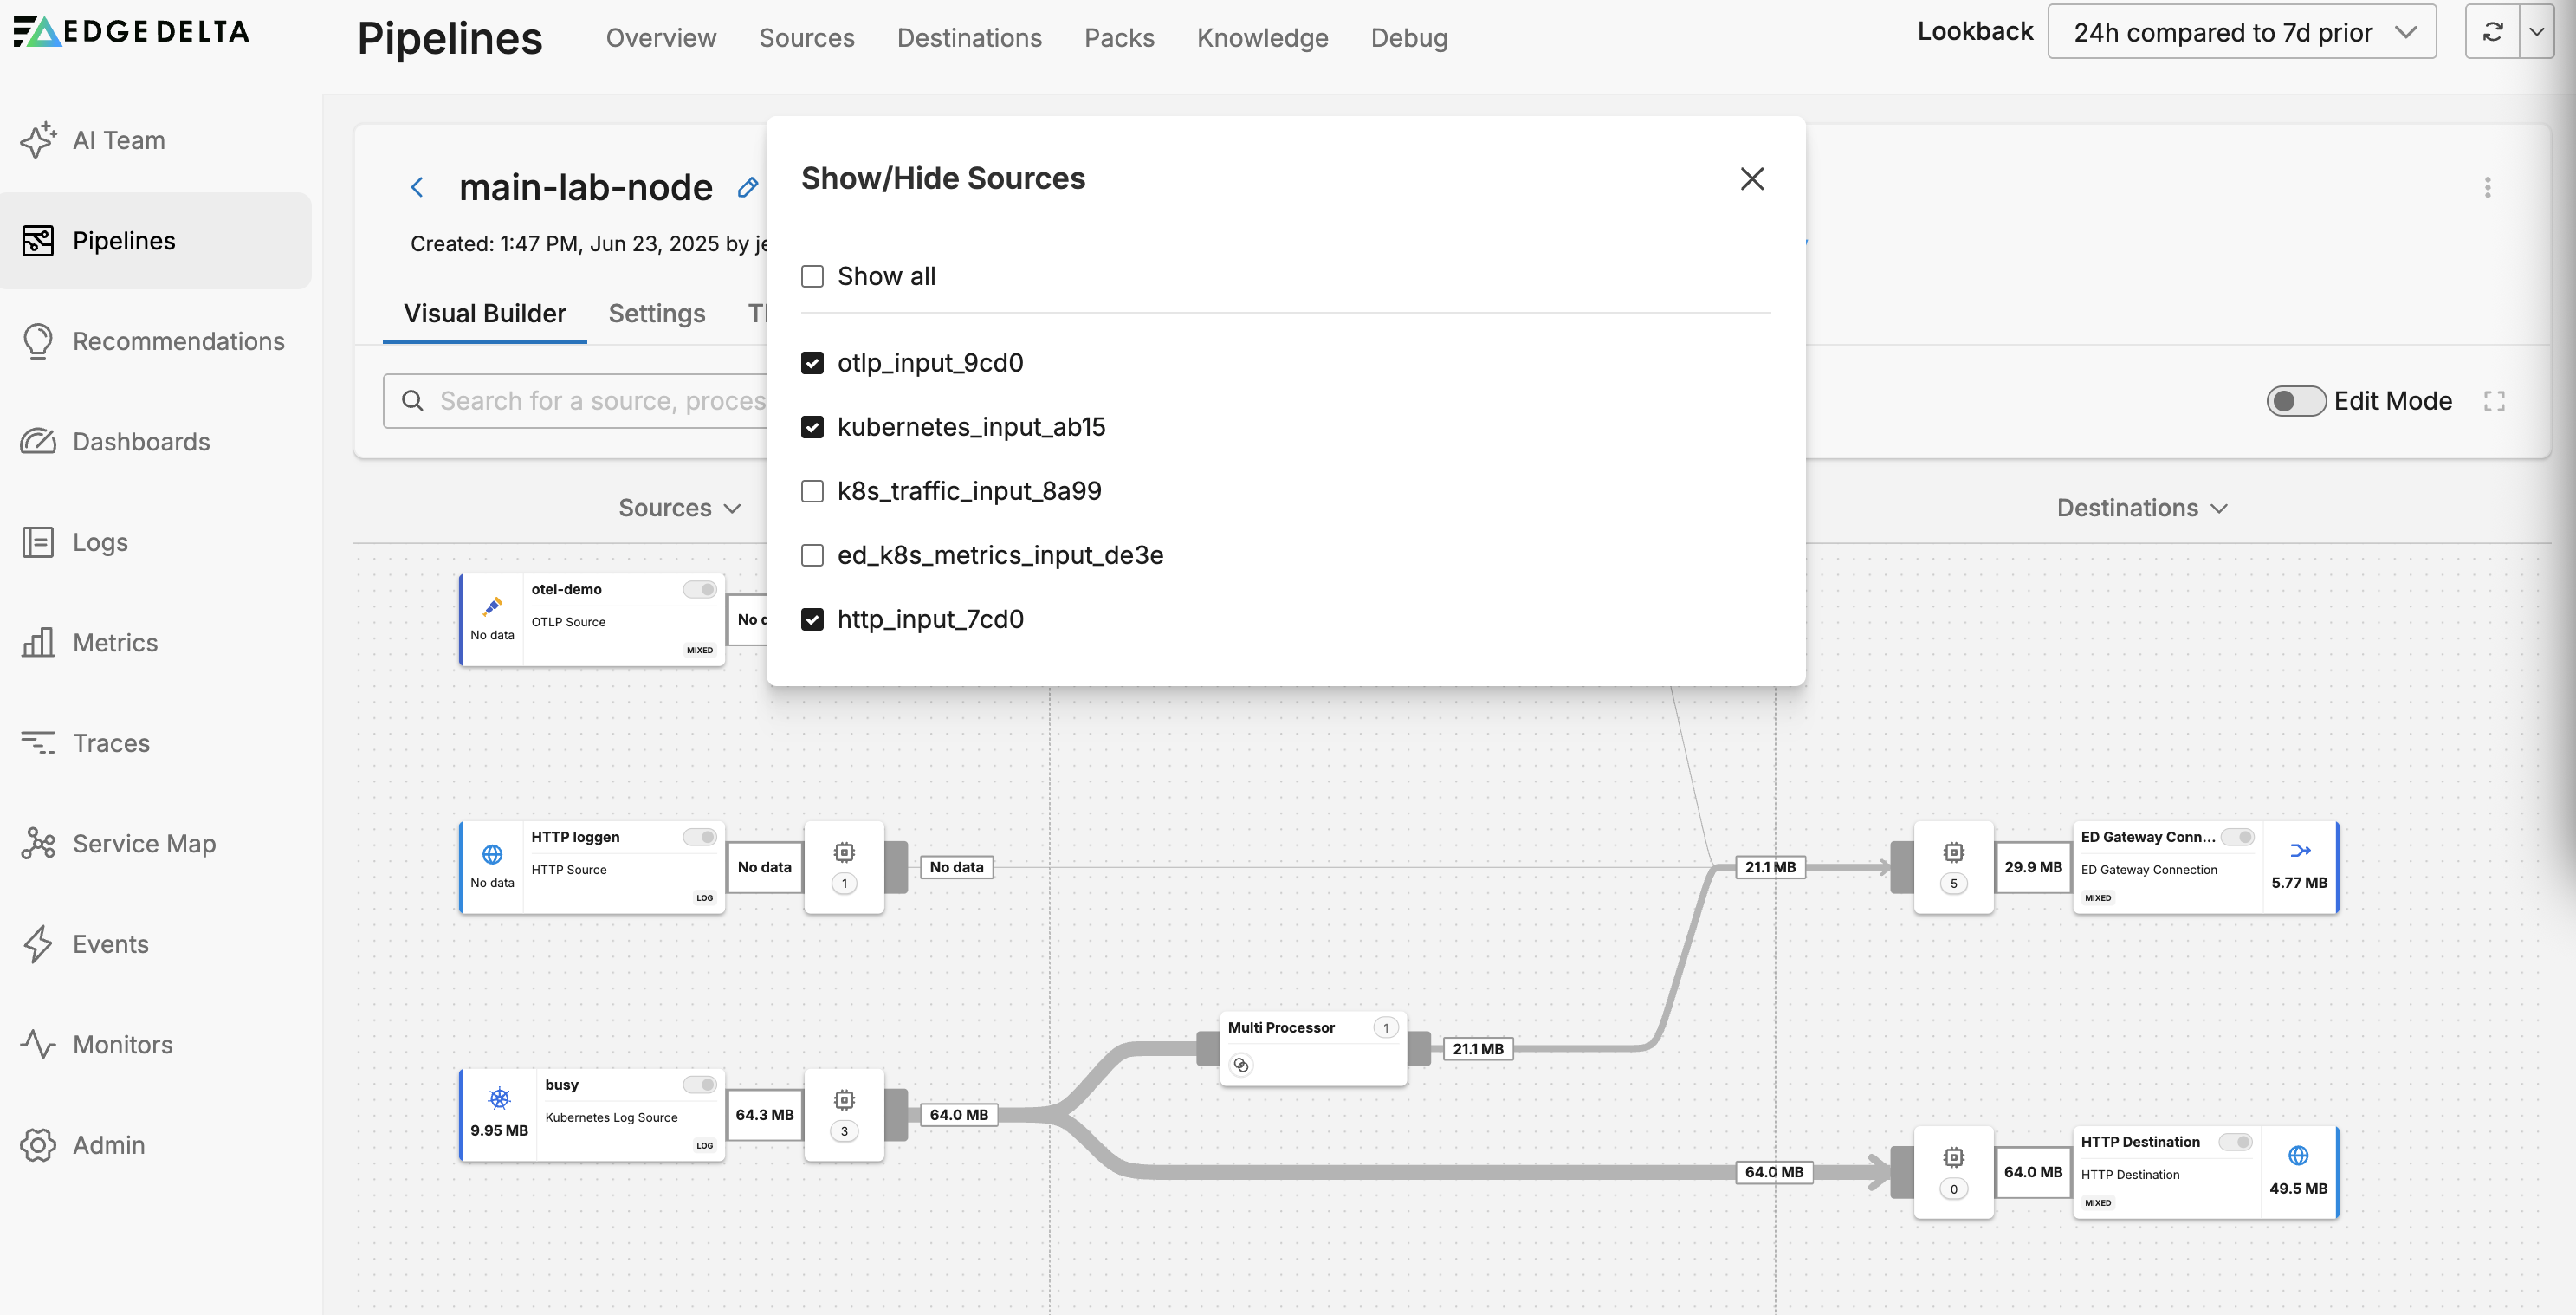
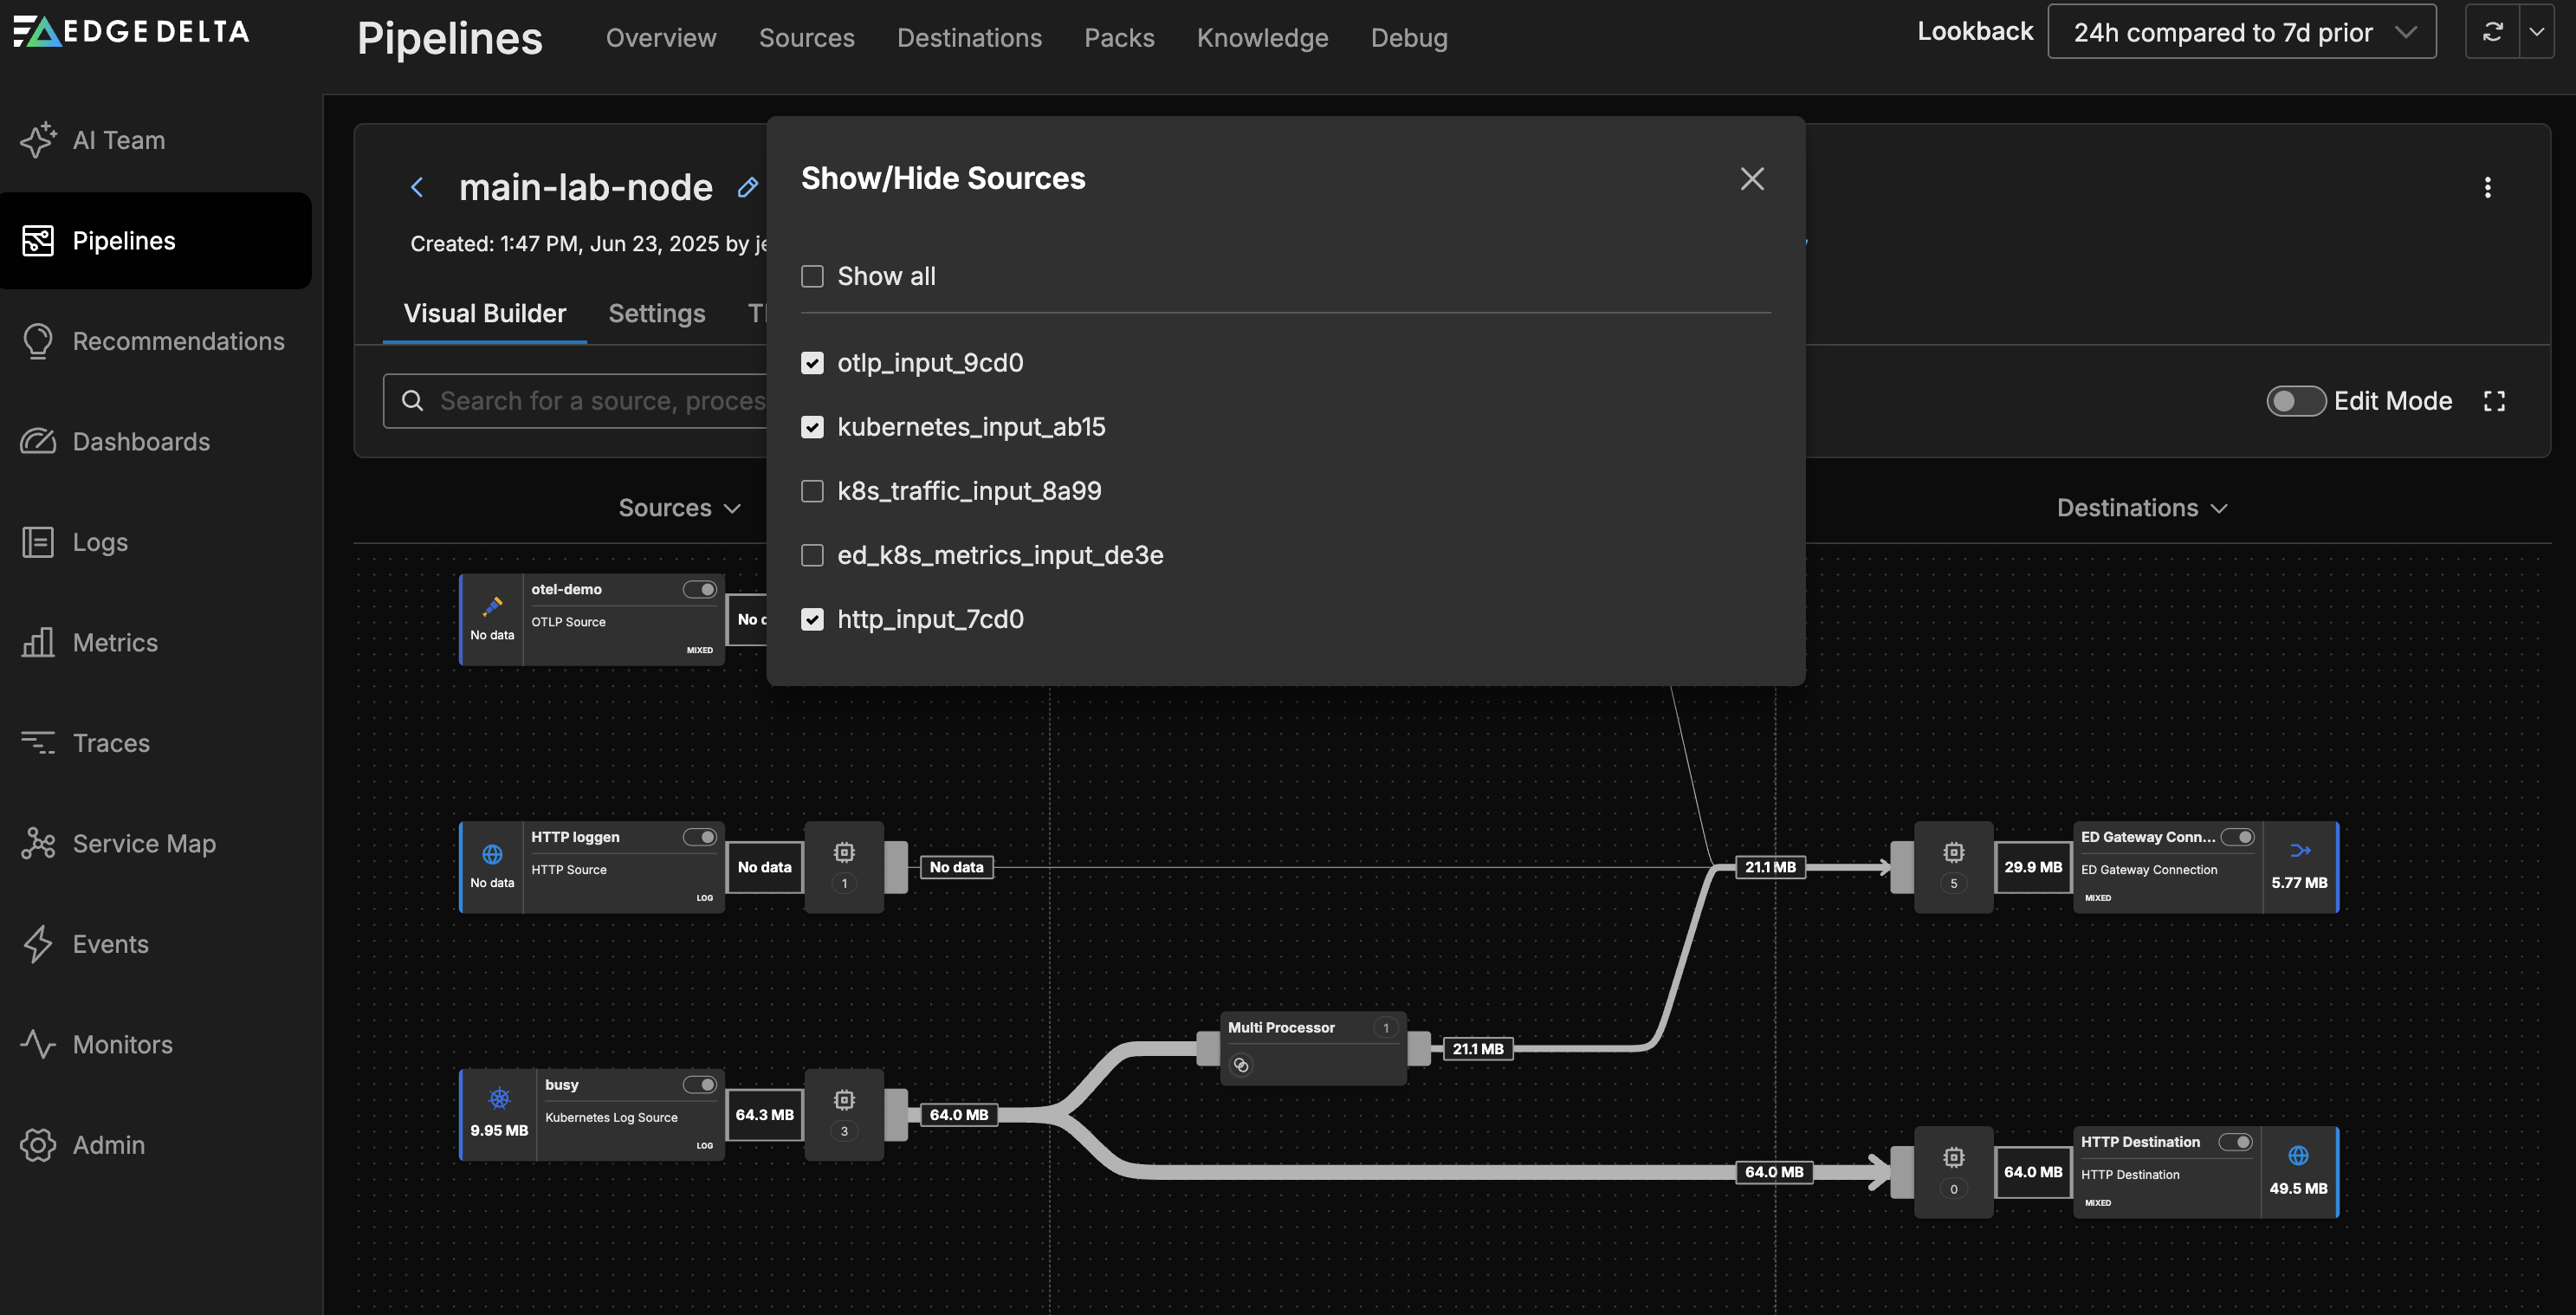
Filter Pipeline
You can filters by name the Sources, Processors and Destinations to view only the connections between the selected objects. Note this changes the view only, not the pipeline configuration.
Traffic Volume
The pipeline builder lists the outgoing data rate for each node. Using this view you can quickly see how the configuration contributes to the overall pipeline efficiency.
The link weight indicates the relative volume of traffic on link between two nodes.
Nodes
Nodes are configuration objects. Each node performs a function and you design a pipeline by creating a flow of traffic through a set of nodes. Select a node to open its configuration.
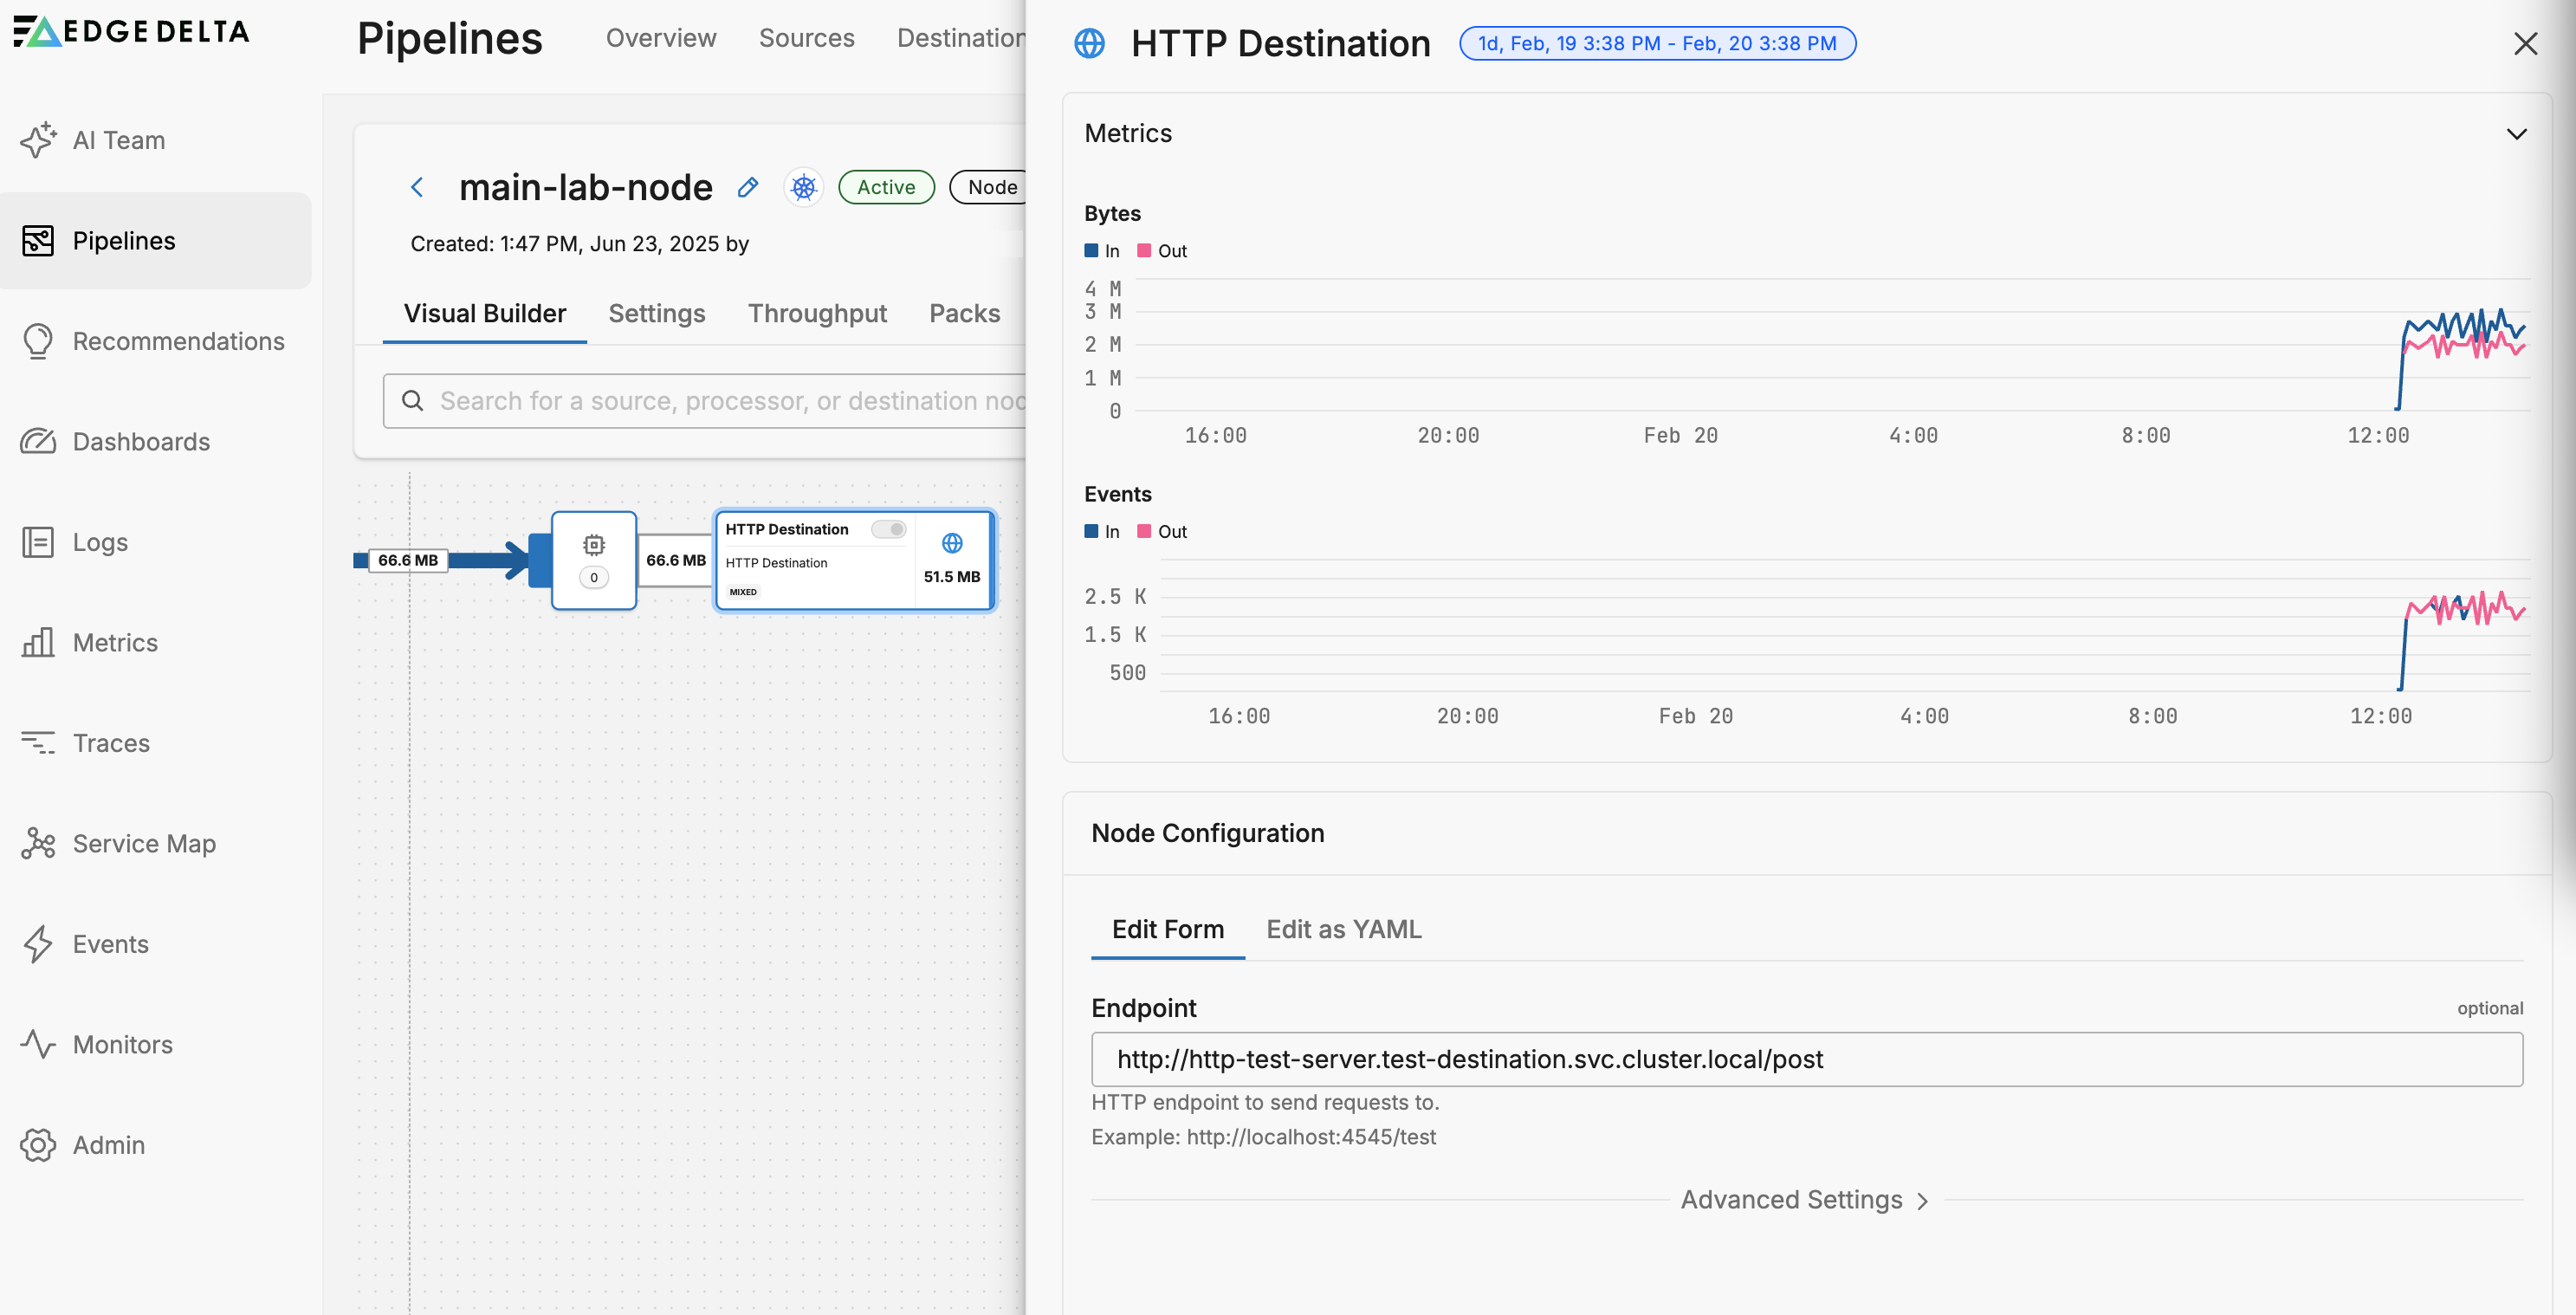
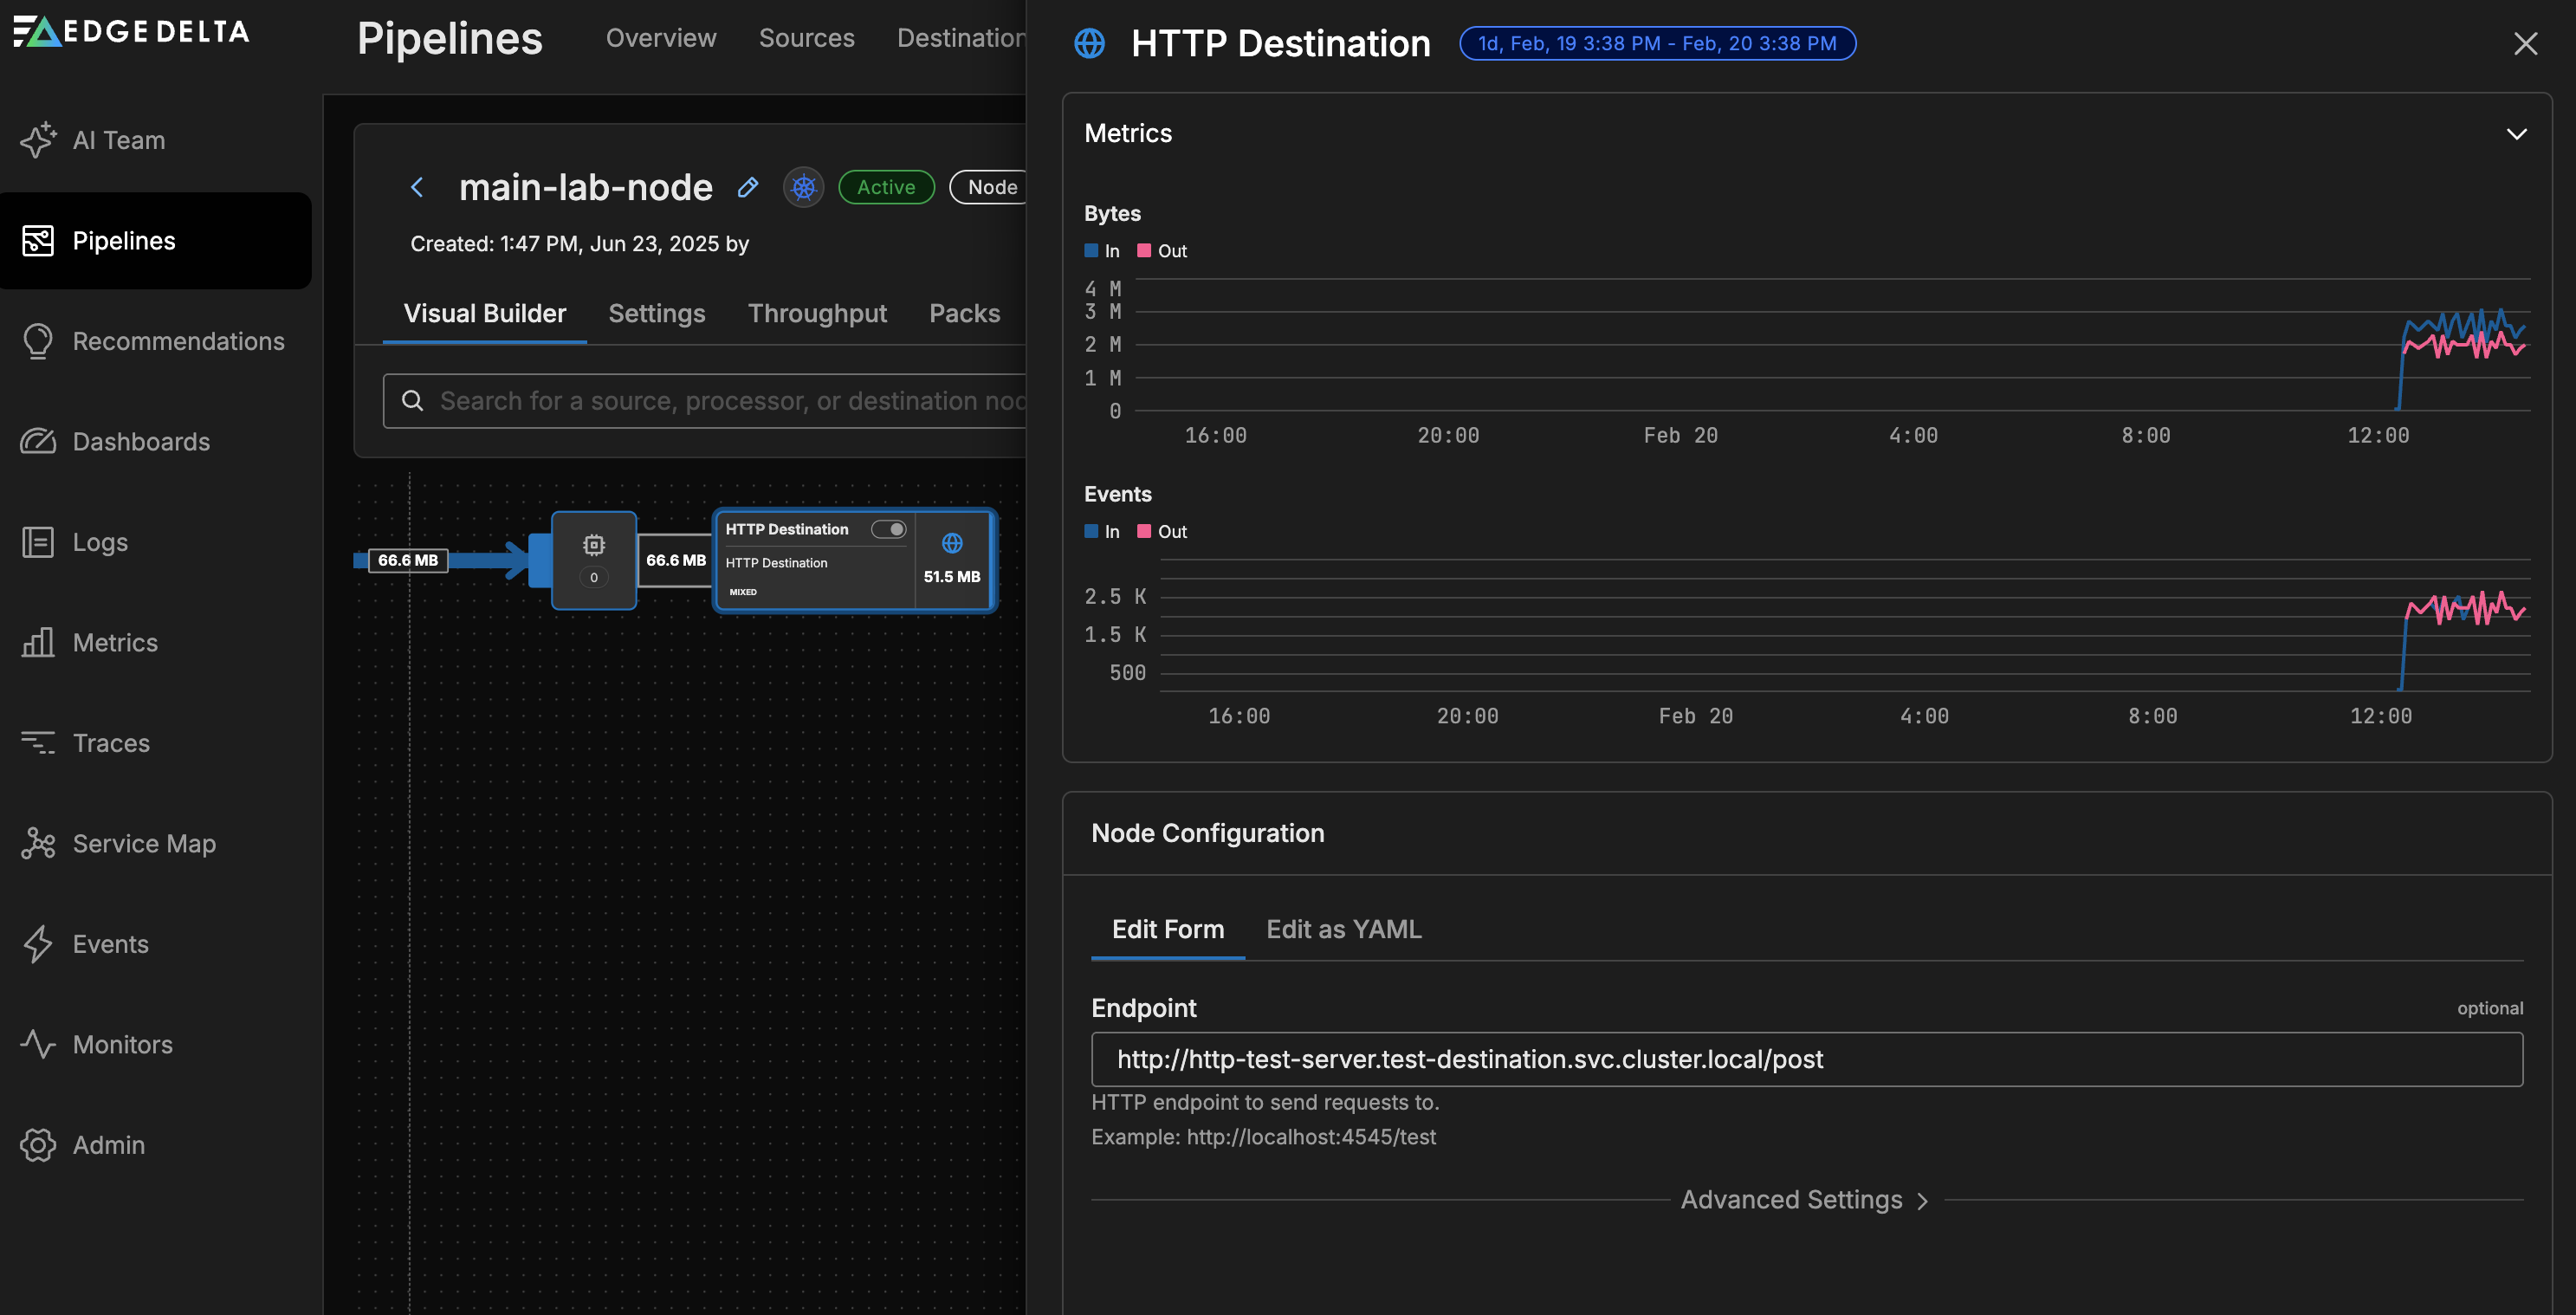
You can view traffic metrics in events and bytes.
Disable Nodes
You can disable individual source and destination nodes without removing them from the pipeline. Disabled nodes are ignored by the agent at startup. This is useful when experimenting with pipeline configurations or troubleshooting.
To disable a node, select the node in the pipeline builder and toggle it off. Alternatively, set disabled: true in the node’s YAML configuration:
nodes:
  - name: my_source
    type: kubernetes_input
    disabled: true
To disable individual processors within a multiprocessor node, see Disable Processors.
Pipeline Options
Click the kebab icon to view settings for the pipeline.
- Suspend: This option stops the Edge Delta agents associated with the pipeline from tailing data and collecting metrics or traces. However, they still emit small health events occasionally.
- Duplicate: This option creates a new pipeline with the same configuration but it has a new Pipeline ID and name. This is not available for cloud pipelines.
- Delete: This option deletes the pipeline from the back end. You still need to delete the agents on the edge. See Delete a Pipeline Configuration.
Cloud pipelines have a Settings option. See Edit Cloud Pipeline Resources.
Settings
The Settings tab displays configuration options for the pipeline. These settings can also be configured in YAML format - see Agent Settings for the YAML configuration reference.
The Pipeline Settings tab is organized into six sections: General, Logging, Persisting Cursor, Read, Live Tail, and Secrets.
General
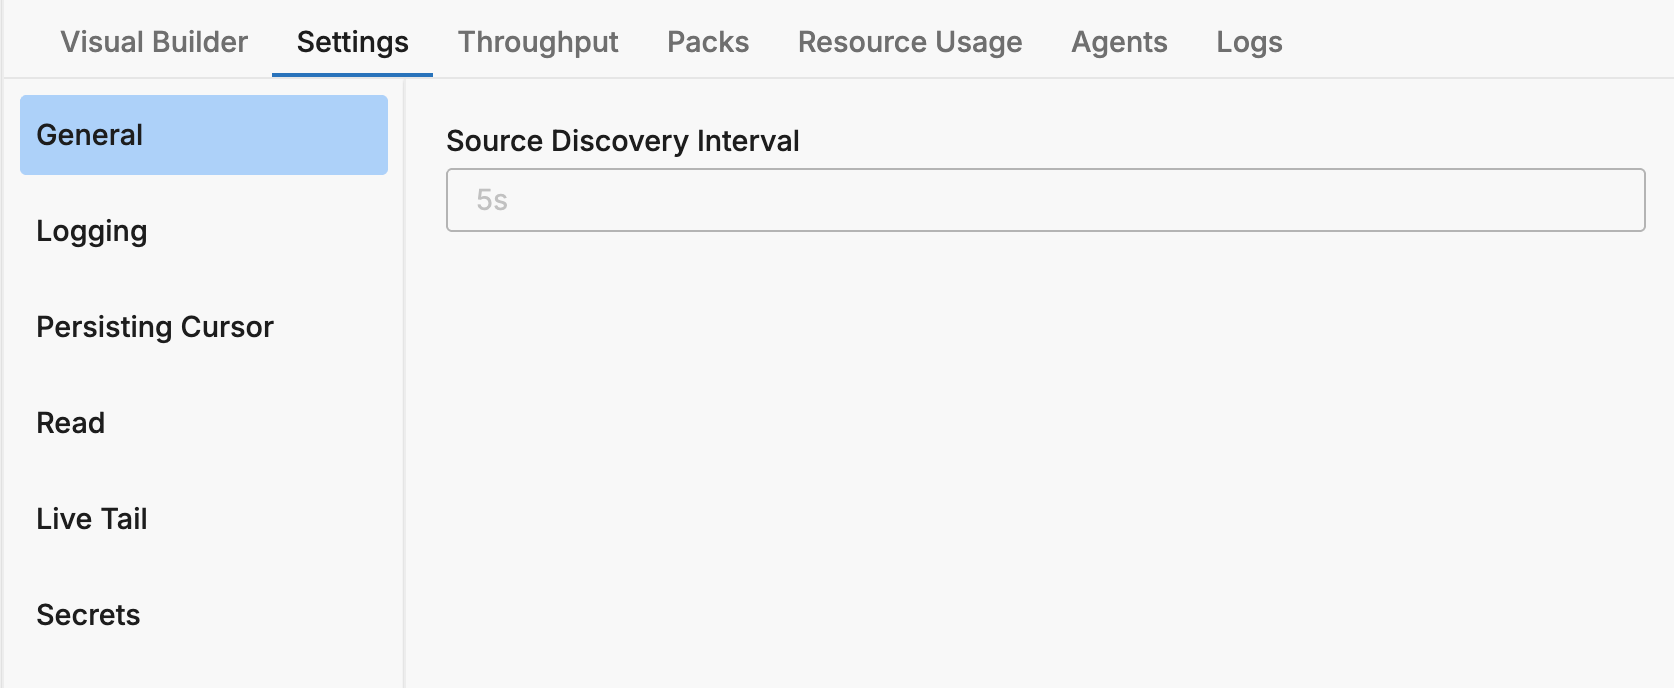
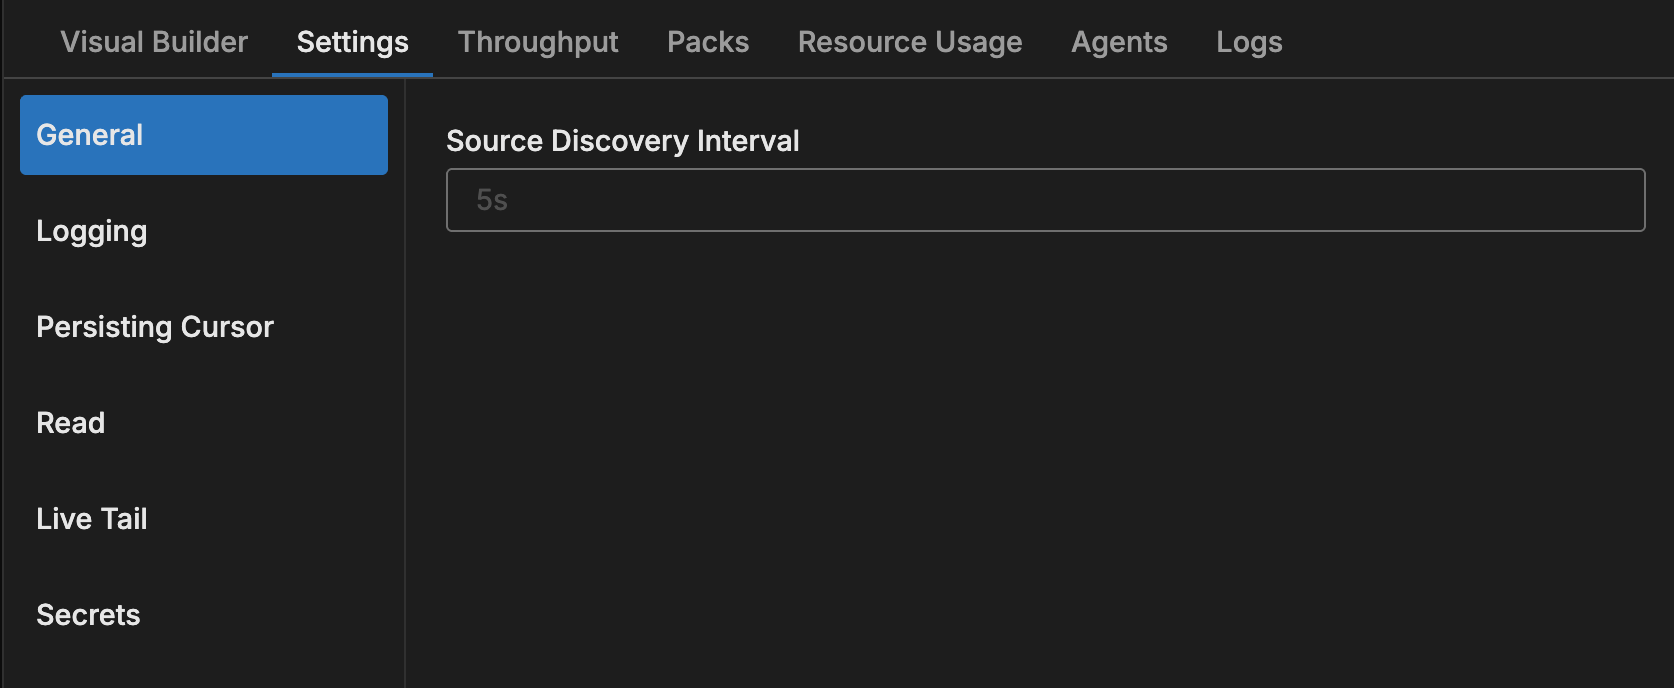
The General section controls basic agent behavior.
| Setting | Description | Default | YAML Field |
|---|---|---|---|
| Source Discovery Interval | Duration after which source discovery is invoked | 5s | source_discovery_interval |
Logging
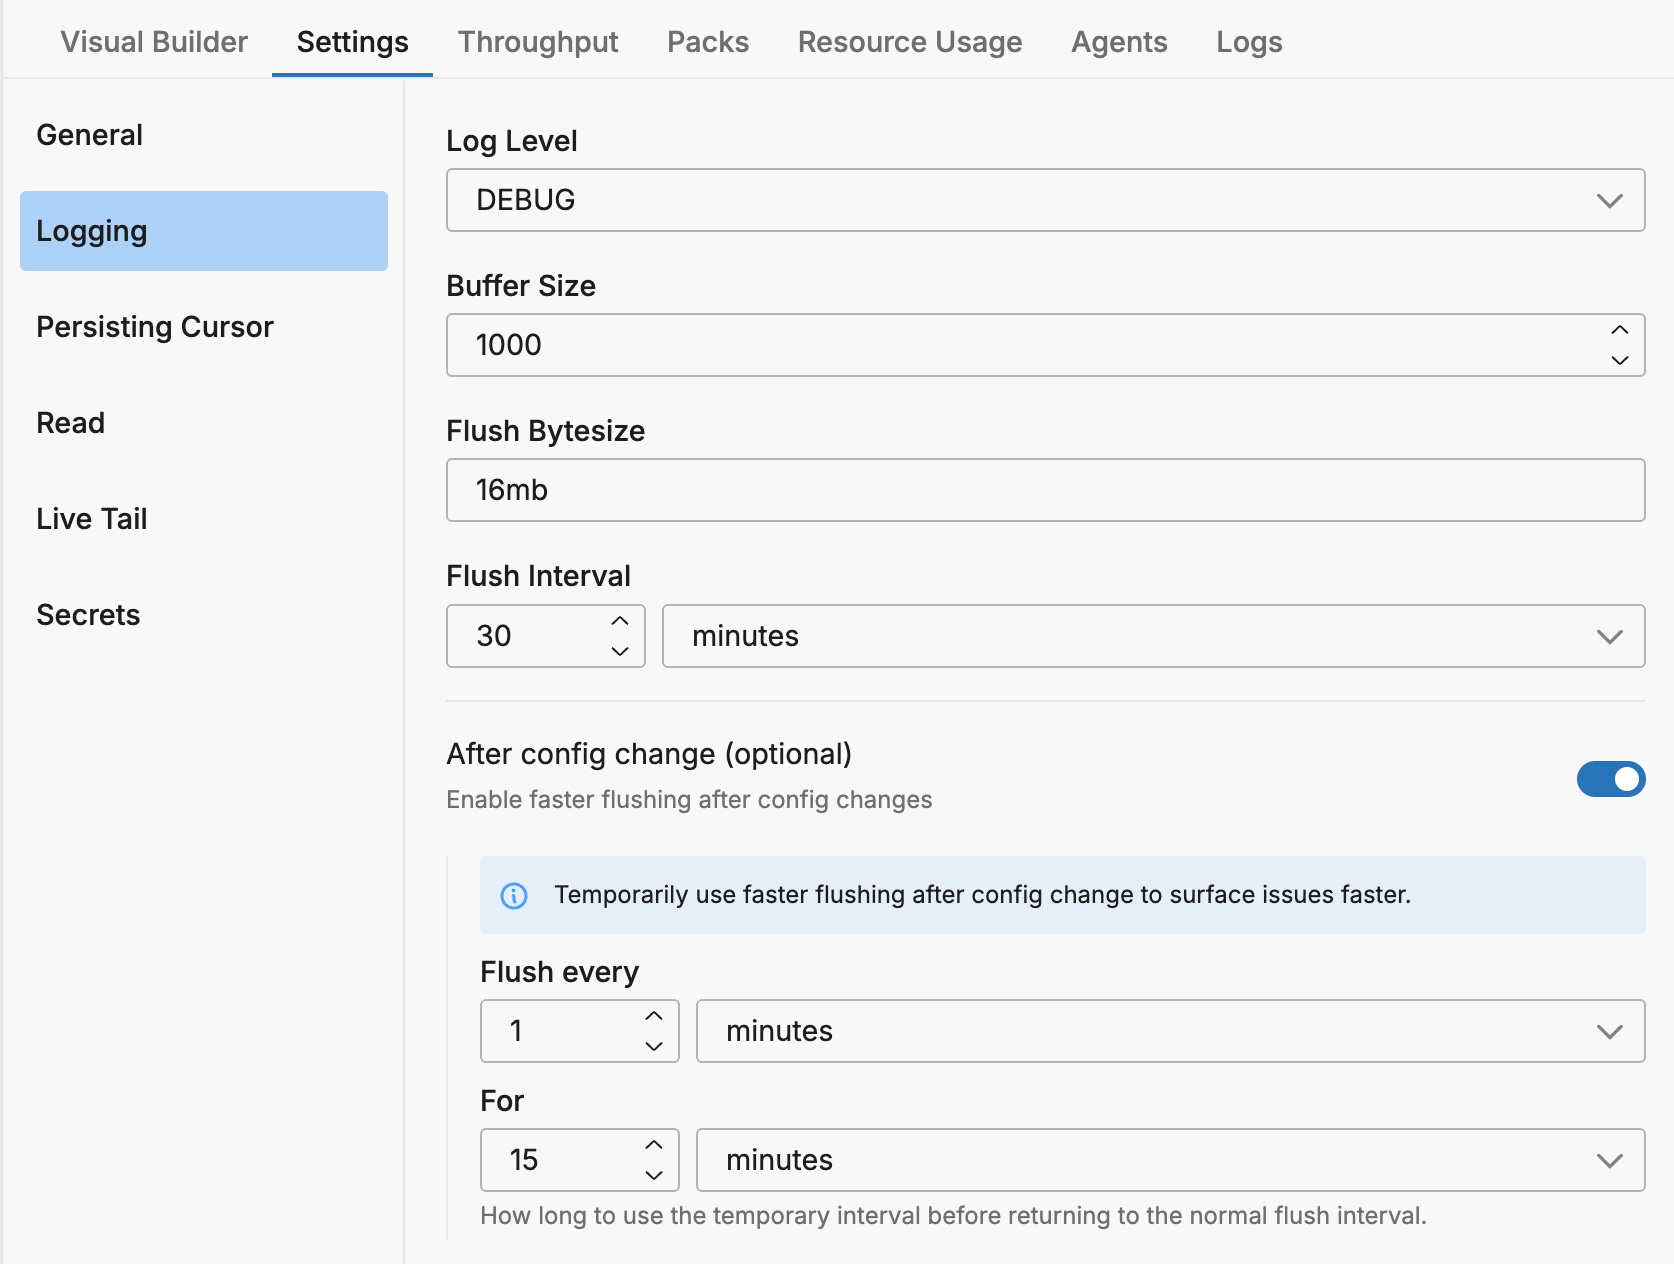
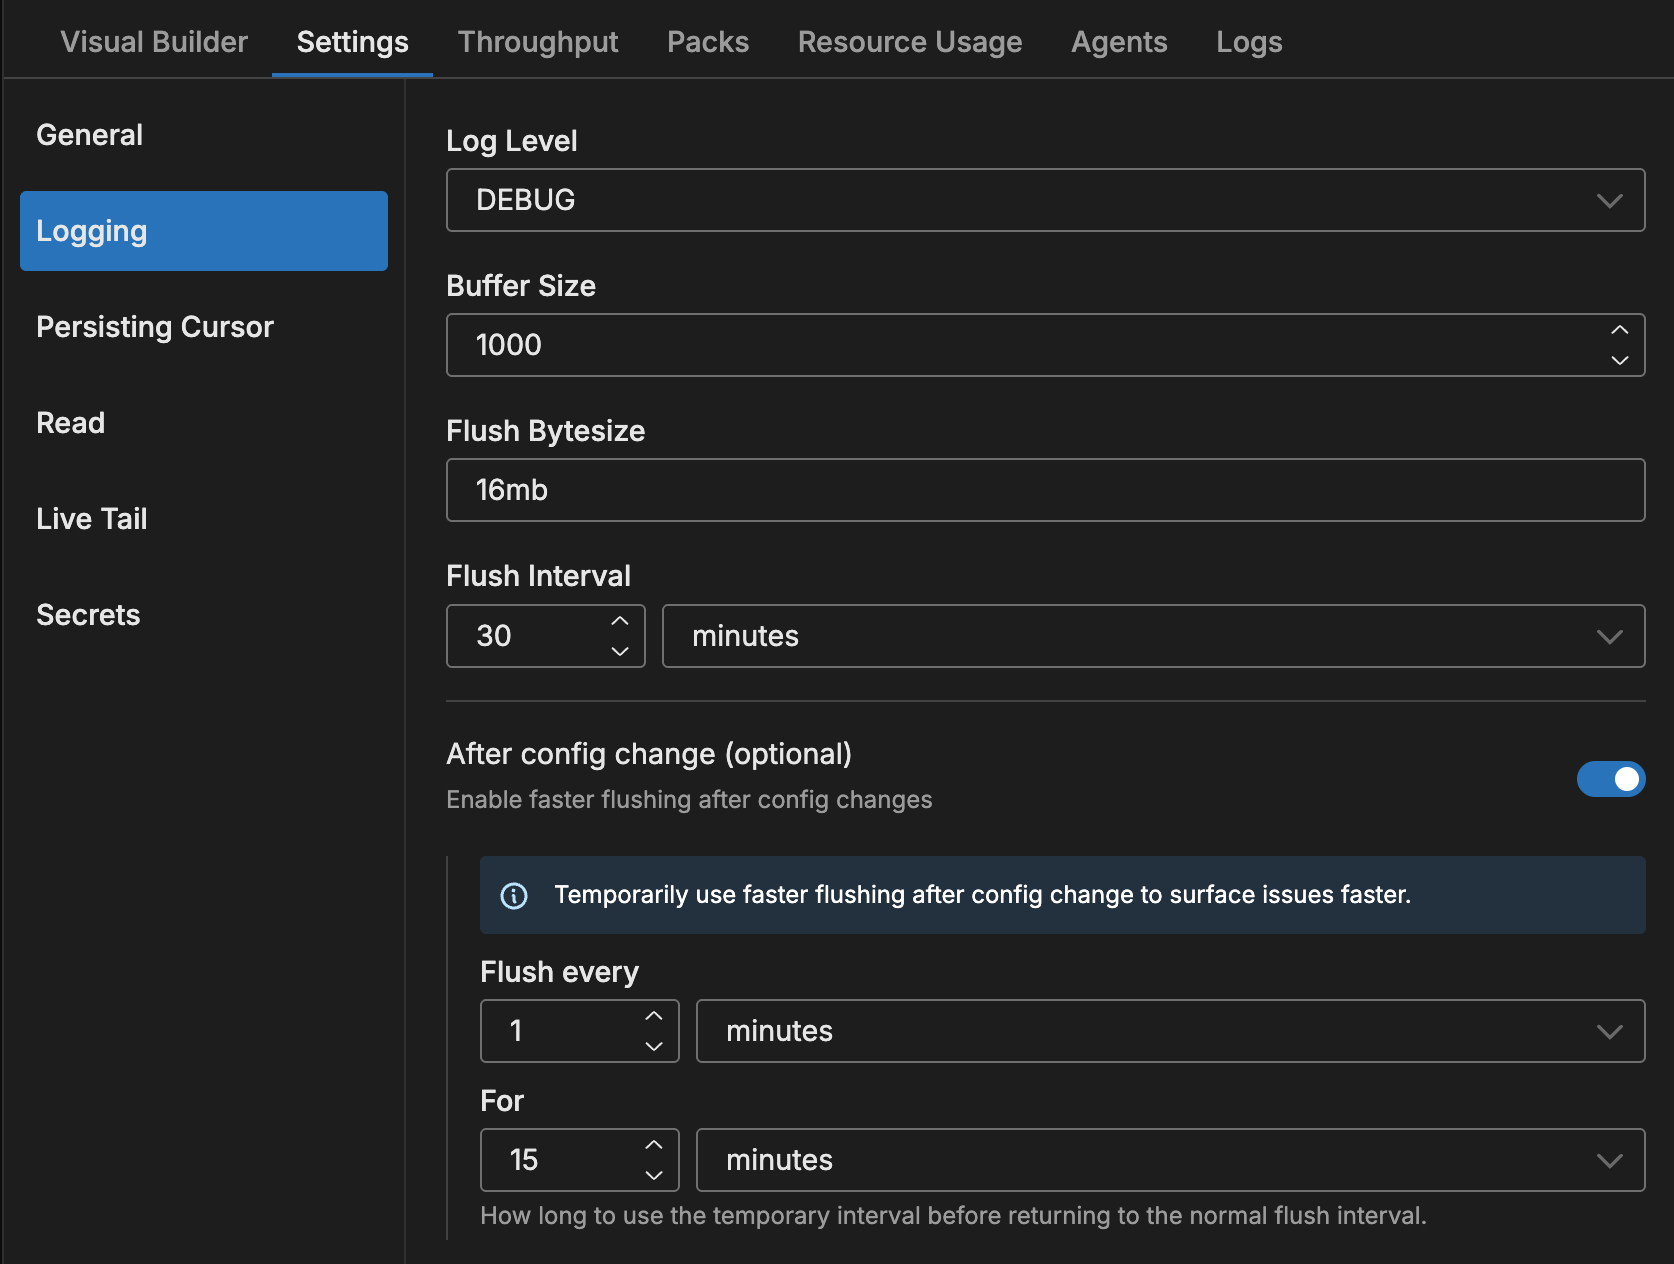
The Logging section configures how the agent manages its internal logs. These logs are used for troubleshooting the agent itself.
| Setting | Description | Default | YAML Field |
|---|---|---|---|
| Log Level | Severity level for agent logs (DEBUG, INFO, WARN, ERROR, FATAL) | INFO | log.level |
| Buffer Size | Size of the log buffer | - | - |
| Flush Bytesize | Size threshold that triggers a log flush | - | - |
| Flush Interval | Interval at which logs are flushed | - | self_log_flush_interval |
After Config Change (Optional):
Enable faster flushing after configuration changes to surface issues faster. When enabled, the agent temporarily uses a faster flush interval after a config change before returning to the normal interval.
| Setting | Description |
|---|---|
| Enable faster flushing | Toggle to enable temporary faster flushing after config changes |
| Flush every | The temporary flush interval to use after config changes |
| For duration | How long to use the temporary interval before returning to normal |
Persisting Cursor
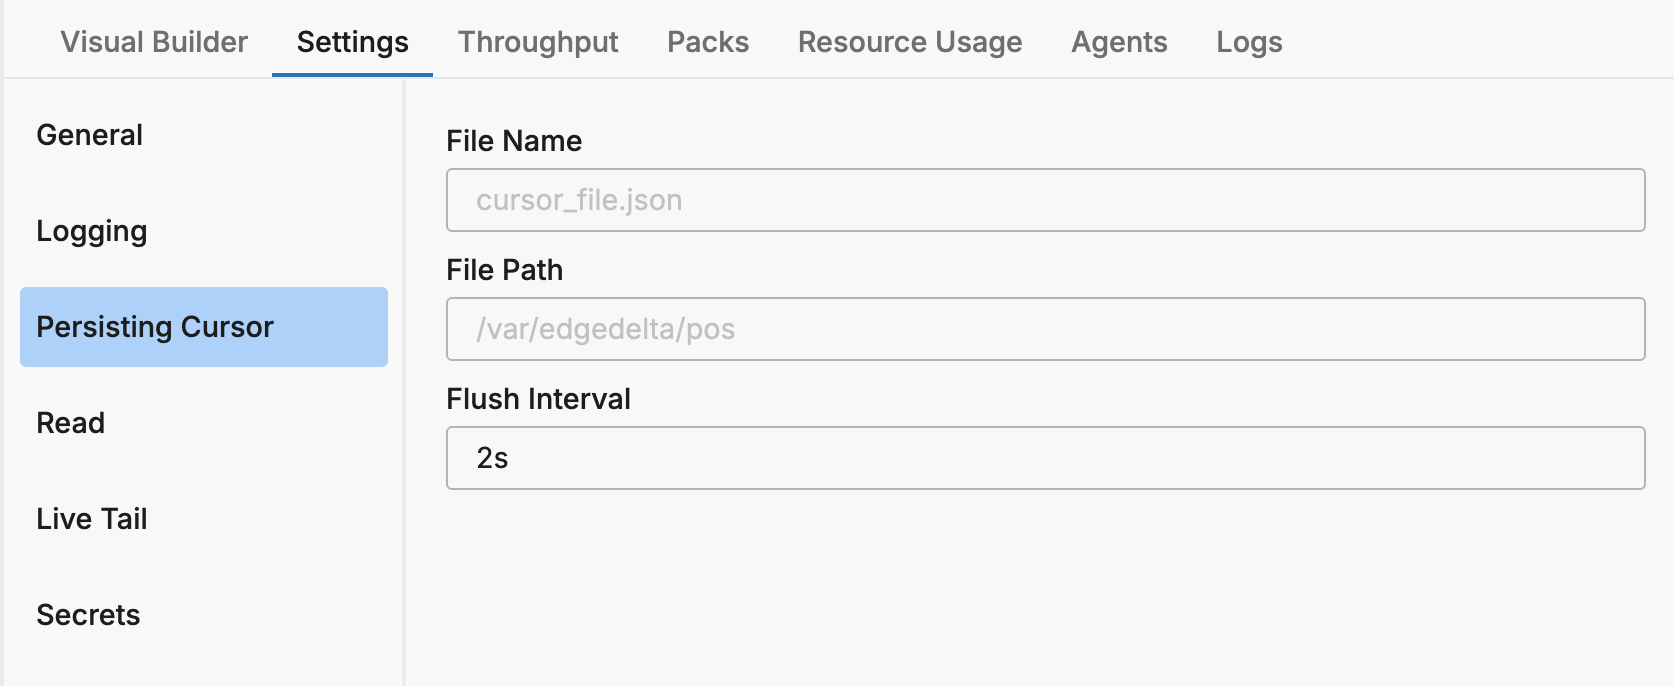
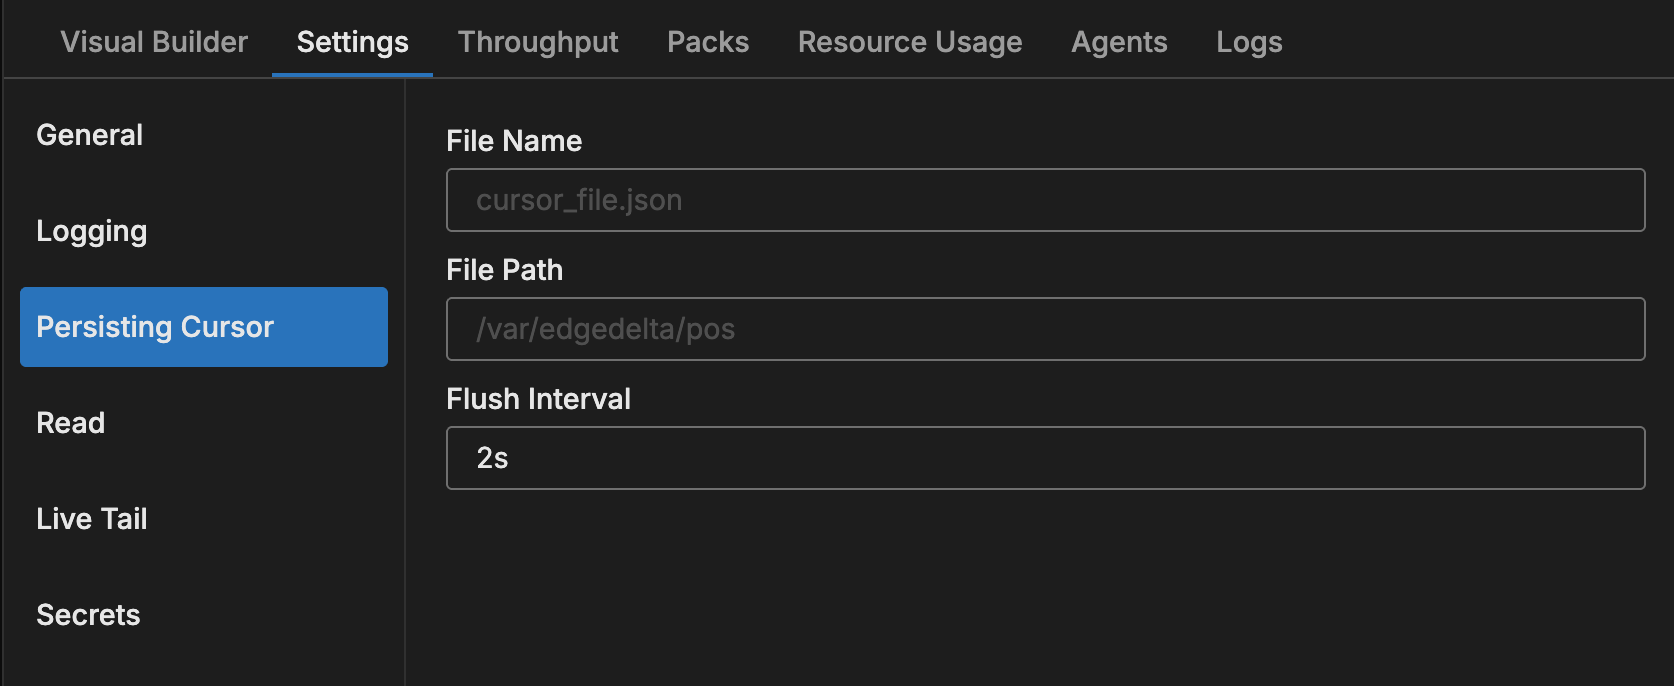
Configures persisting cursor for environments where no data can be lost during agent restarts. In YAML: persisting_cursor_settings
| Setting | Description | Default |
|---|---|---|
| File Name | Name of the cursor file | cursor_file.json |
| File Path | Folder where the cursor file will be created | /var/lib/edgedelta |
| Flush Interval | Interval after which the file will be saved to disk from memory | 1m |
Read
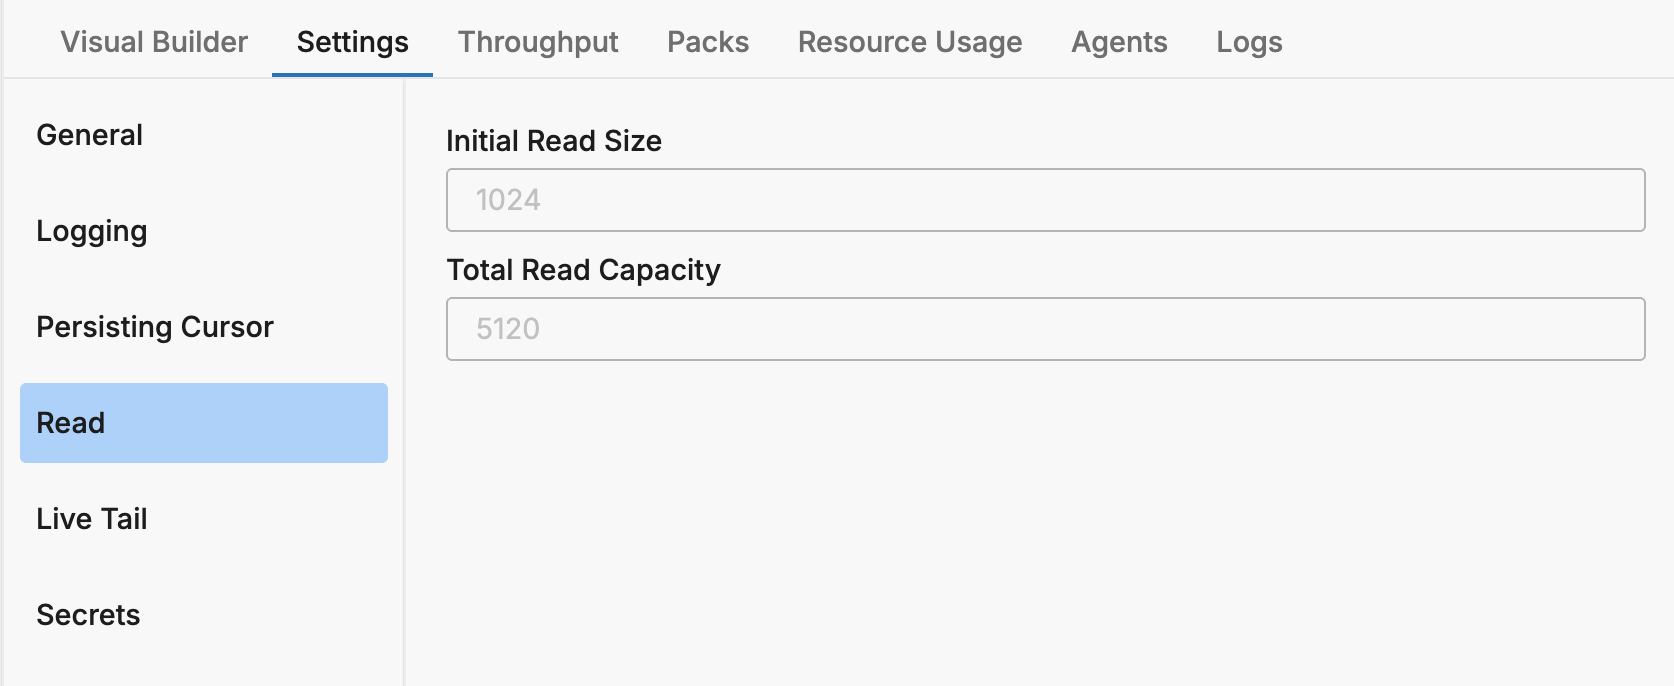
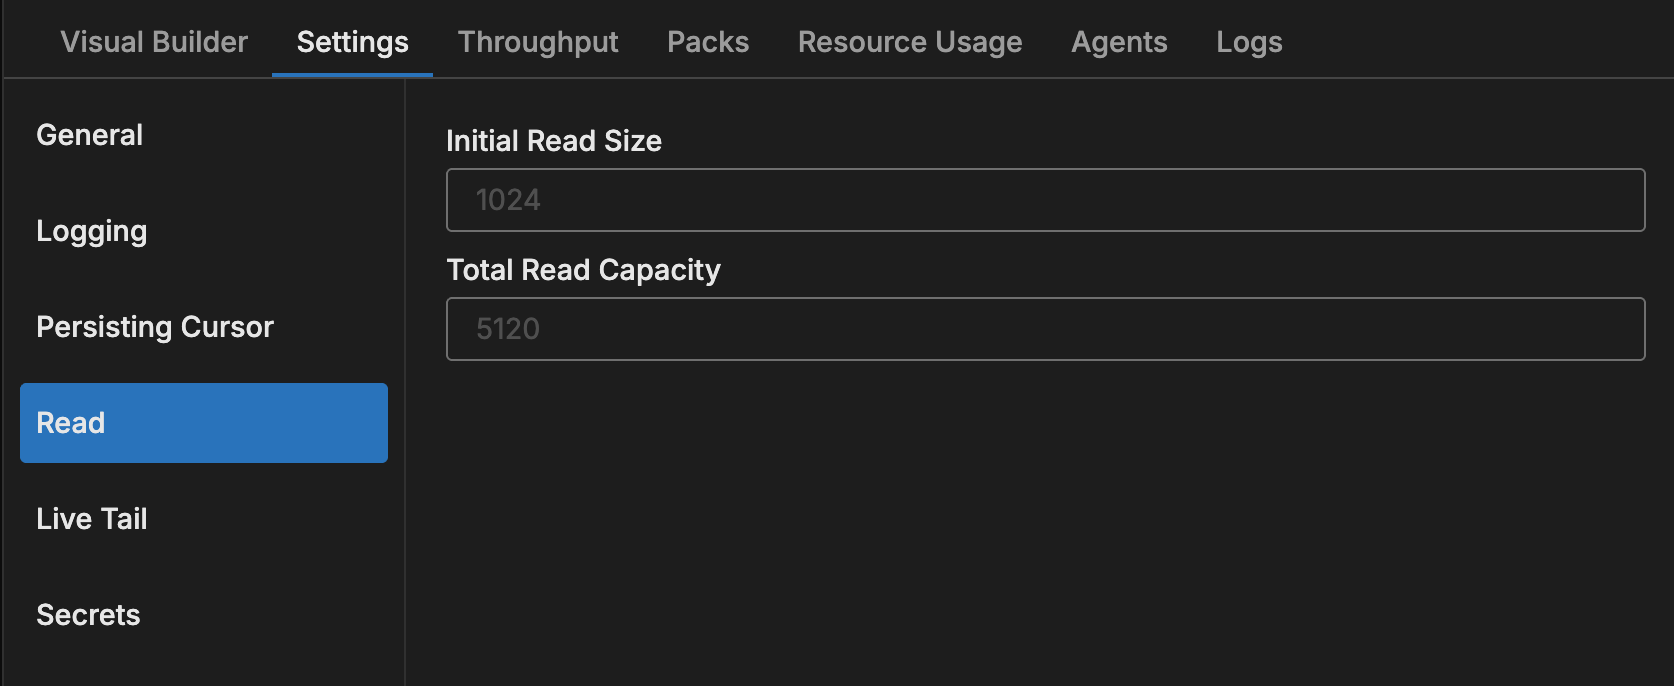
Controls buffer sizes for reading data.
| Setting | Description | Default |
|---|---|---|
| Initial Read Size | Initial buffer size for reading data | 1024 bytes |
| Total Read Capacity | Total read buffer capacity | 5120 bytes |
Live Tail
Minimum Agent Version: v2.11.0
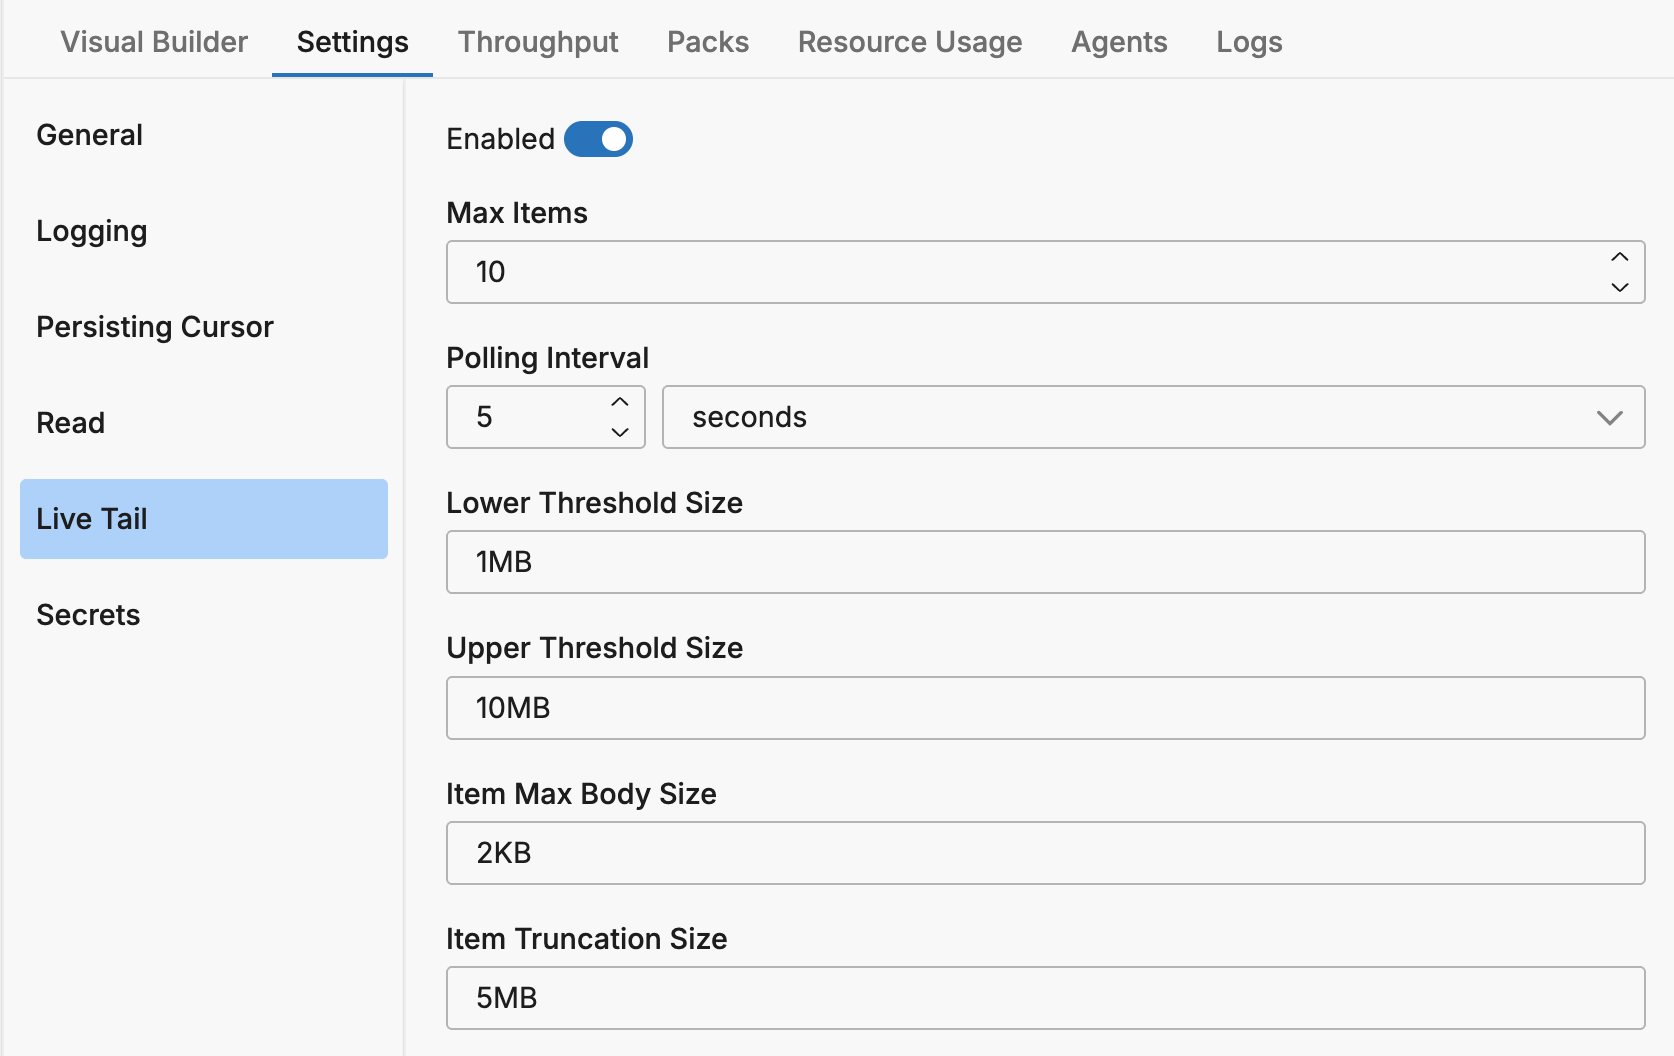
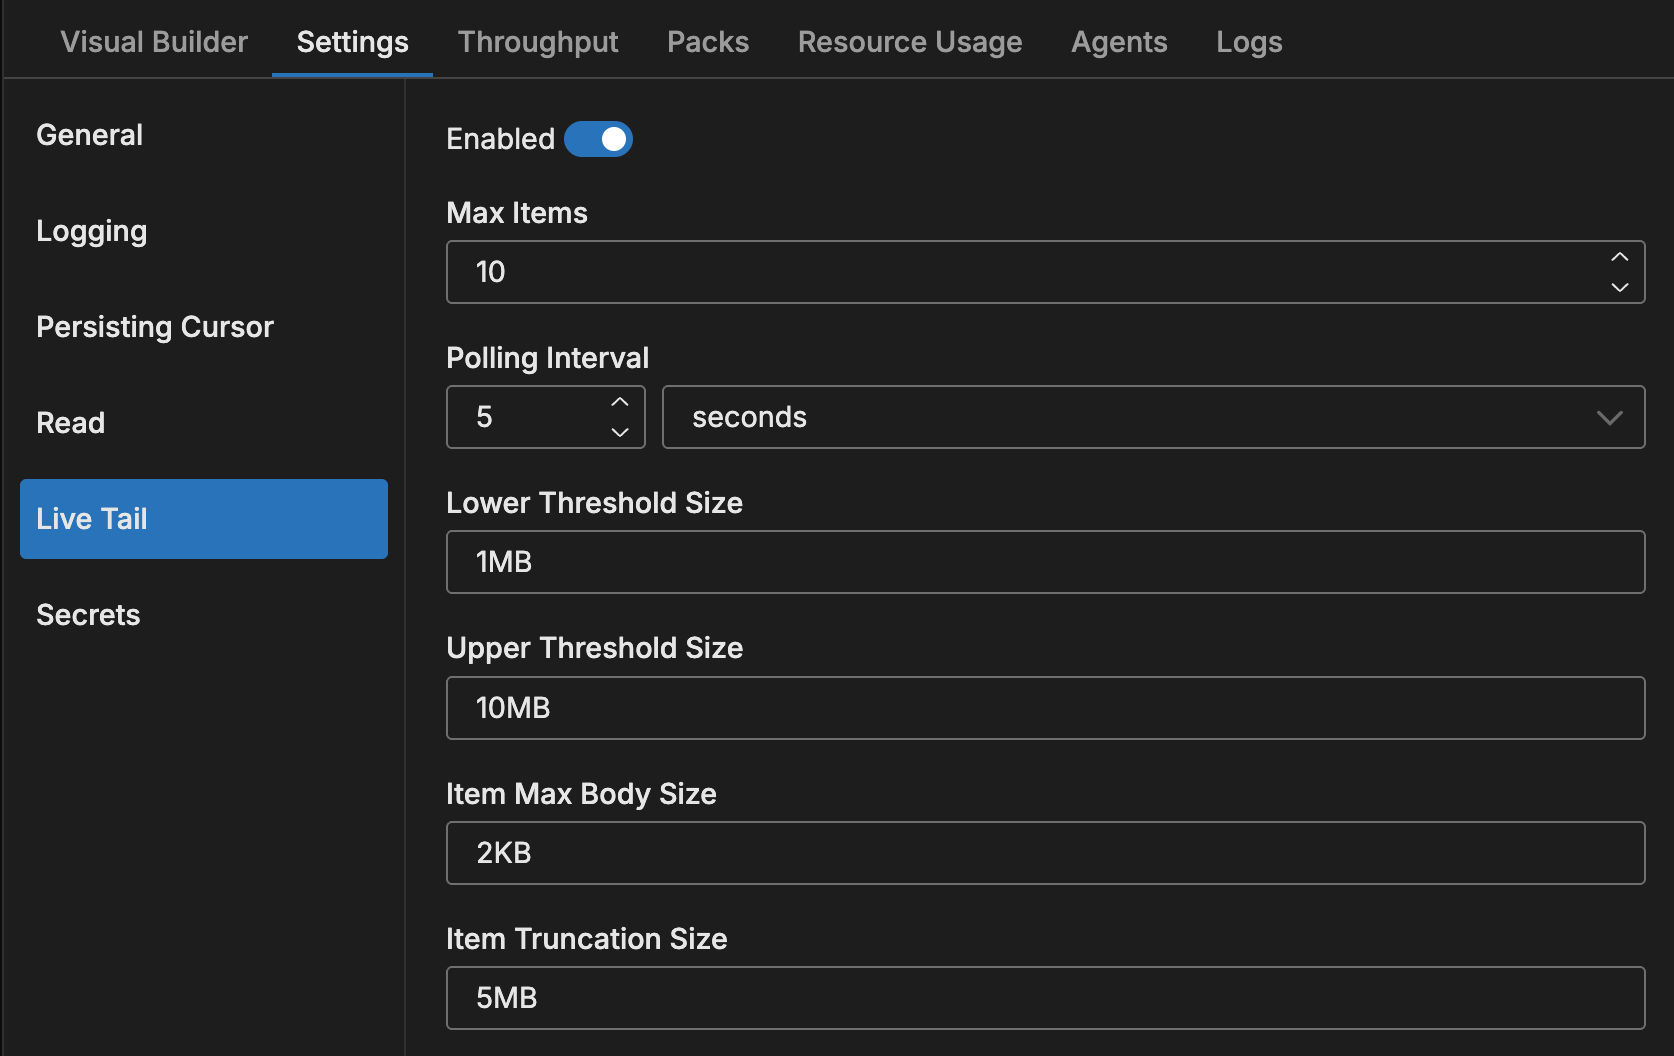
These settings control the Live Capture feature, which enables in-stream debugging during pipeline design and testing. Previously, these settings were only configurable via environment variables. Starting with v2.11.0, they can be configured directly in the pipeline settings.
| Setting | Description | Default | Environment Variable |
|---|---|---|---|
| Enabled | Enable or disable the live capture feature | true | ED_DISABLE_LIVE_CAPTURE |
| Max Items | Maximum number of items to capture | - | - |
| Polling Interval | How often the agent polls for capture tasks | - | - |
| Item Max Body Size | Maximum size of the body field in captured items before truncation | - | ED_CAPTURER_ITEM_MAX_BODY_SIZE |
| Item Truncation Size | Size threshold that triggers item truncation | - | ED_CAPTURER_ITEM_TRUNCATION_SIZE |
| Retention | Duration after which captured logs automatically expire. When not set, logs have no expiration until new writes trigger cleanup. | - | - |
Configuration Precedence:
Settings are applied in the following order of priority (highest to lowest):
- Pipeline settings (configured in the Settings tab)
- Environment variables (set during deployment)
- Default values
This means pipeline settings always take precedence over environment variables, allowing you to centrally manage these configurations while environment variables serve as fallback defaults.
Use Cases:
- Production environments: Disable live capture to save 15-20% memory overhead
- Large payloads: Configure truncation sizes to prevent UI freezing
- Stale data in live tail: Without a retention period, captured logs remain until new writes trigger cleanup. If no new data arrives, previously captured logs continue to appear. Set a Retention duration to automatically expire old entries, or test against an active source (real or synthetic) to ensure fresh data flows through the pipeline
For more information about live capture and its resource impact, see Live Capture and In-Stream Debugging.
Secrets
The Secrets section allows you to securely store sensitive credentials (such as API keys, passwords, and access tokens) at the pipeline level. Secrets are encrypted at rest and can be referenced in source and destination configurations using the '{{ SECRET secret-name }}' syntax.
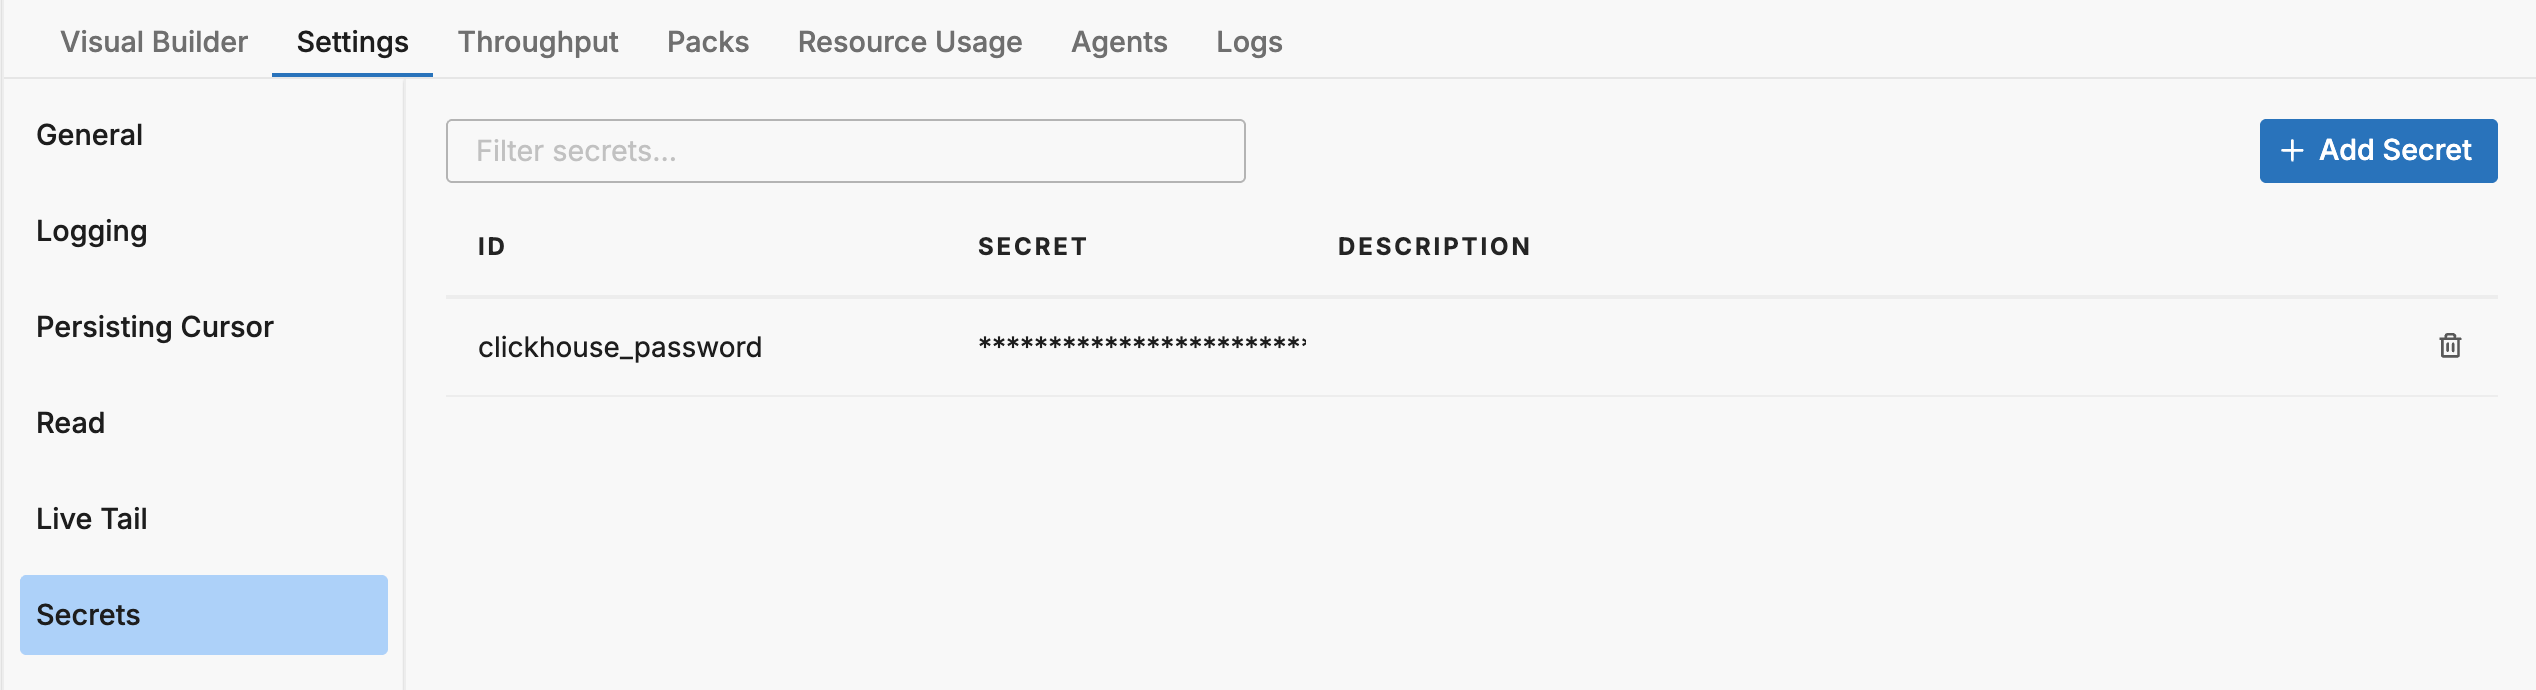
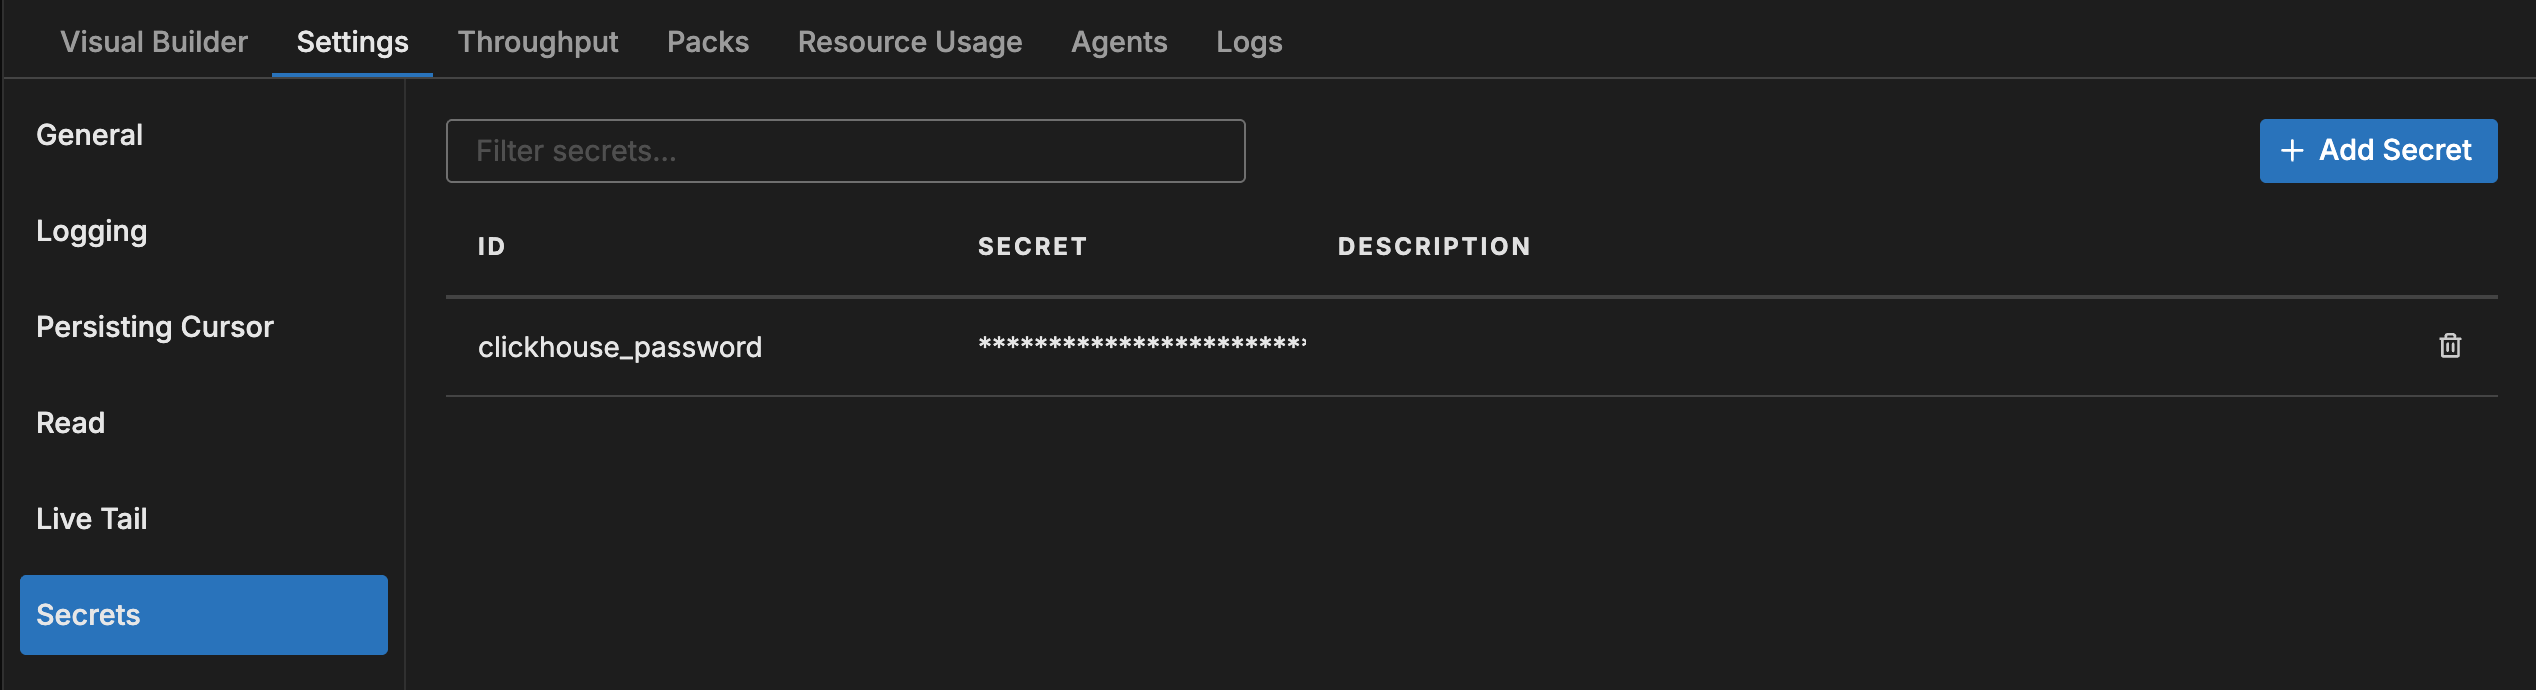
The secrets table displays existing secrets with the following columns:
| Column | Description |
|---|---|
| ID | The unique identifier used to reference the secret in configurations |
| Secret | The redacted secret value (never displayed in full) |
| Description | A description of the secret’s purpose |
Click Add Secret to create a new secret.
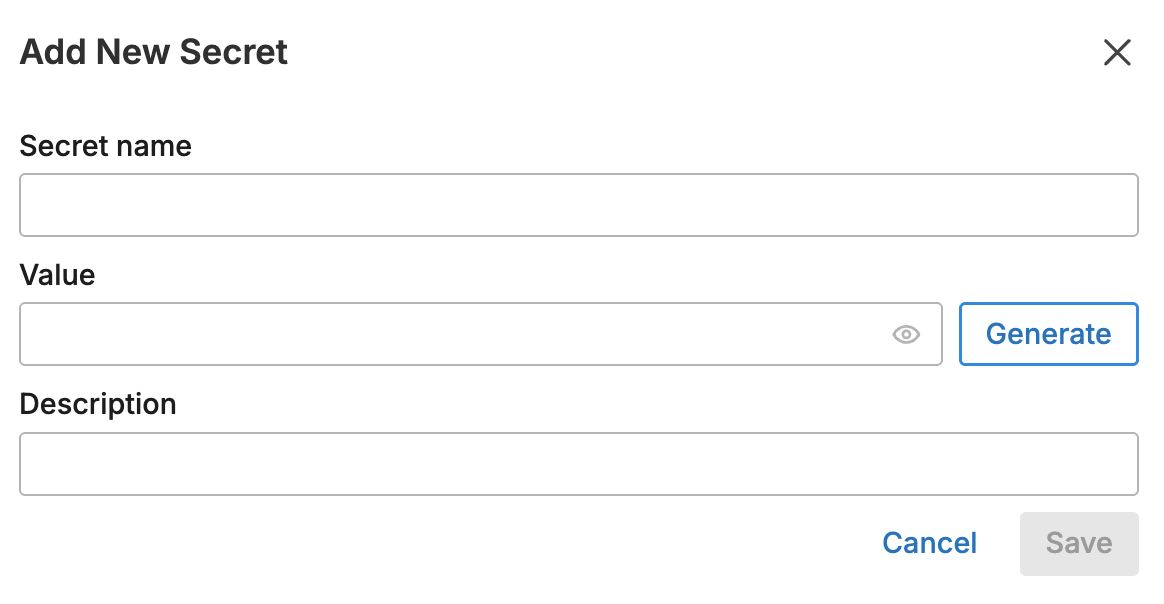
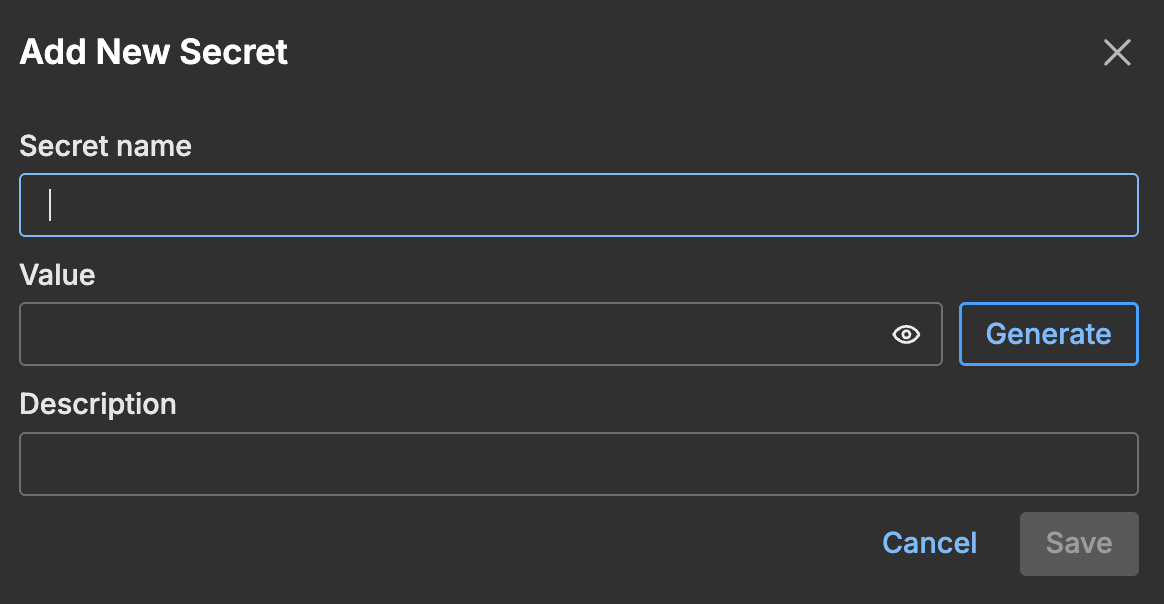
For detailed instructions on creating and using secrets, see Secrets.
Throughput
The Throughput tab on the Pipeline view shows the traffic statistics for that particular pipeline only. Similarly to the Pipelines overview page you can view Bytes in and out as well as Events in and out.
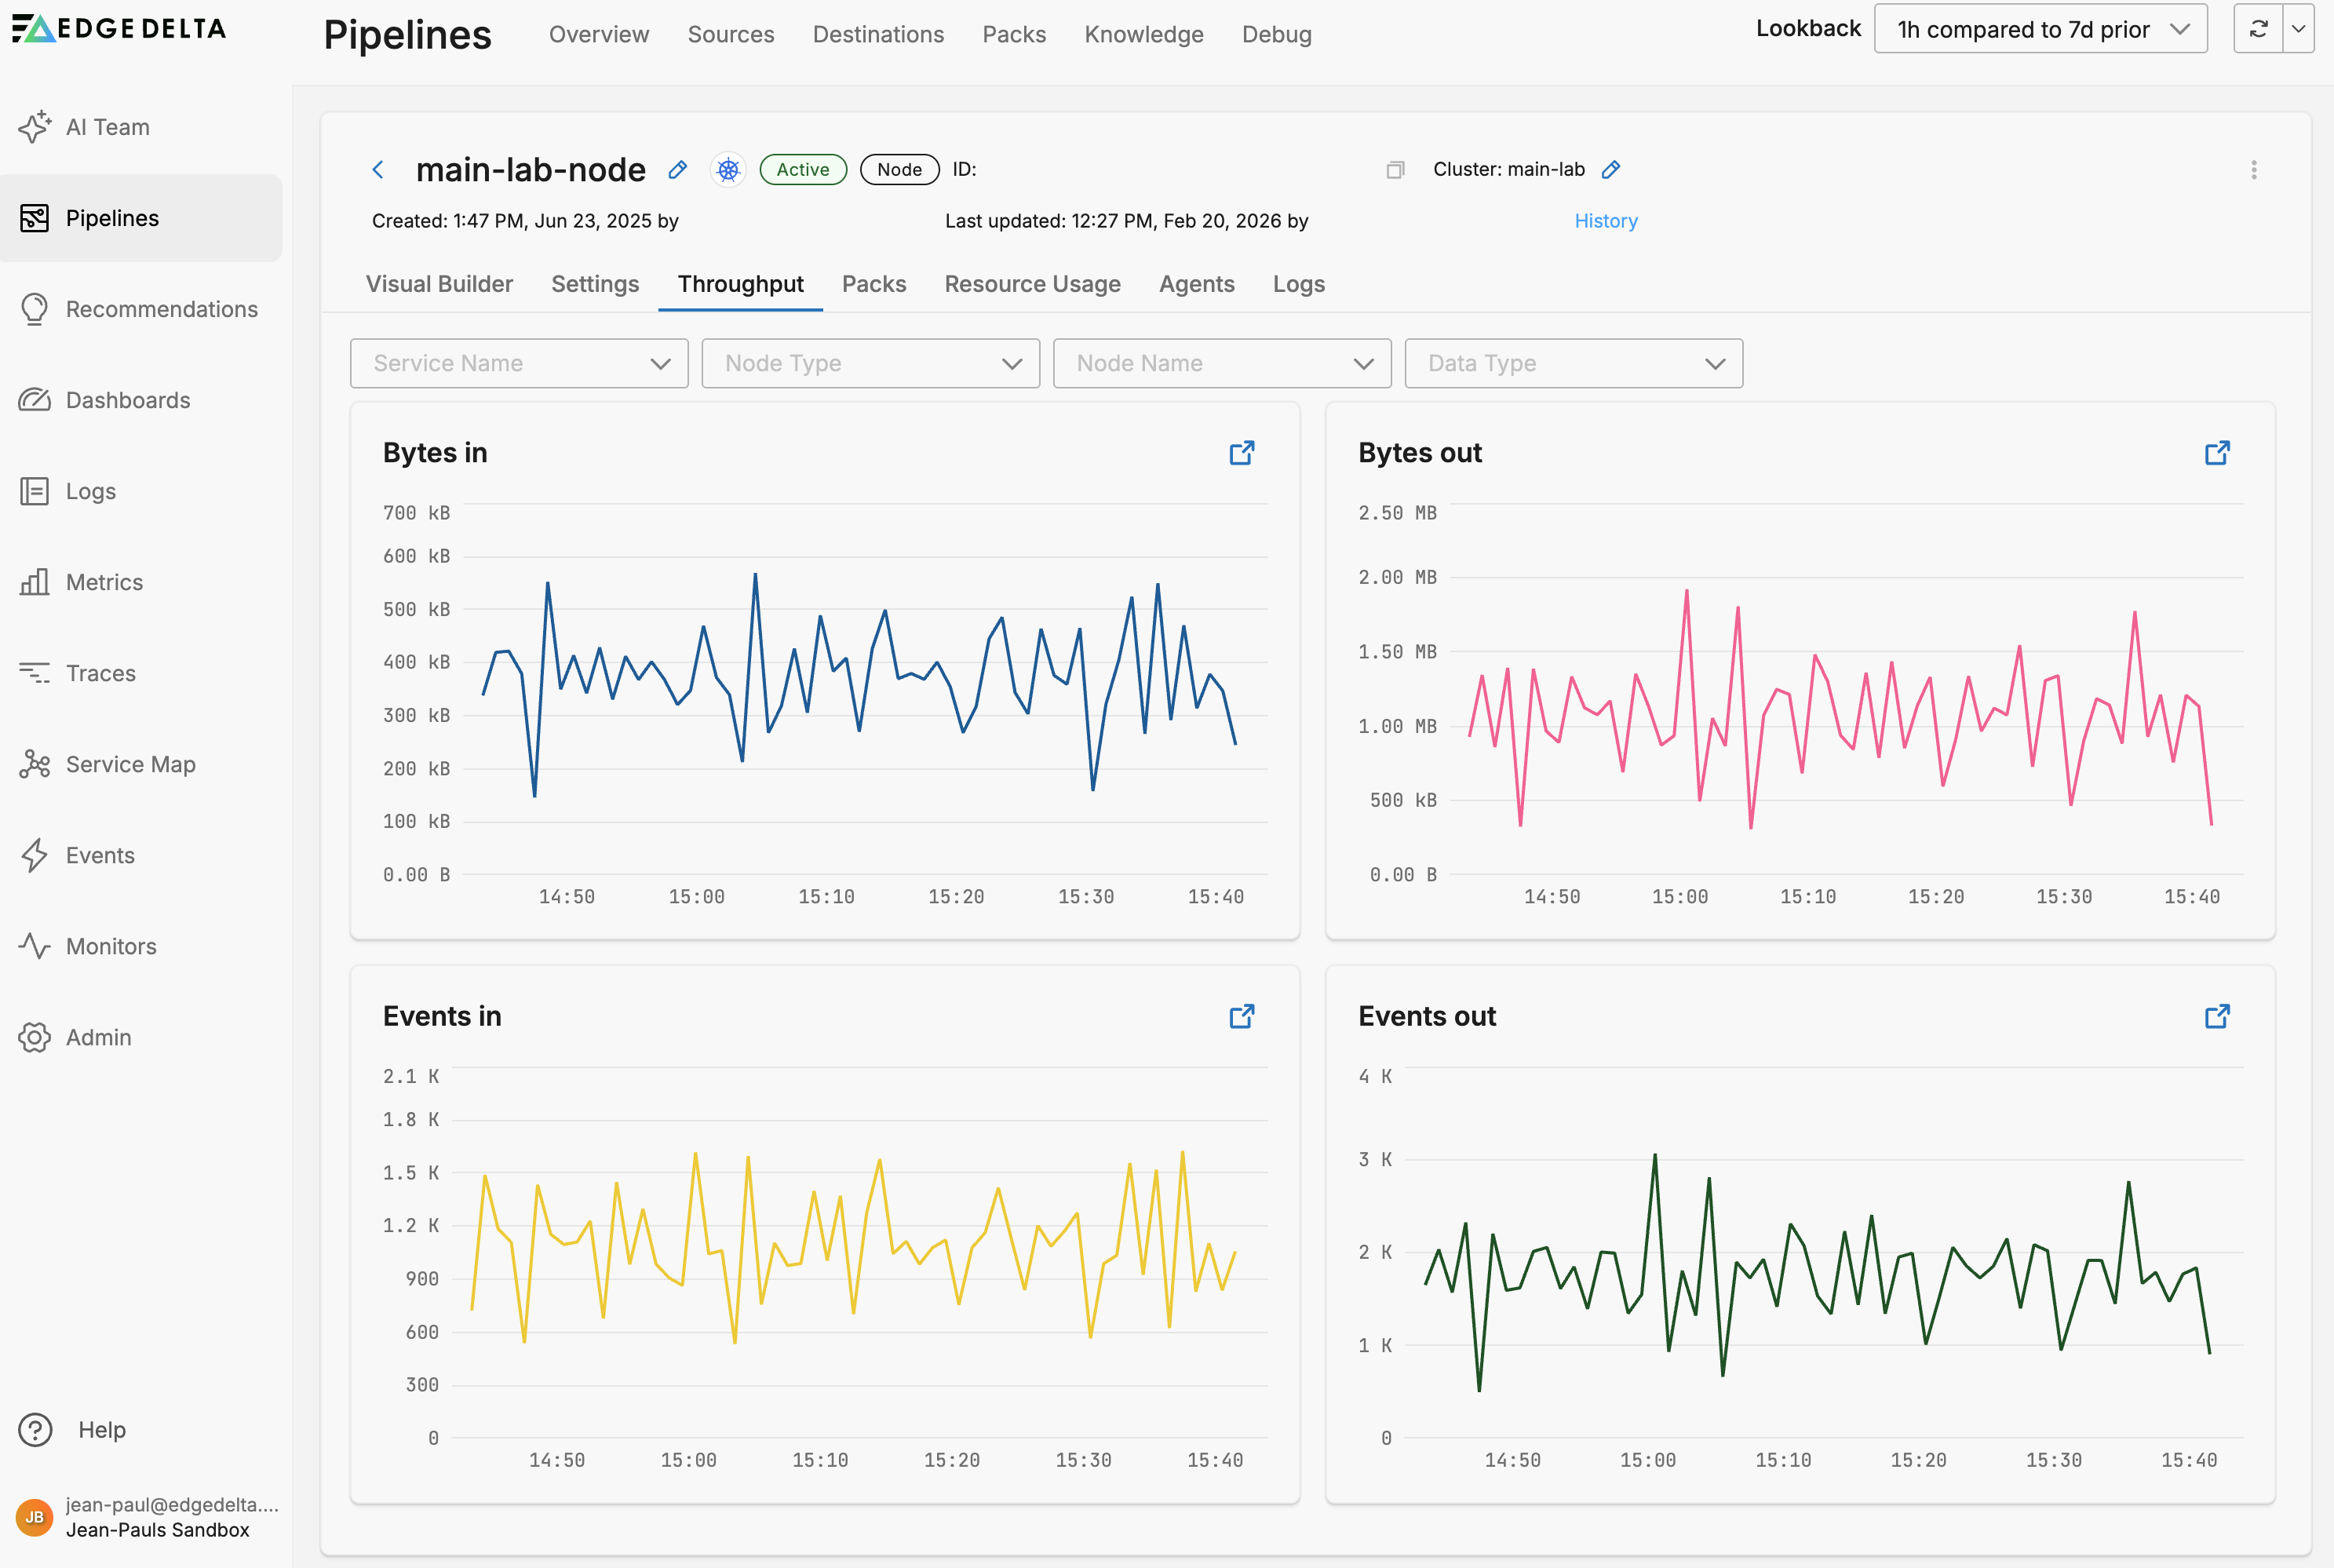
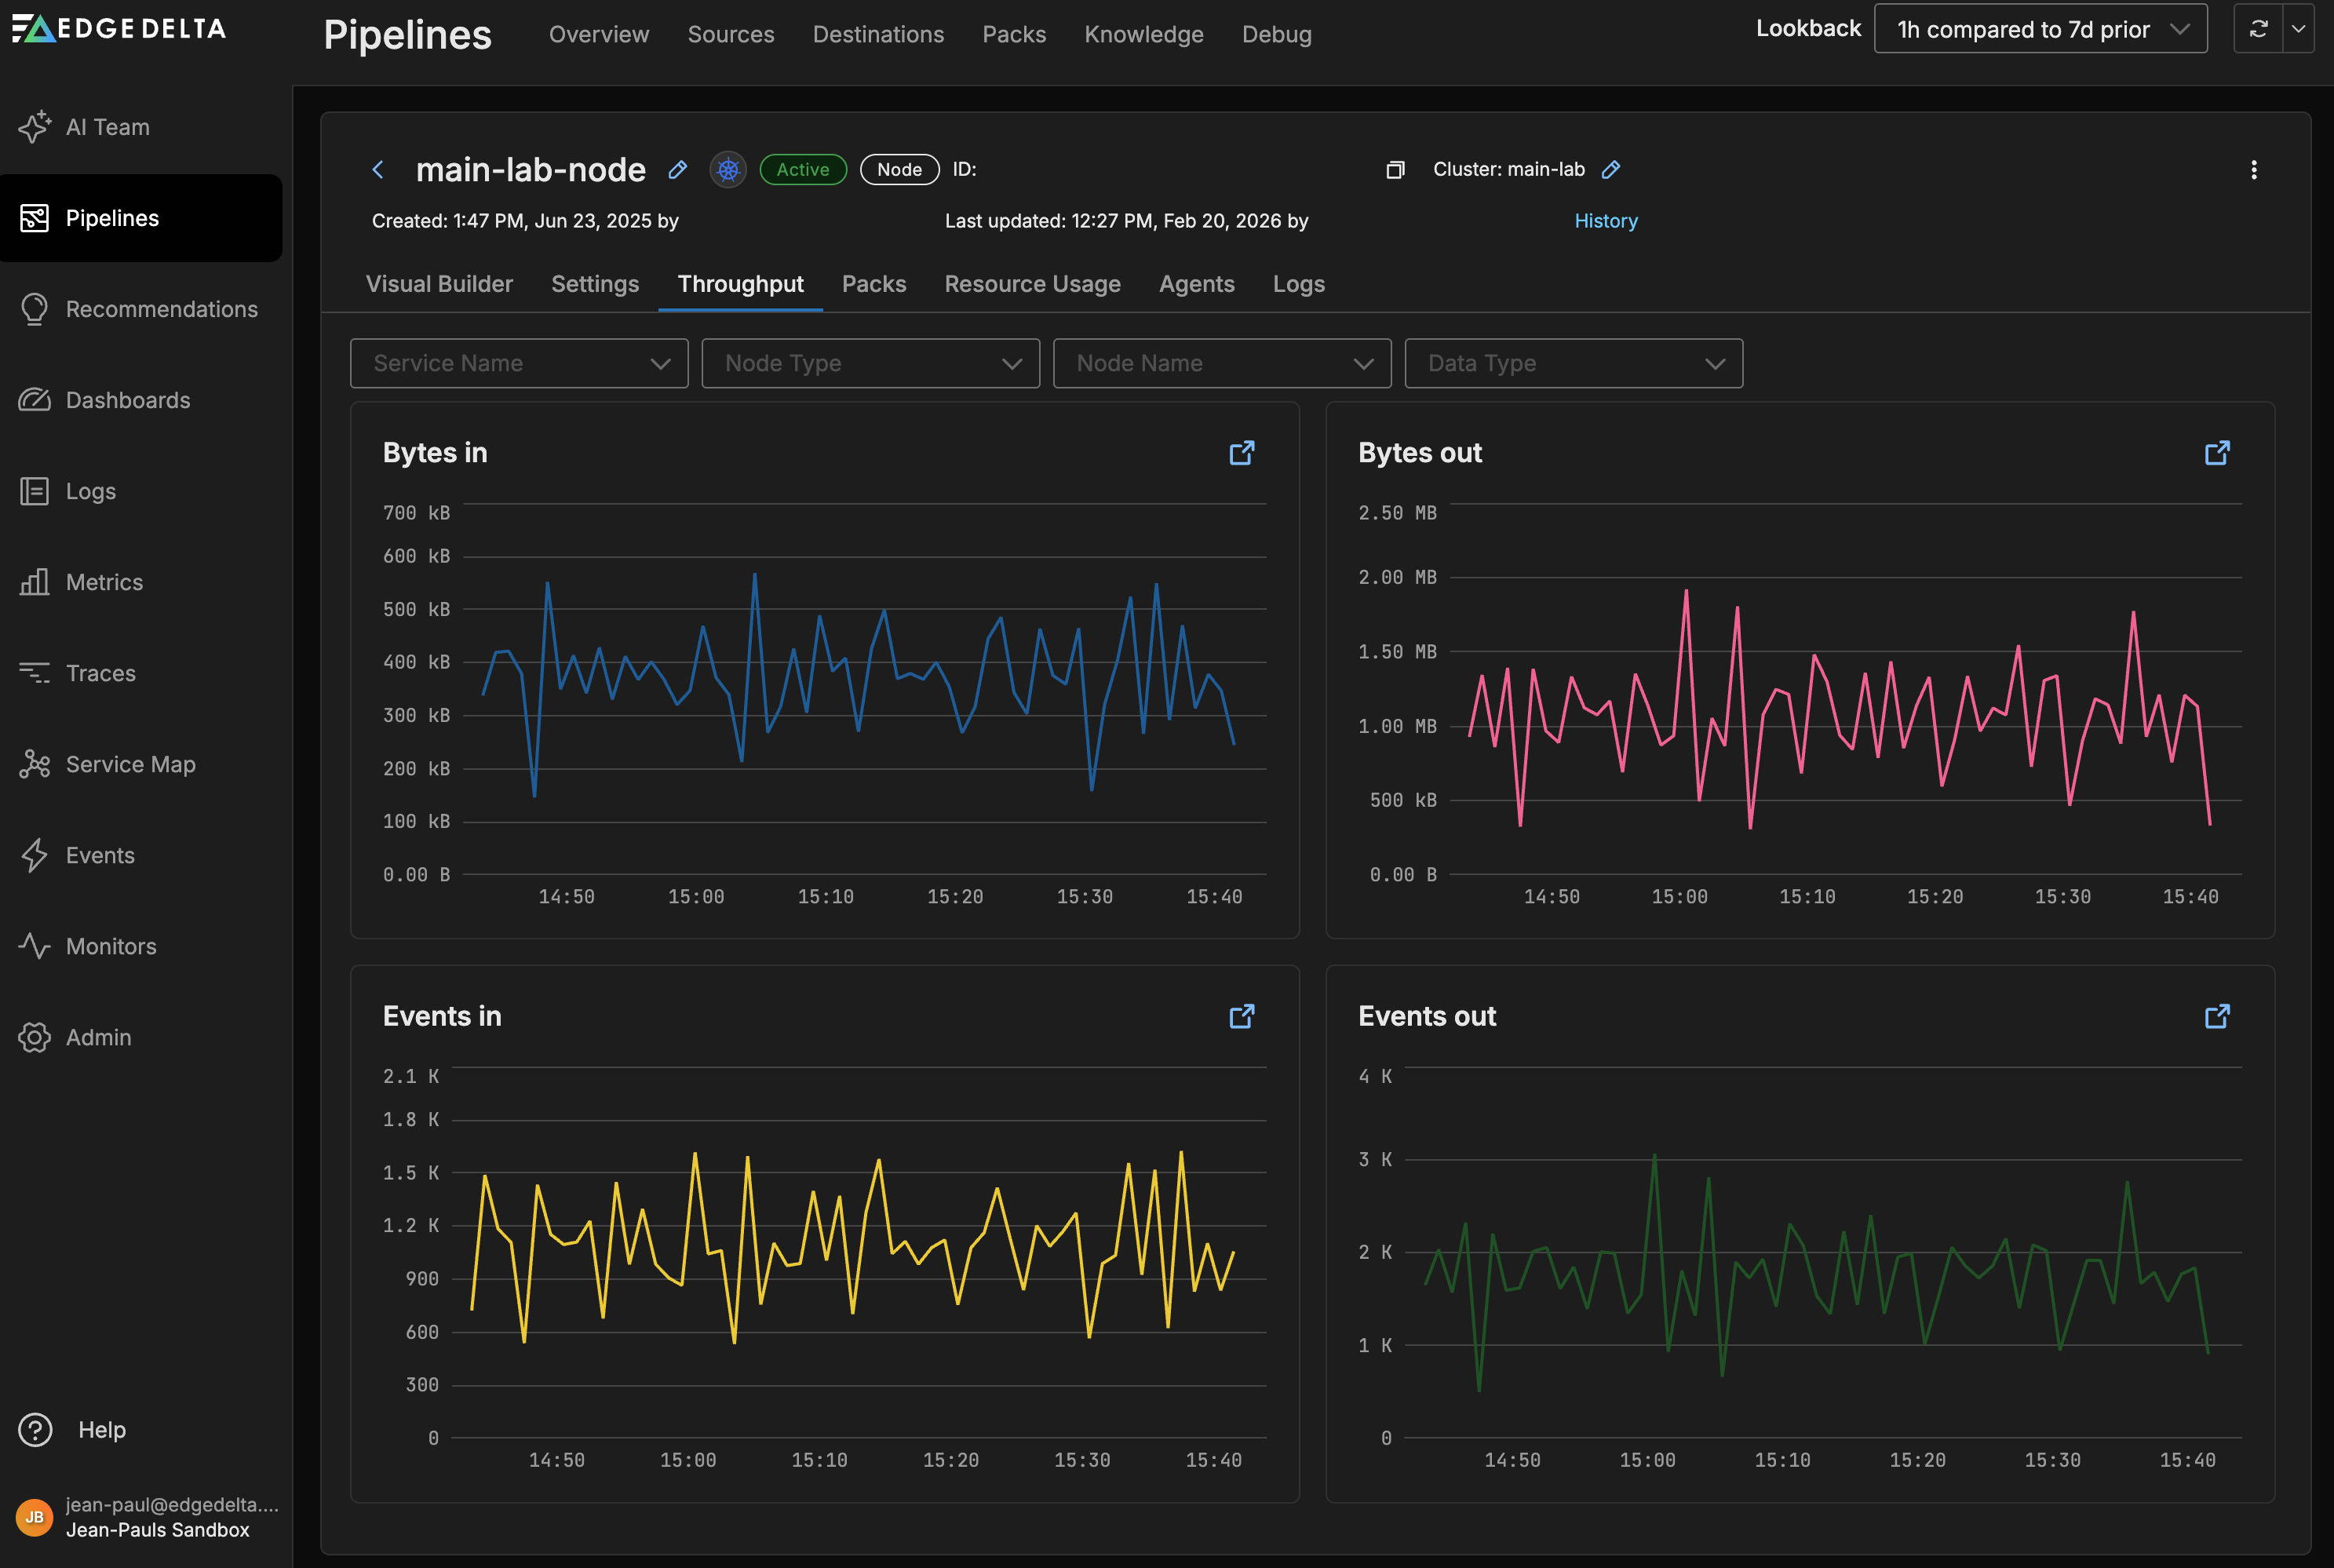
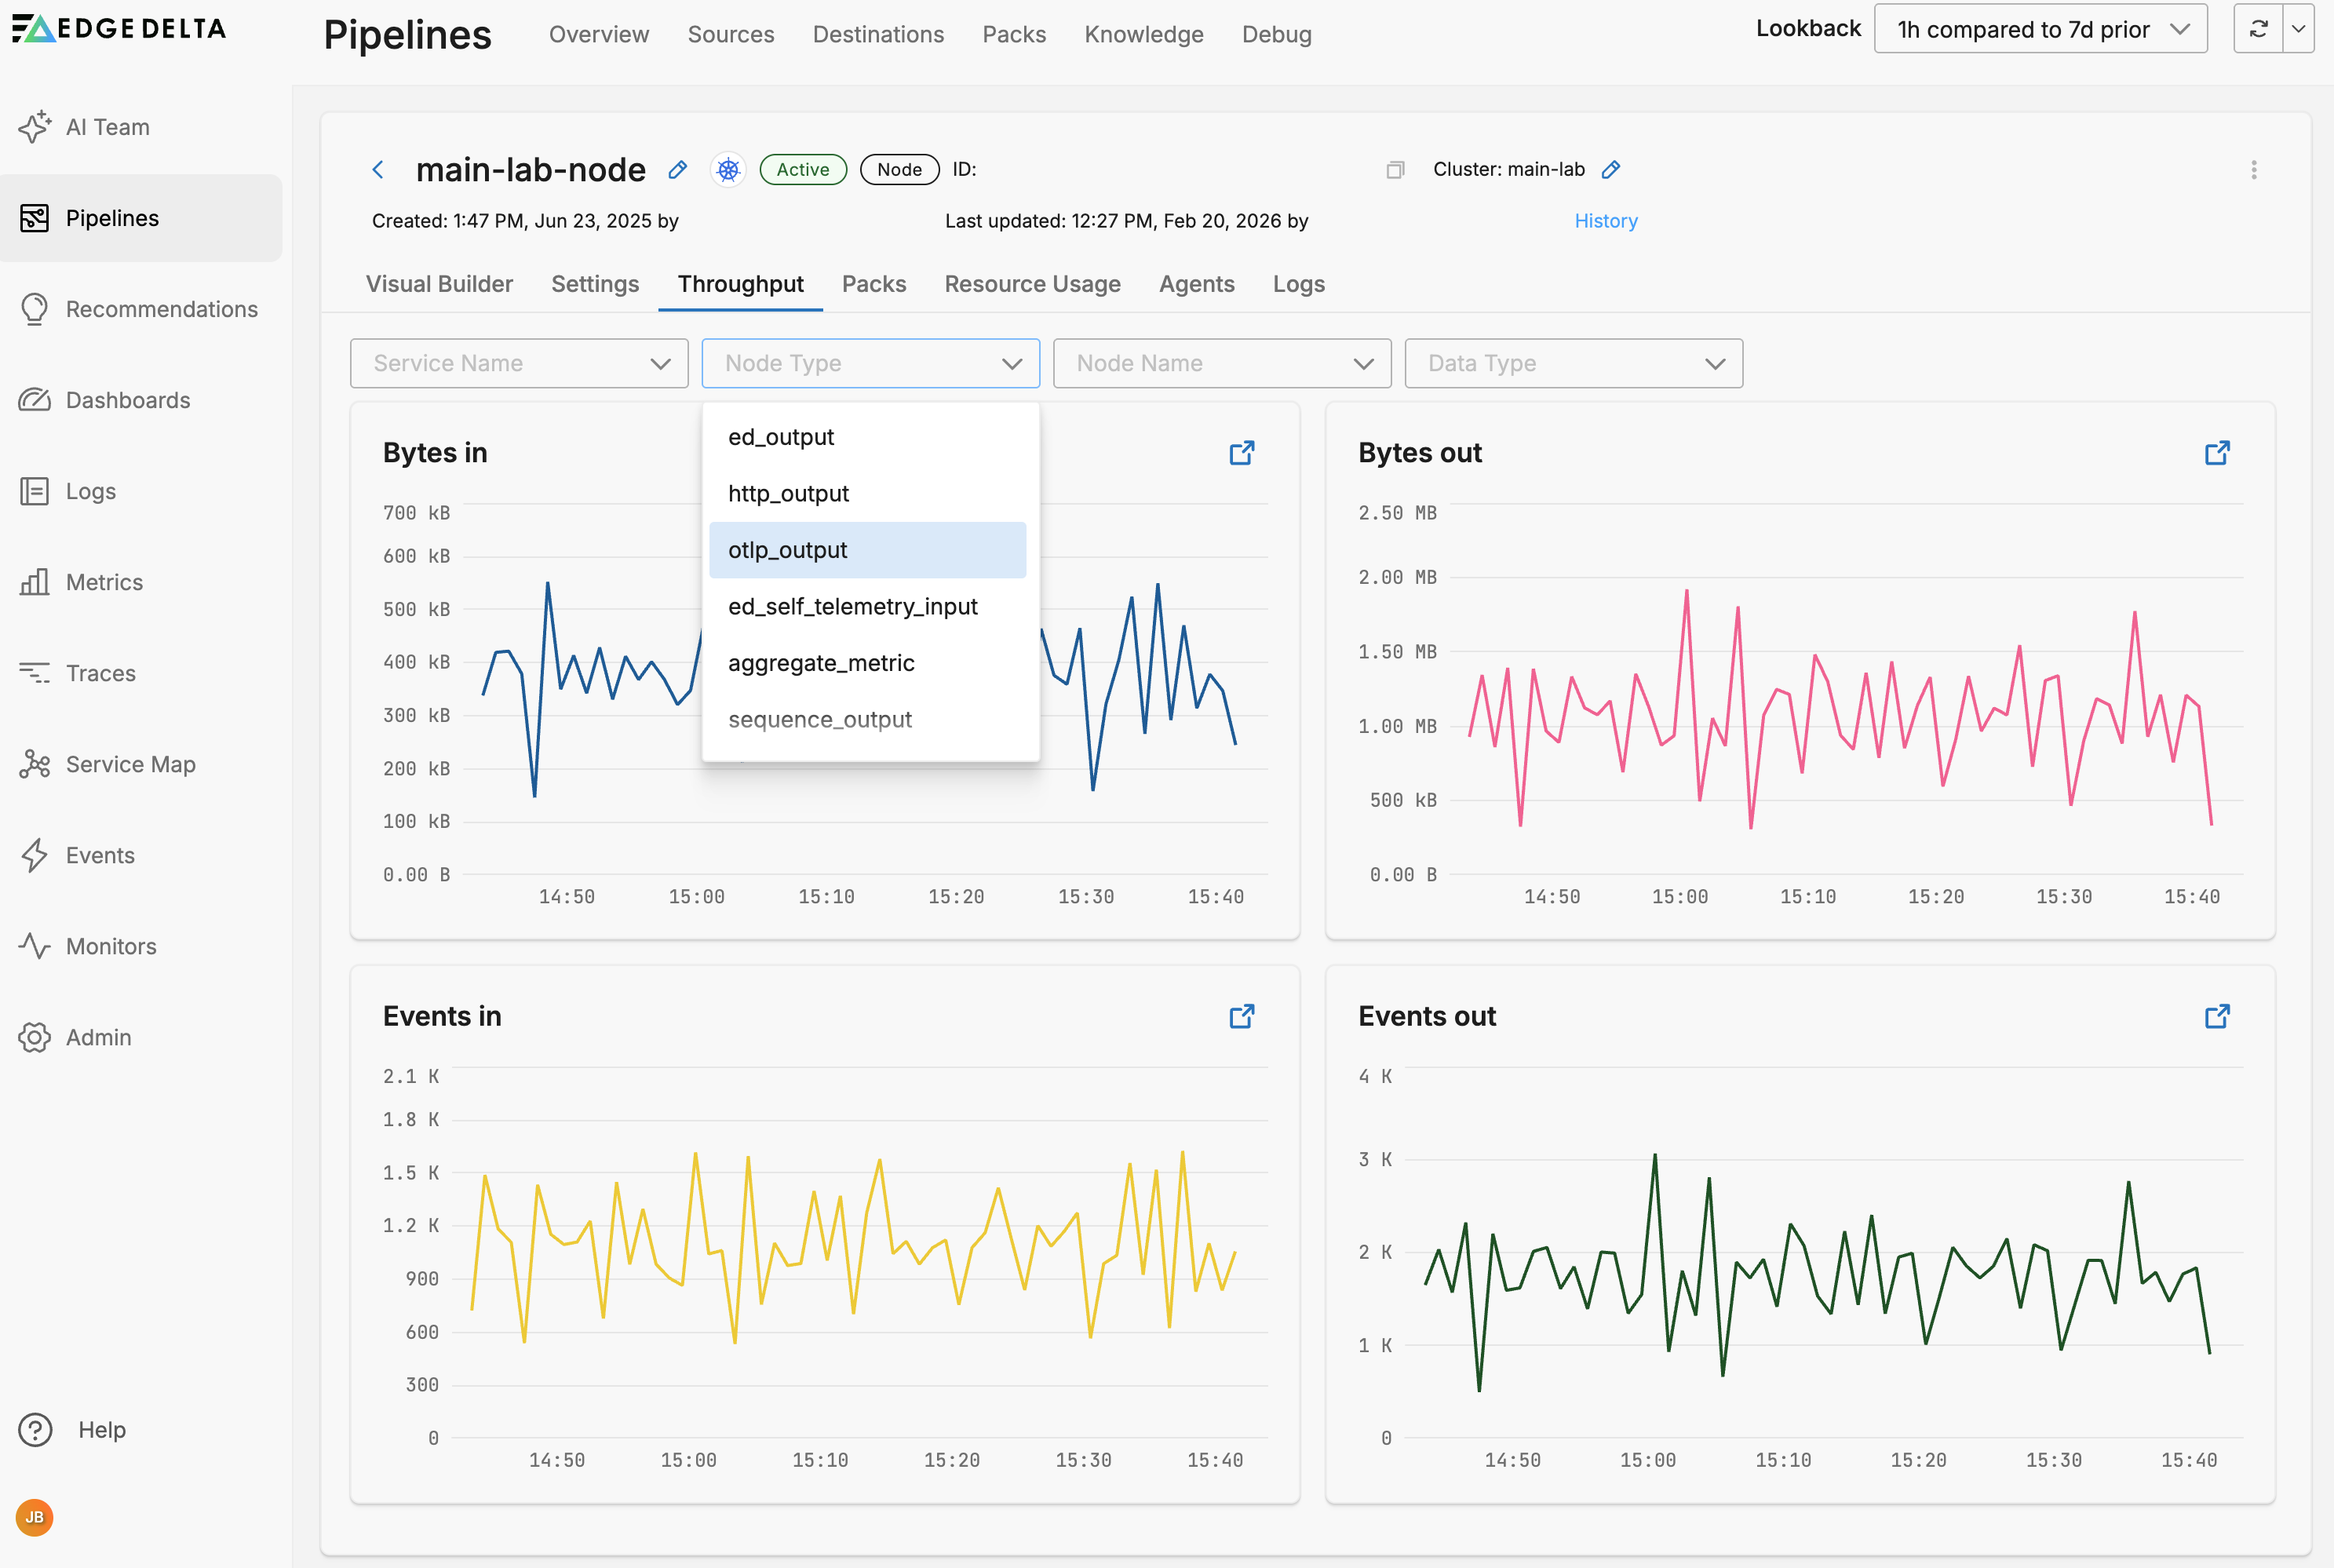
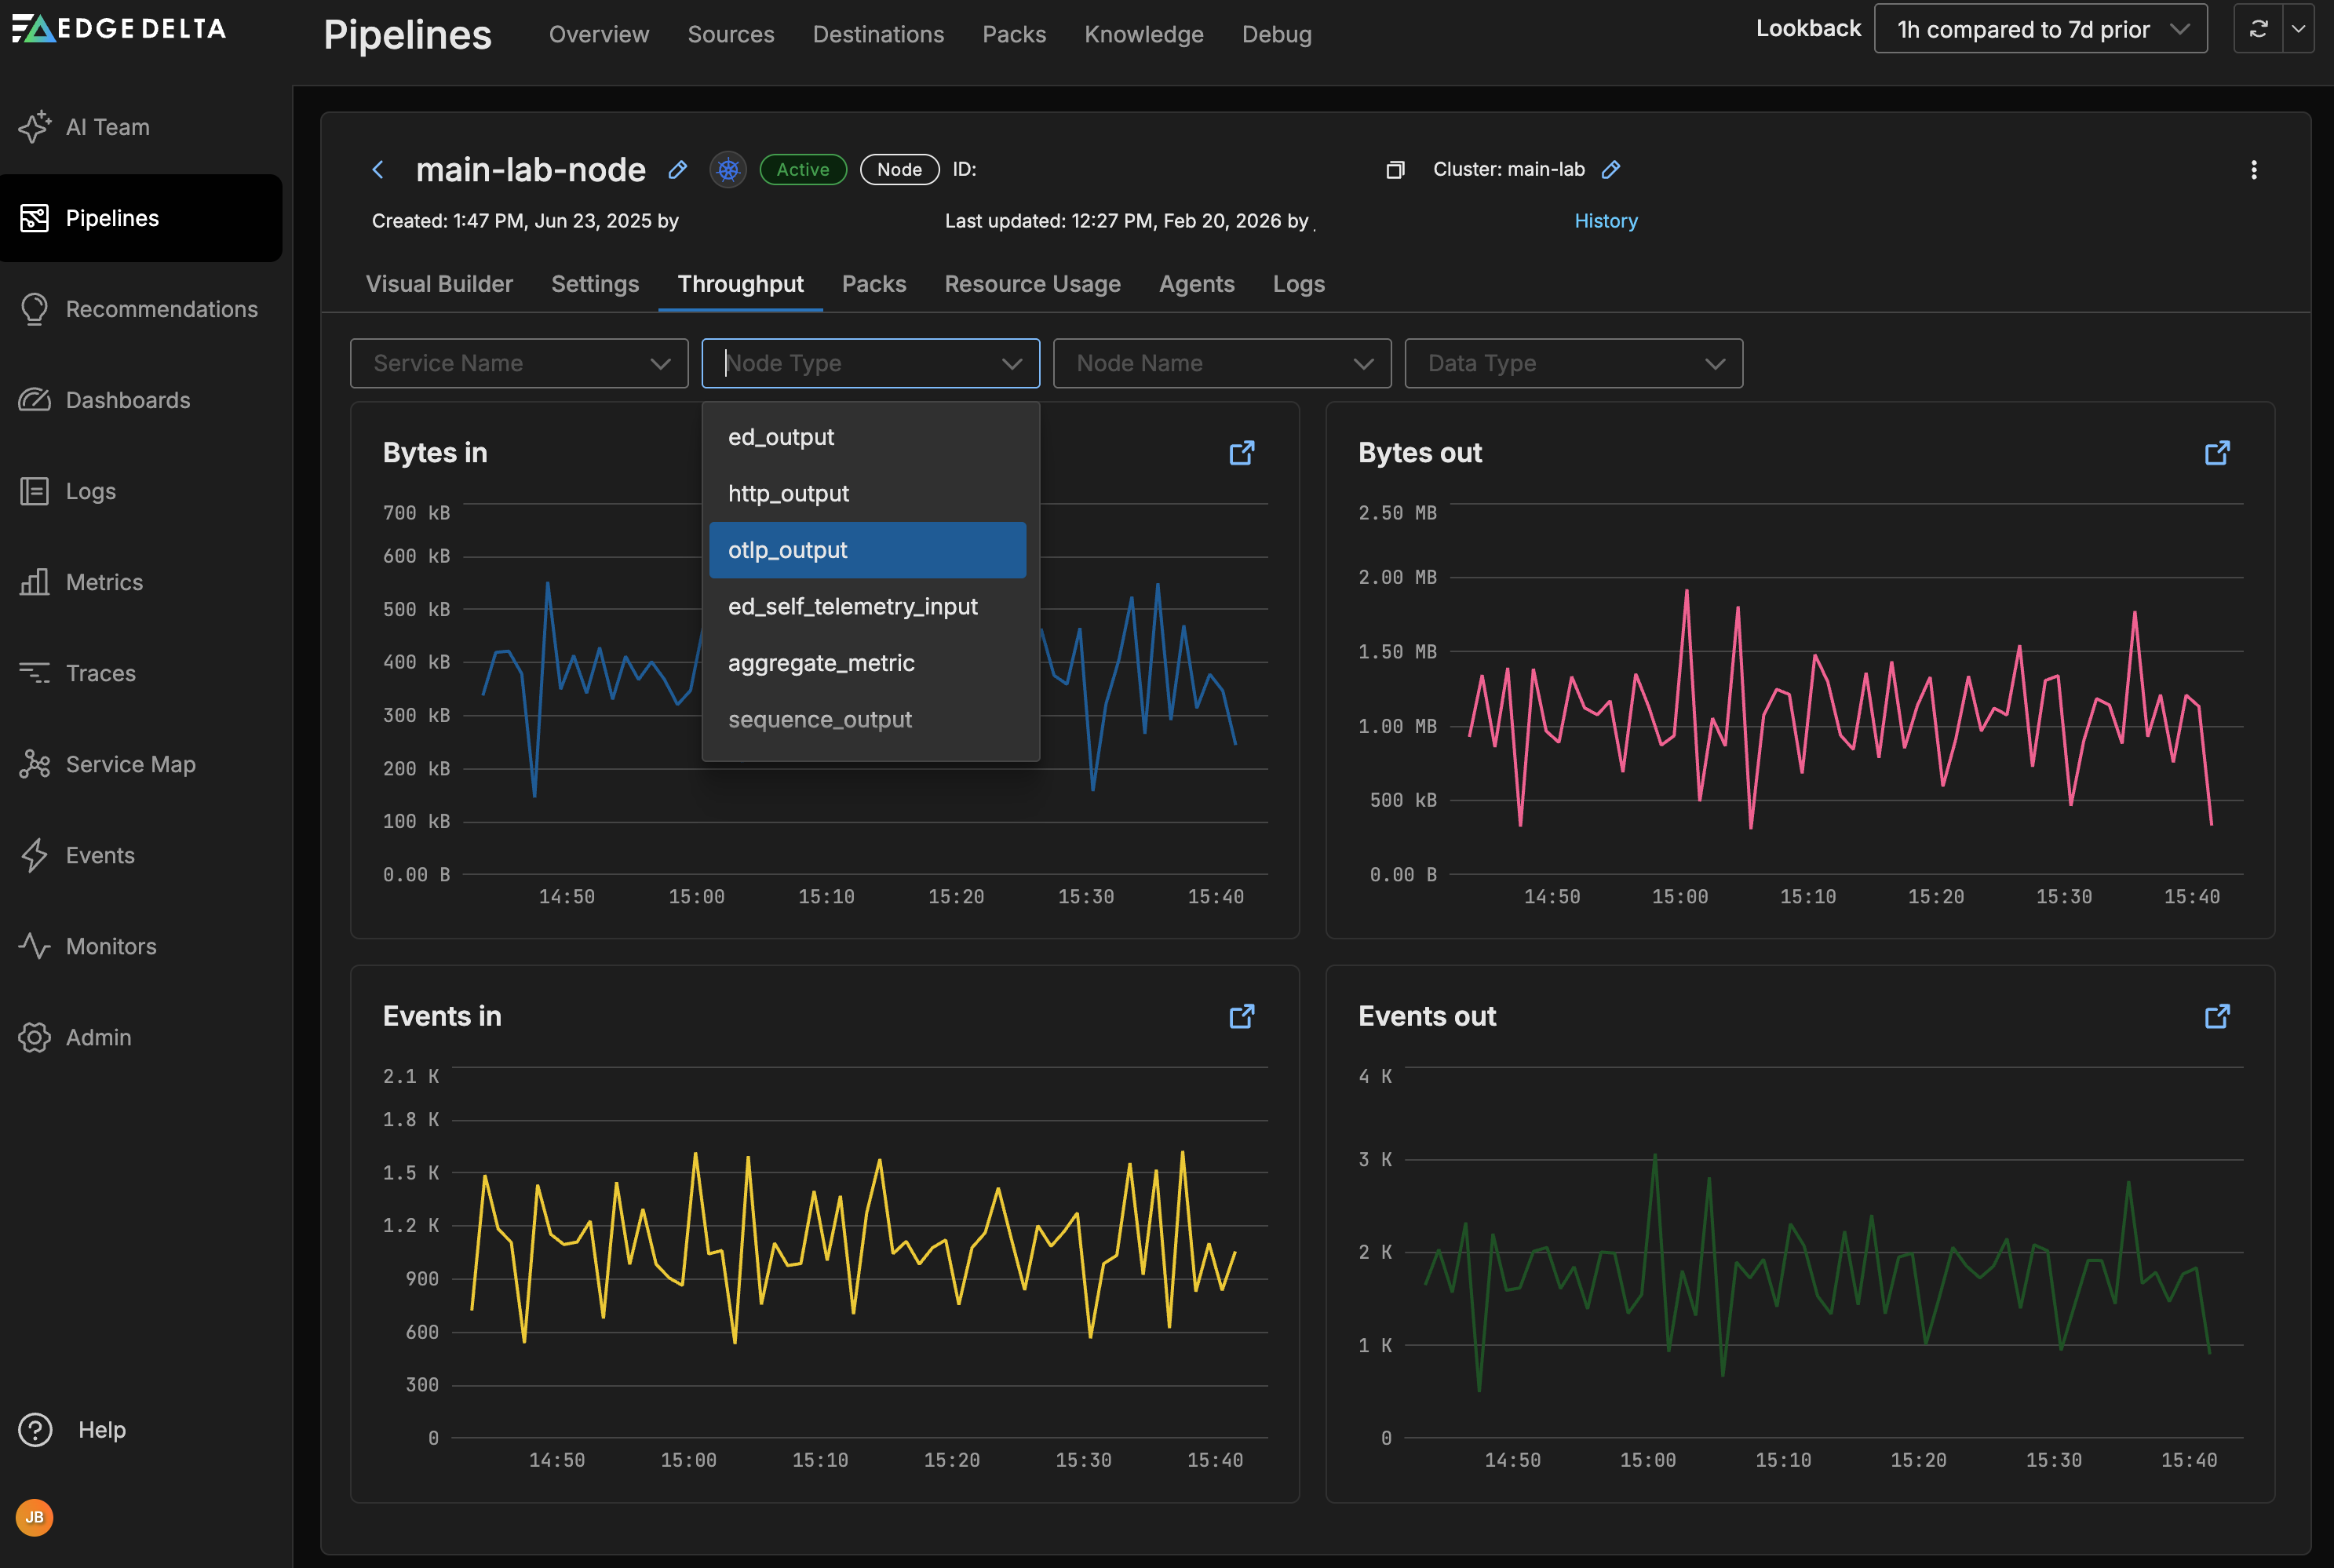
You can filter the graphs by service, node type and name or data type:
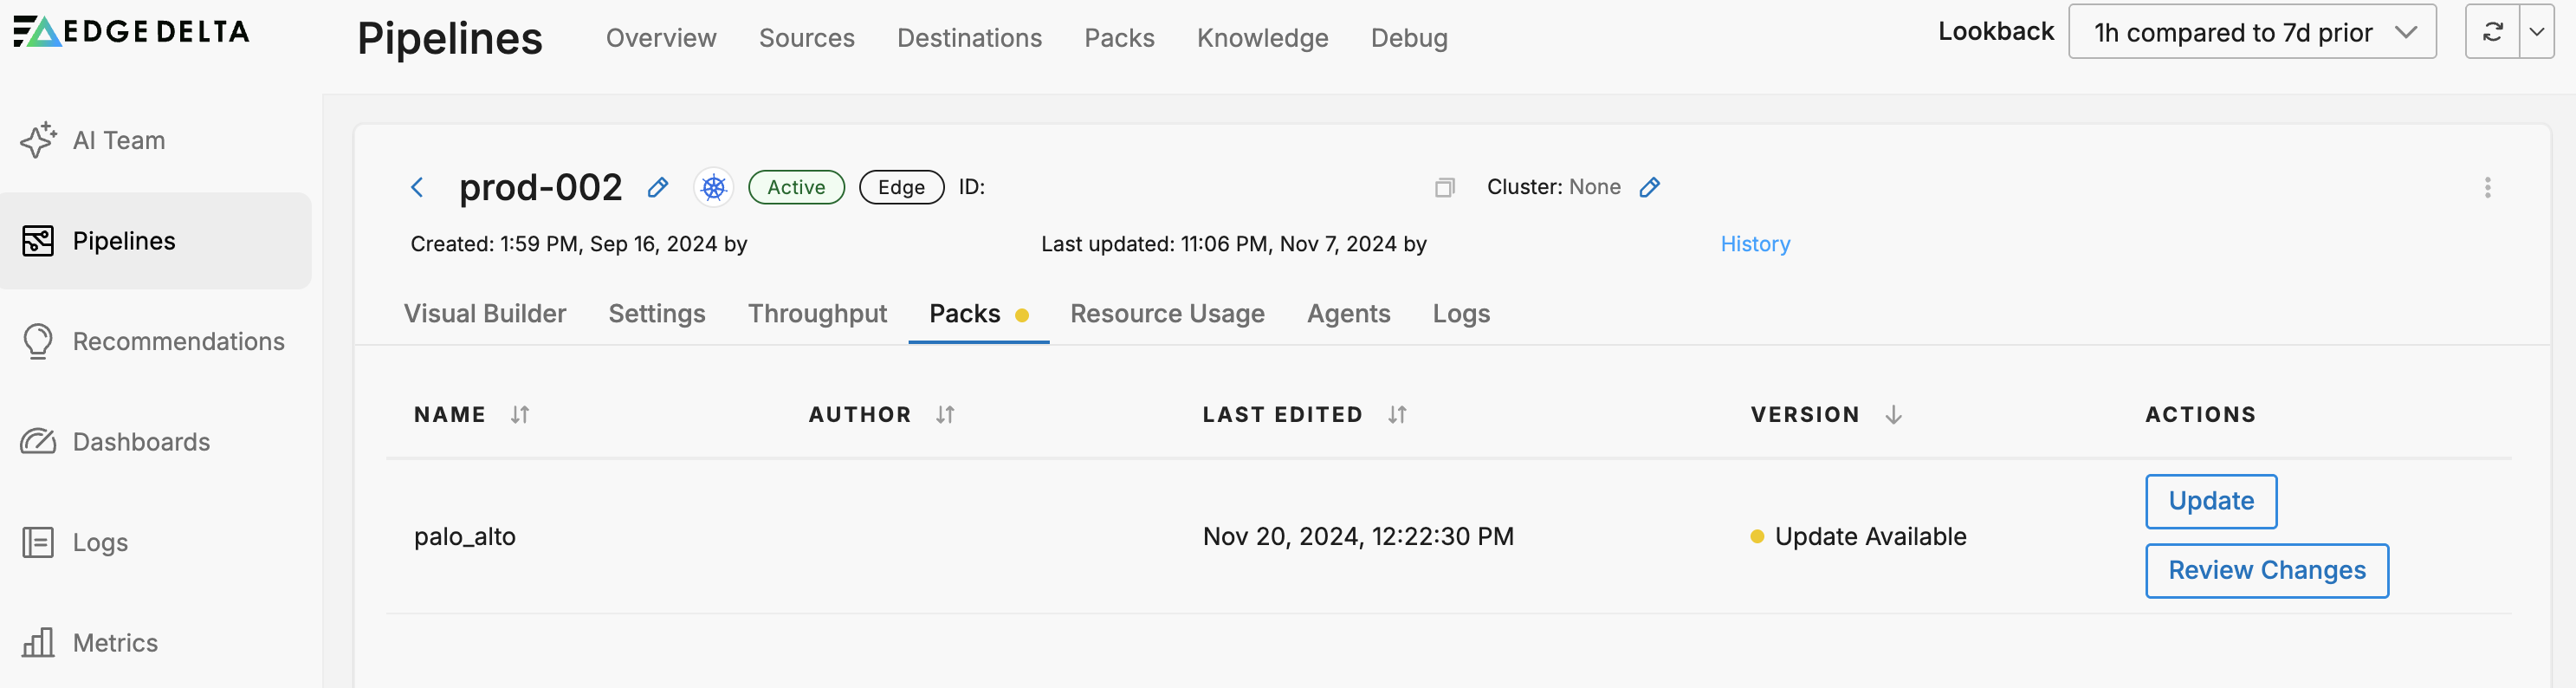
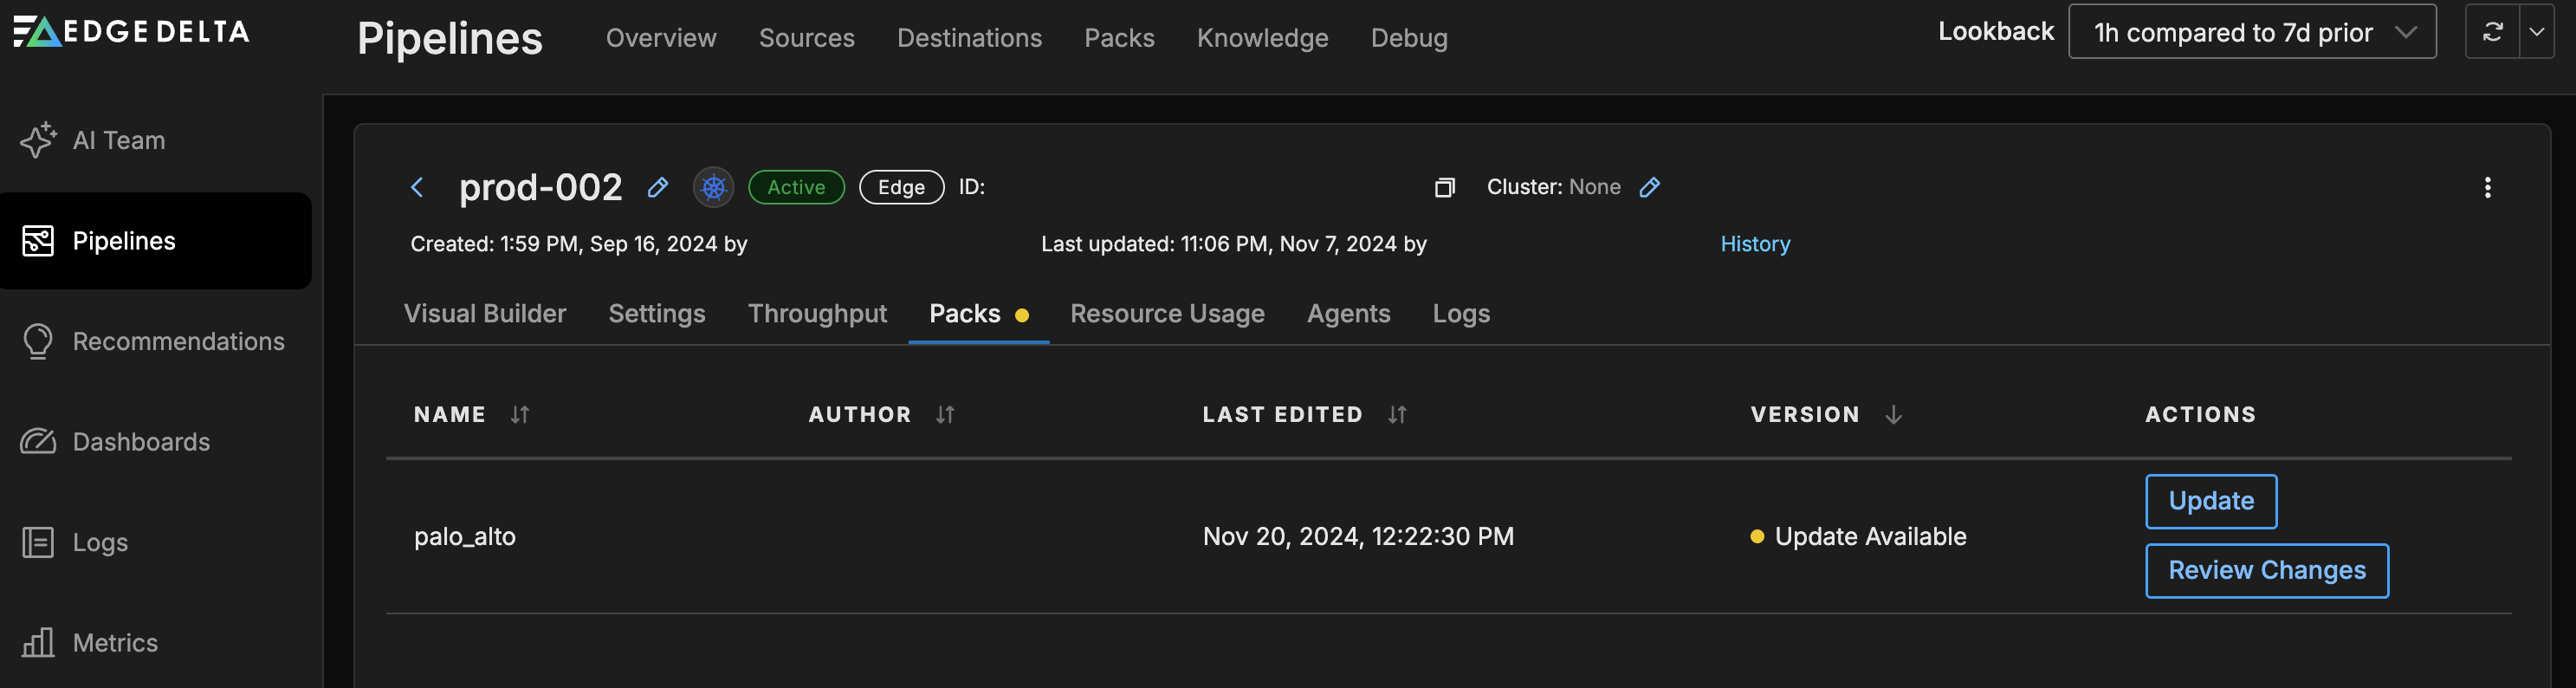
Packs
If any packs are used in your pipeline they are listed on the Packs tab. Here you can determine if they are up to date with the latest pack version.
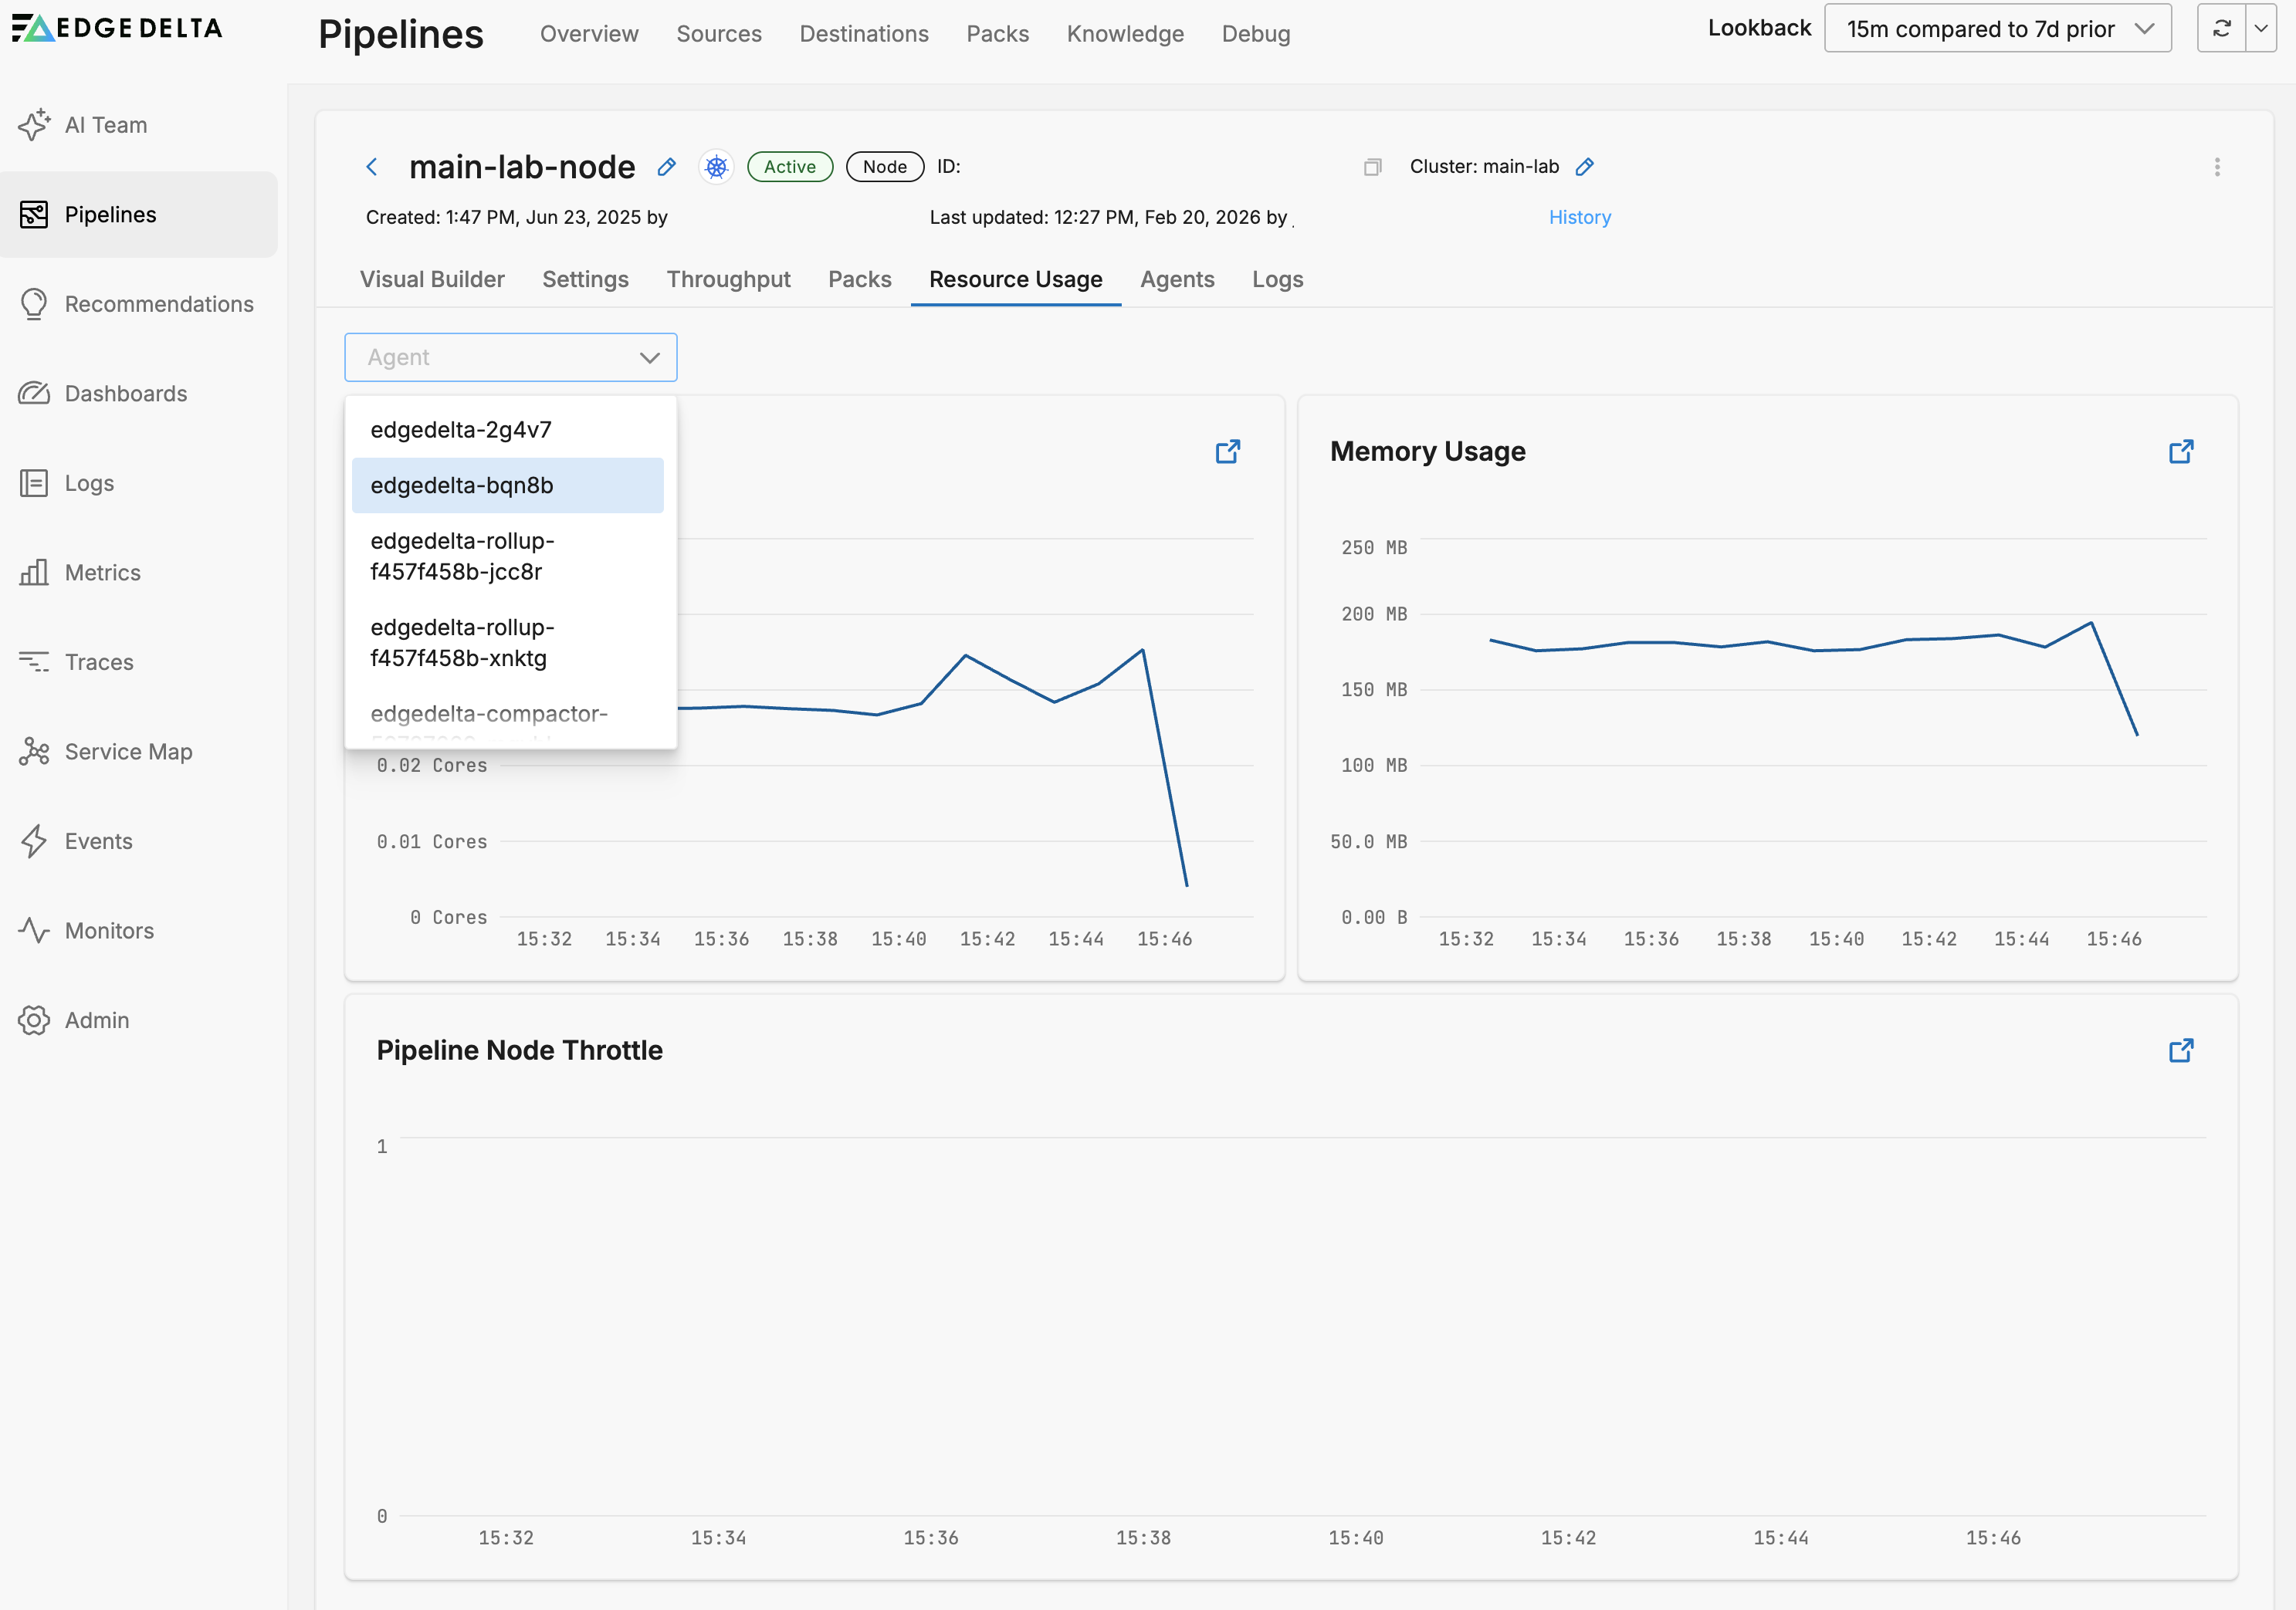
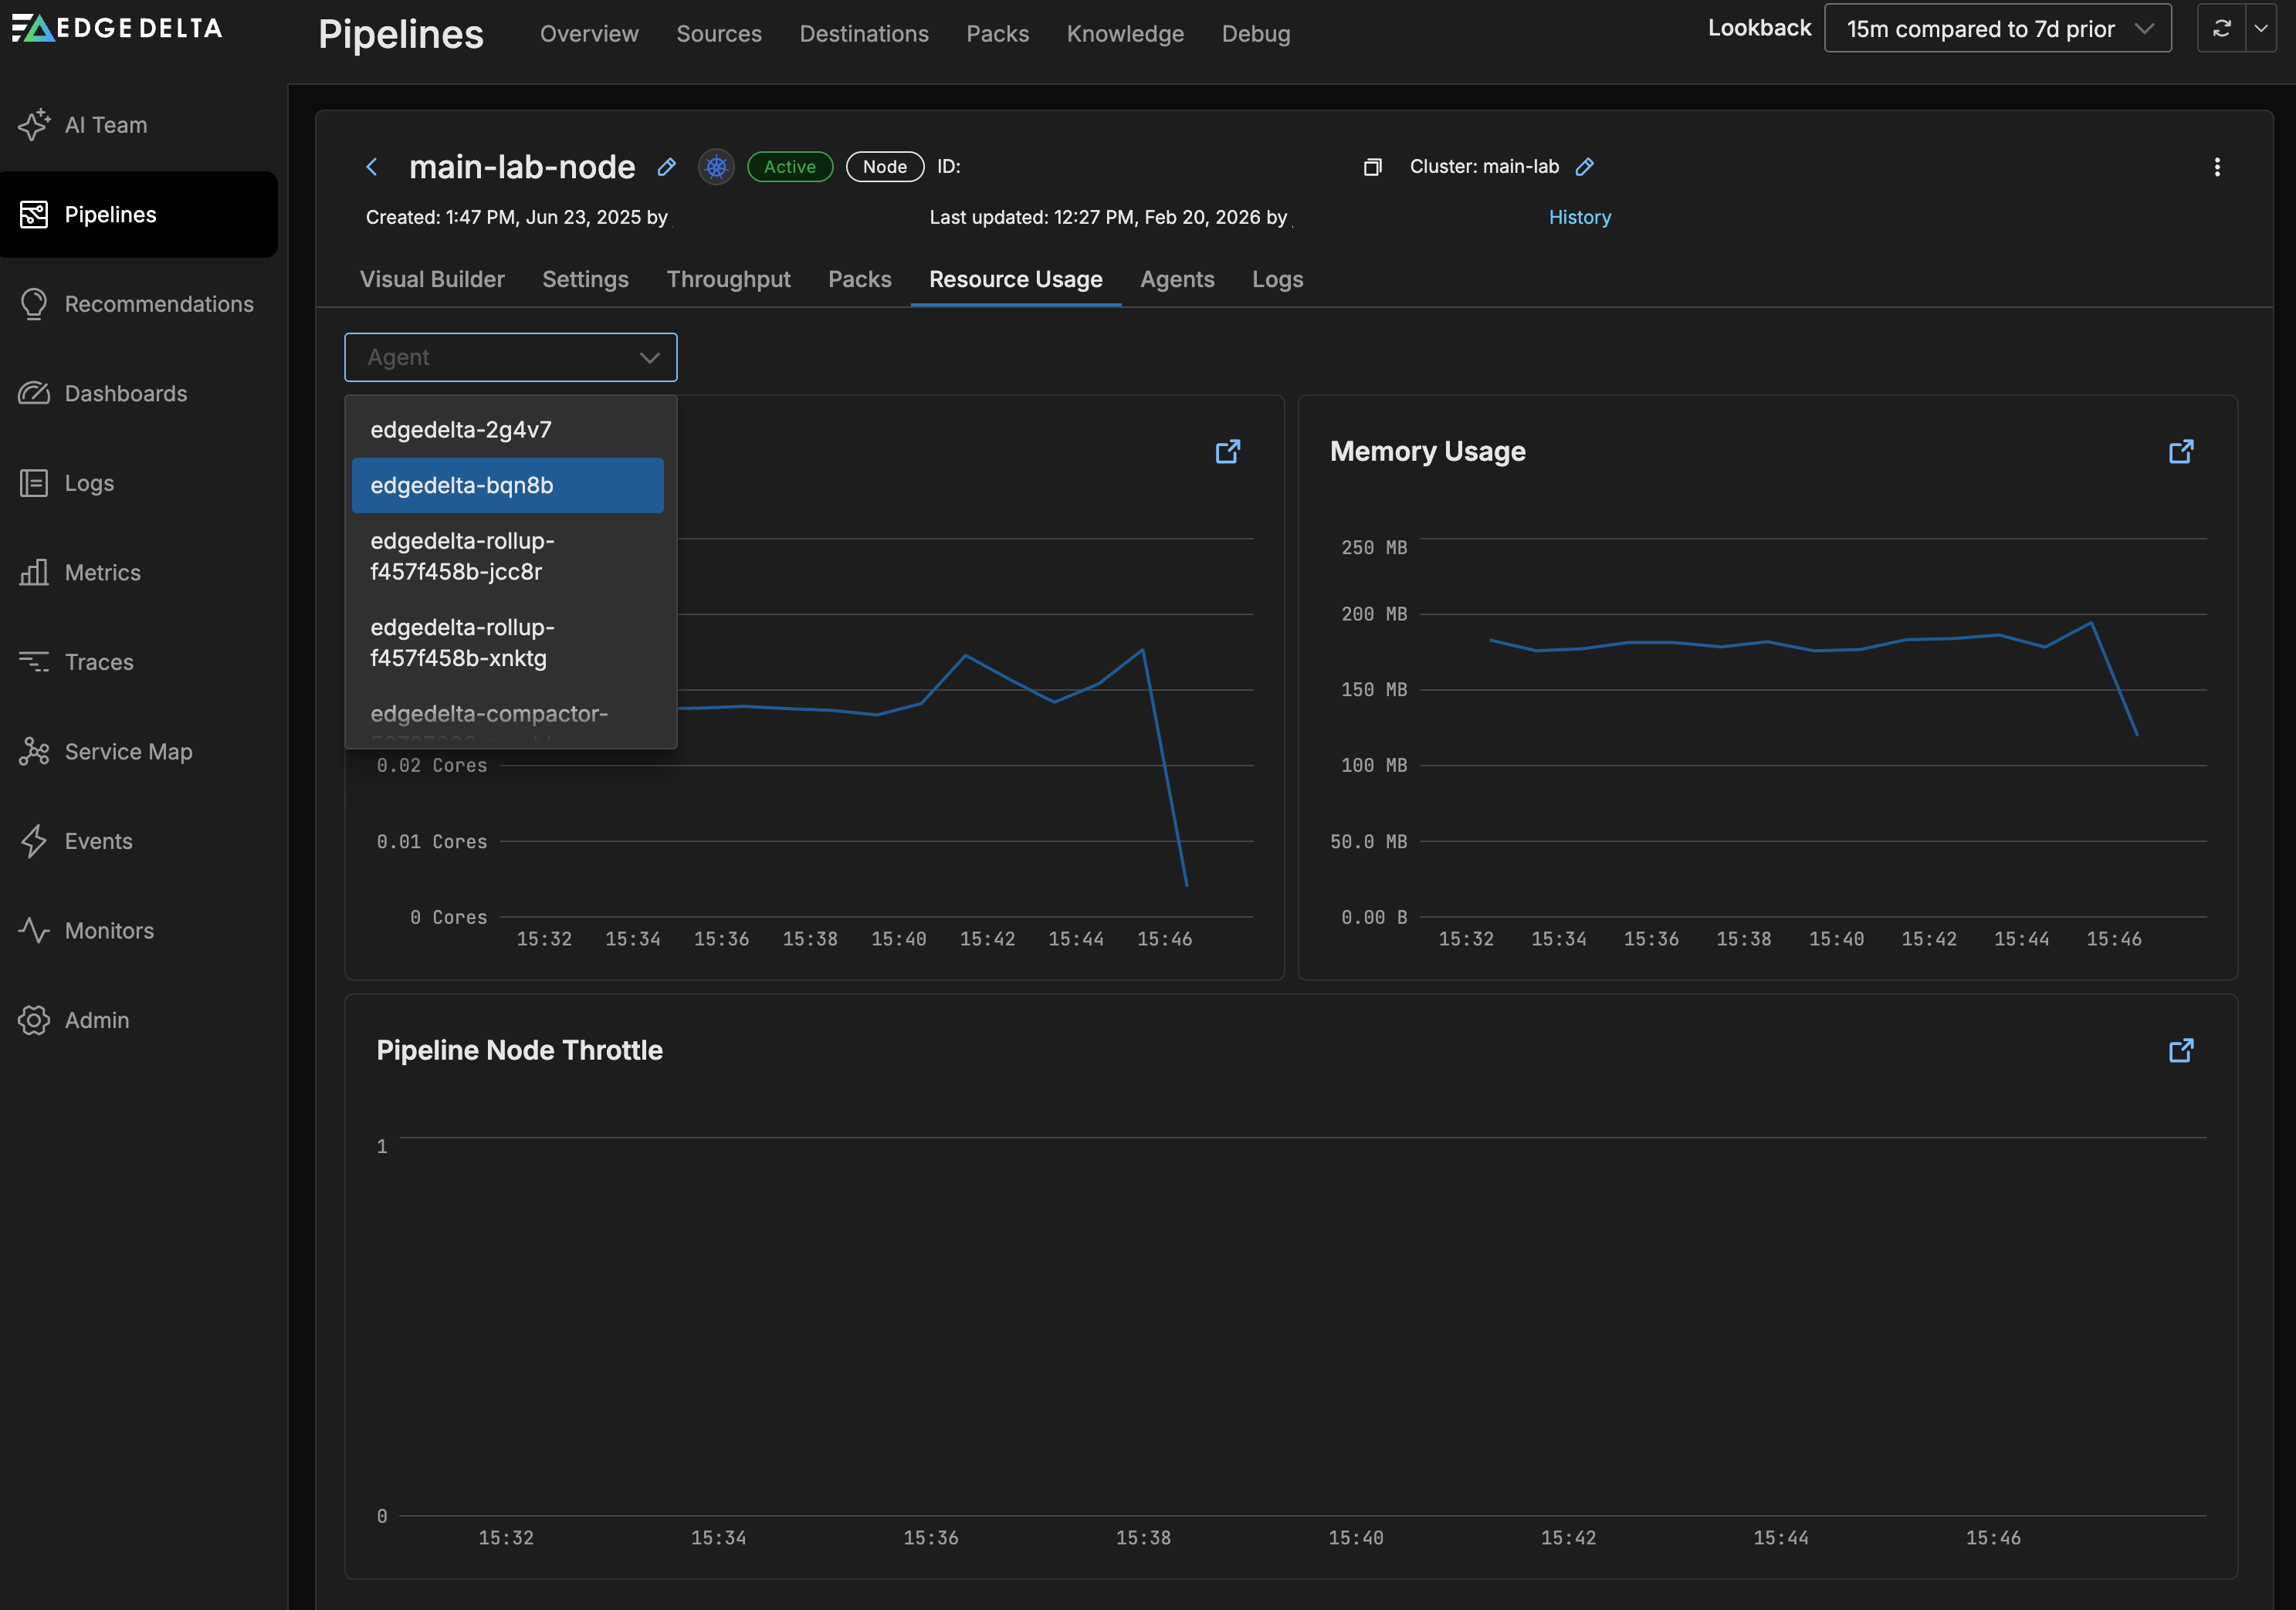
Resource Usage
On the Resource Usage tab you can view graphs for the CPU (agent_cpu_millicores.value and ed.agent.cpu.milicores metrics) and memory usage (agent_mem_alloc.value and ed.agent.memory.allocation metrics) of the Edge Delta agents belonging to this pipeline.
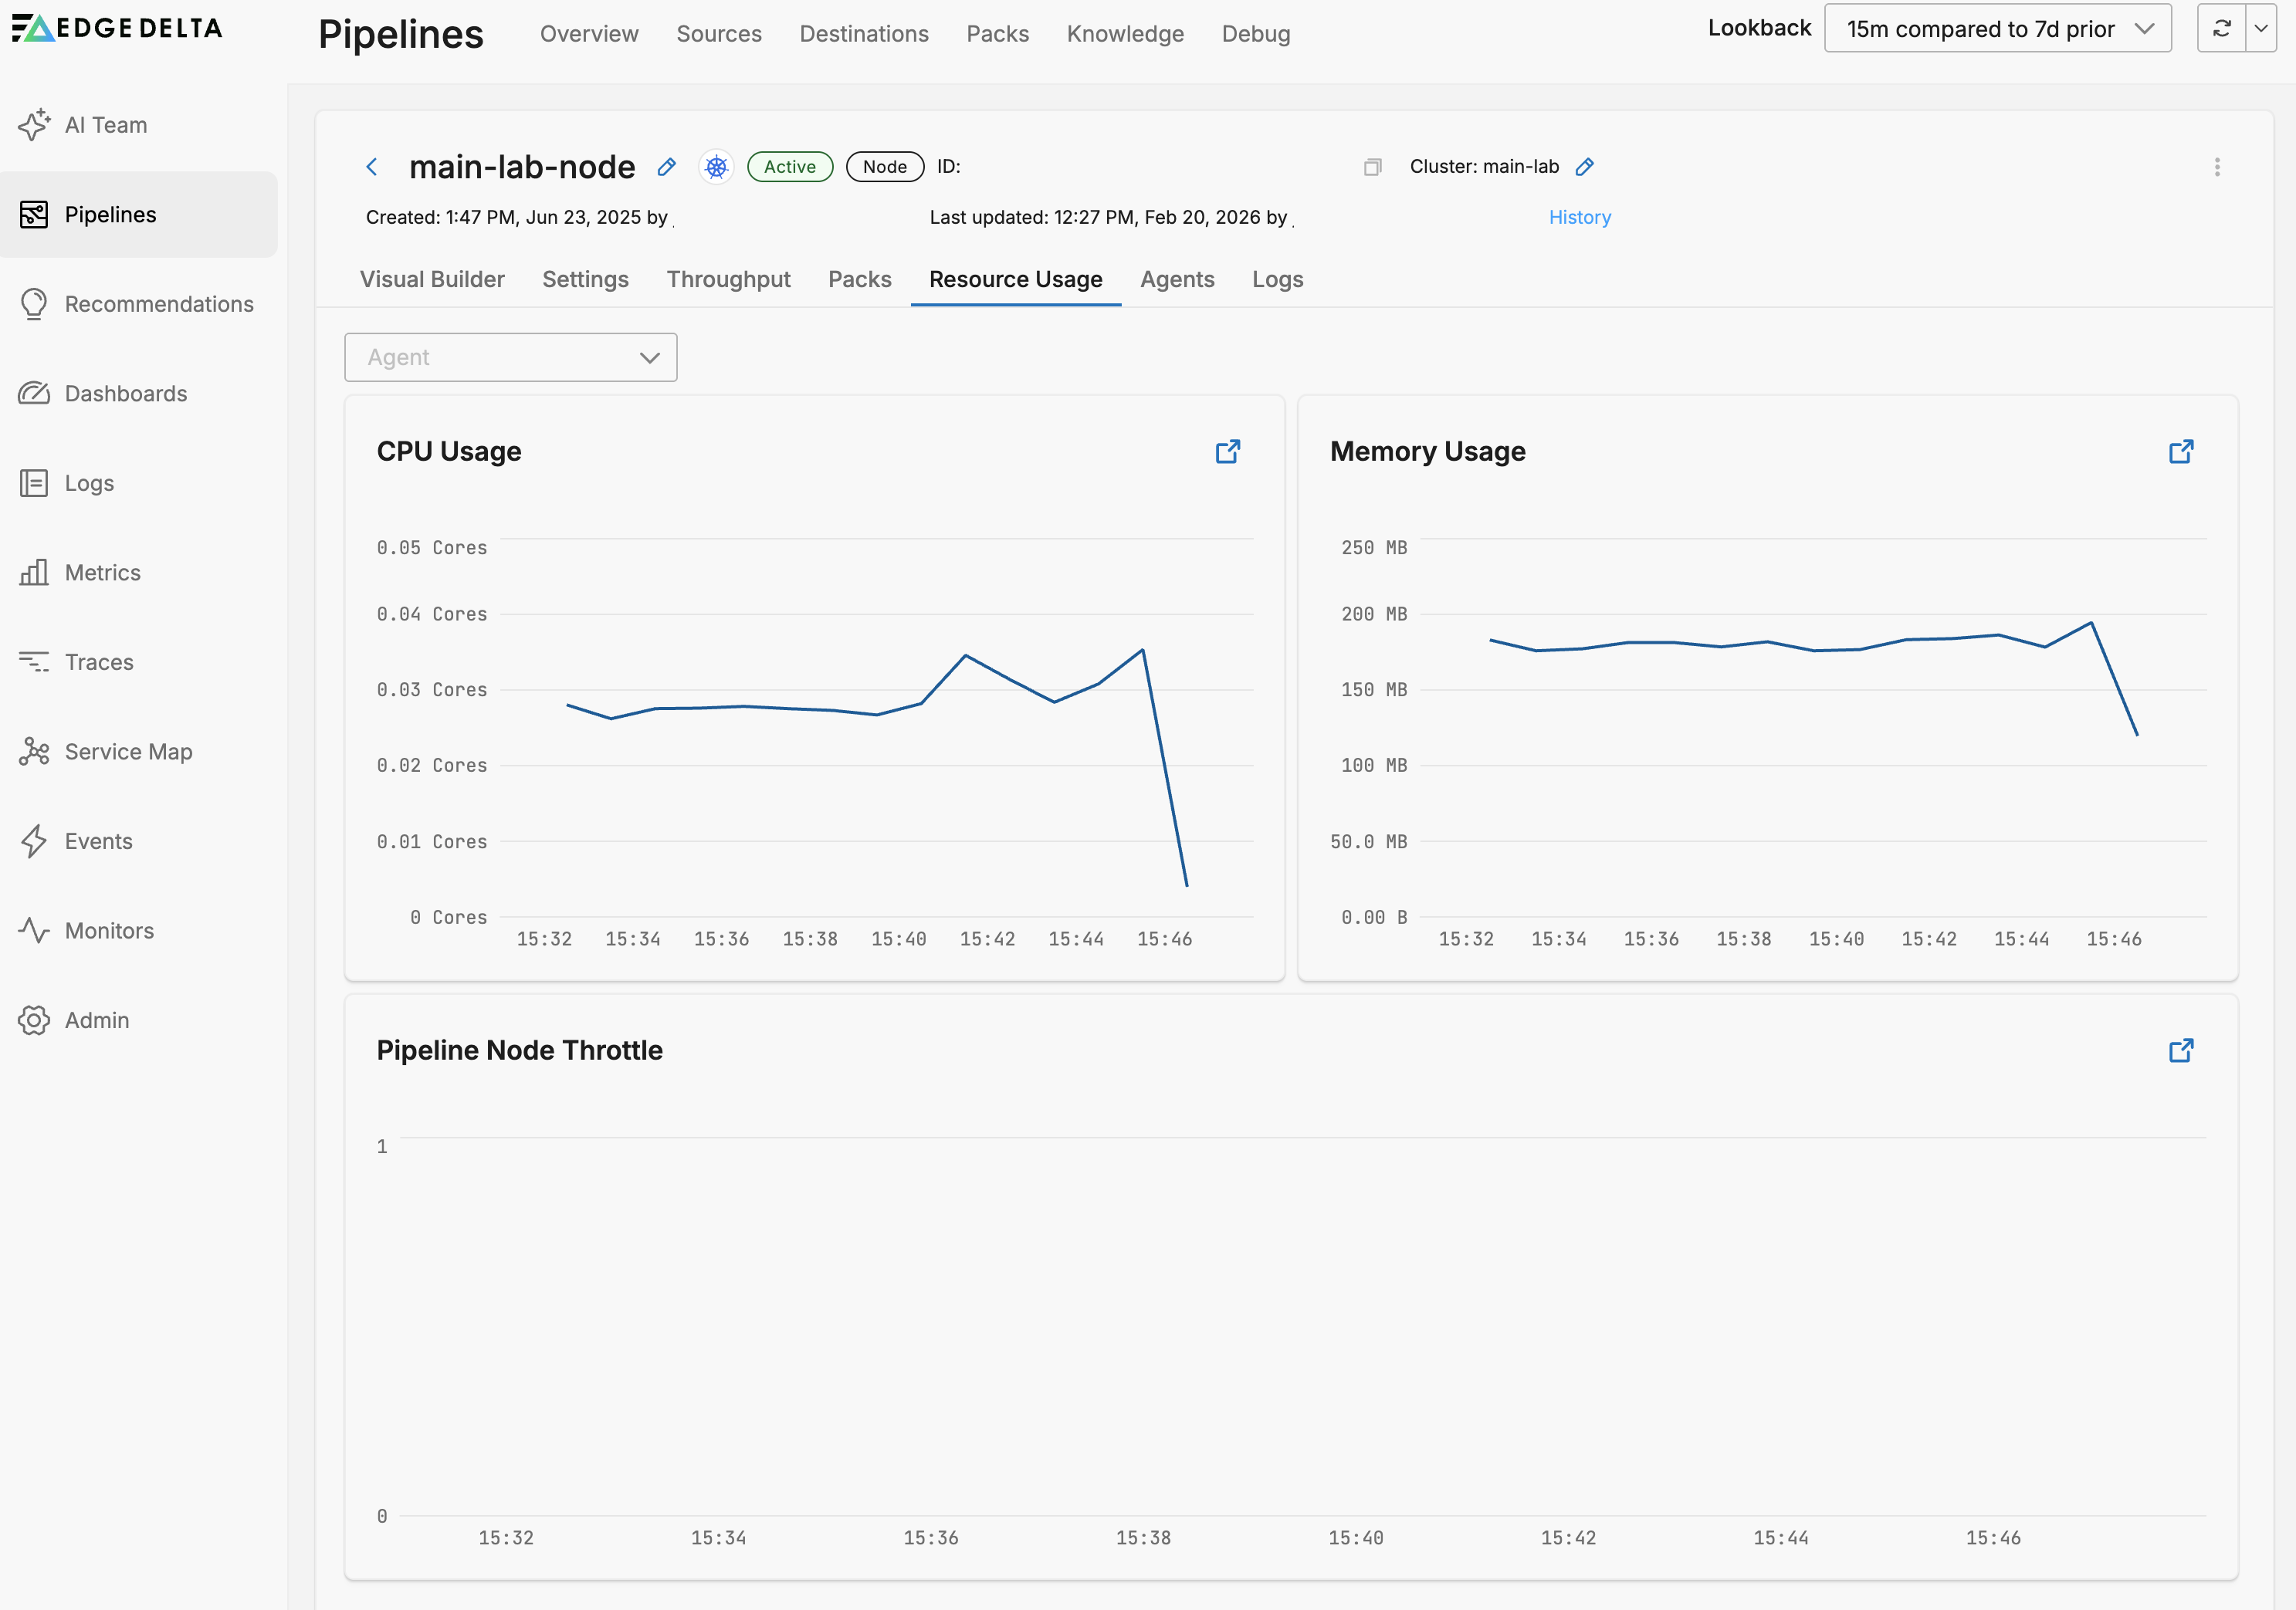
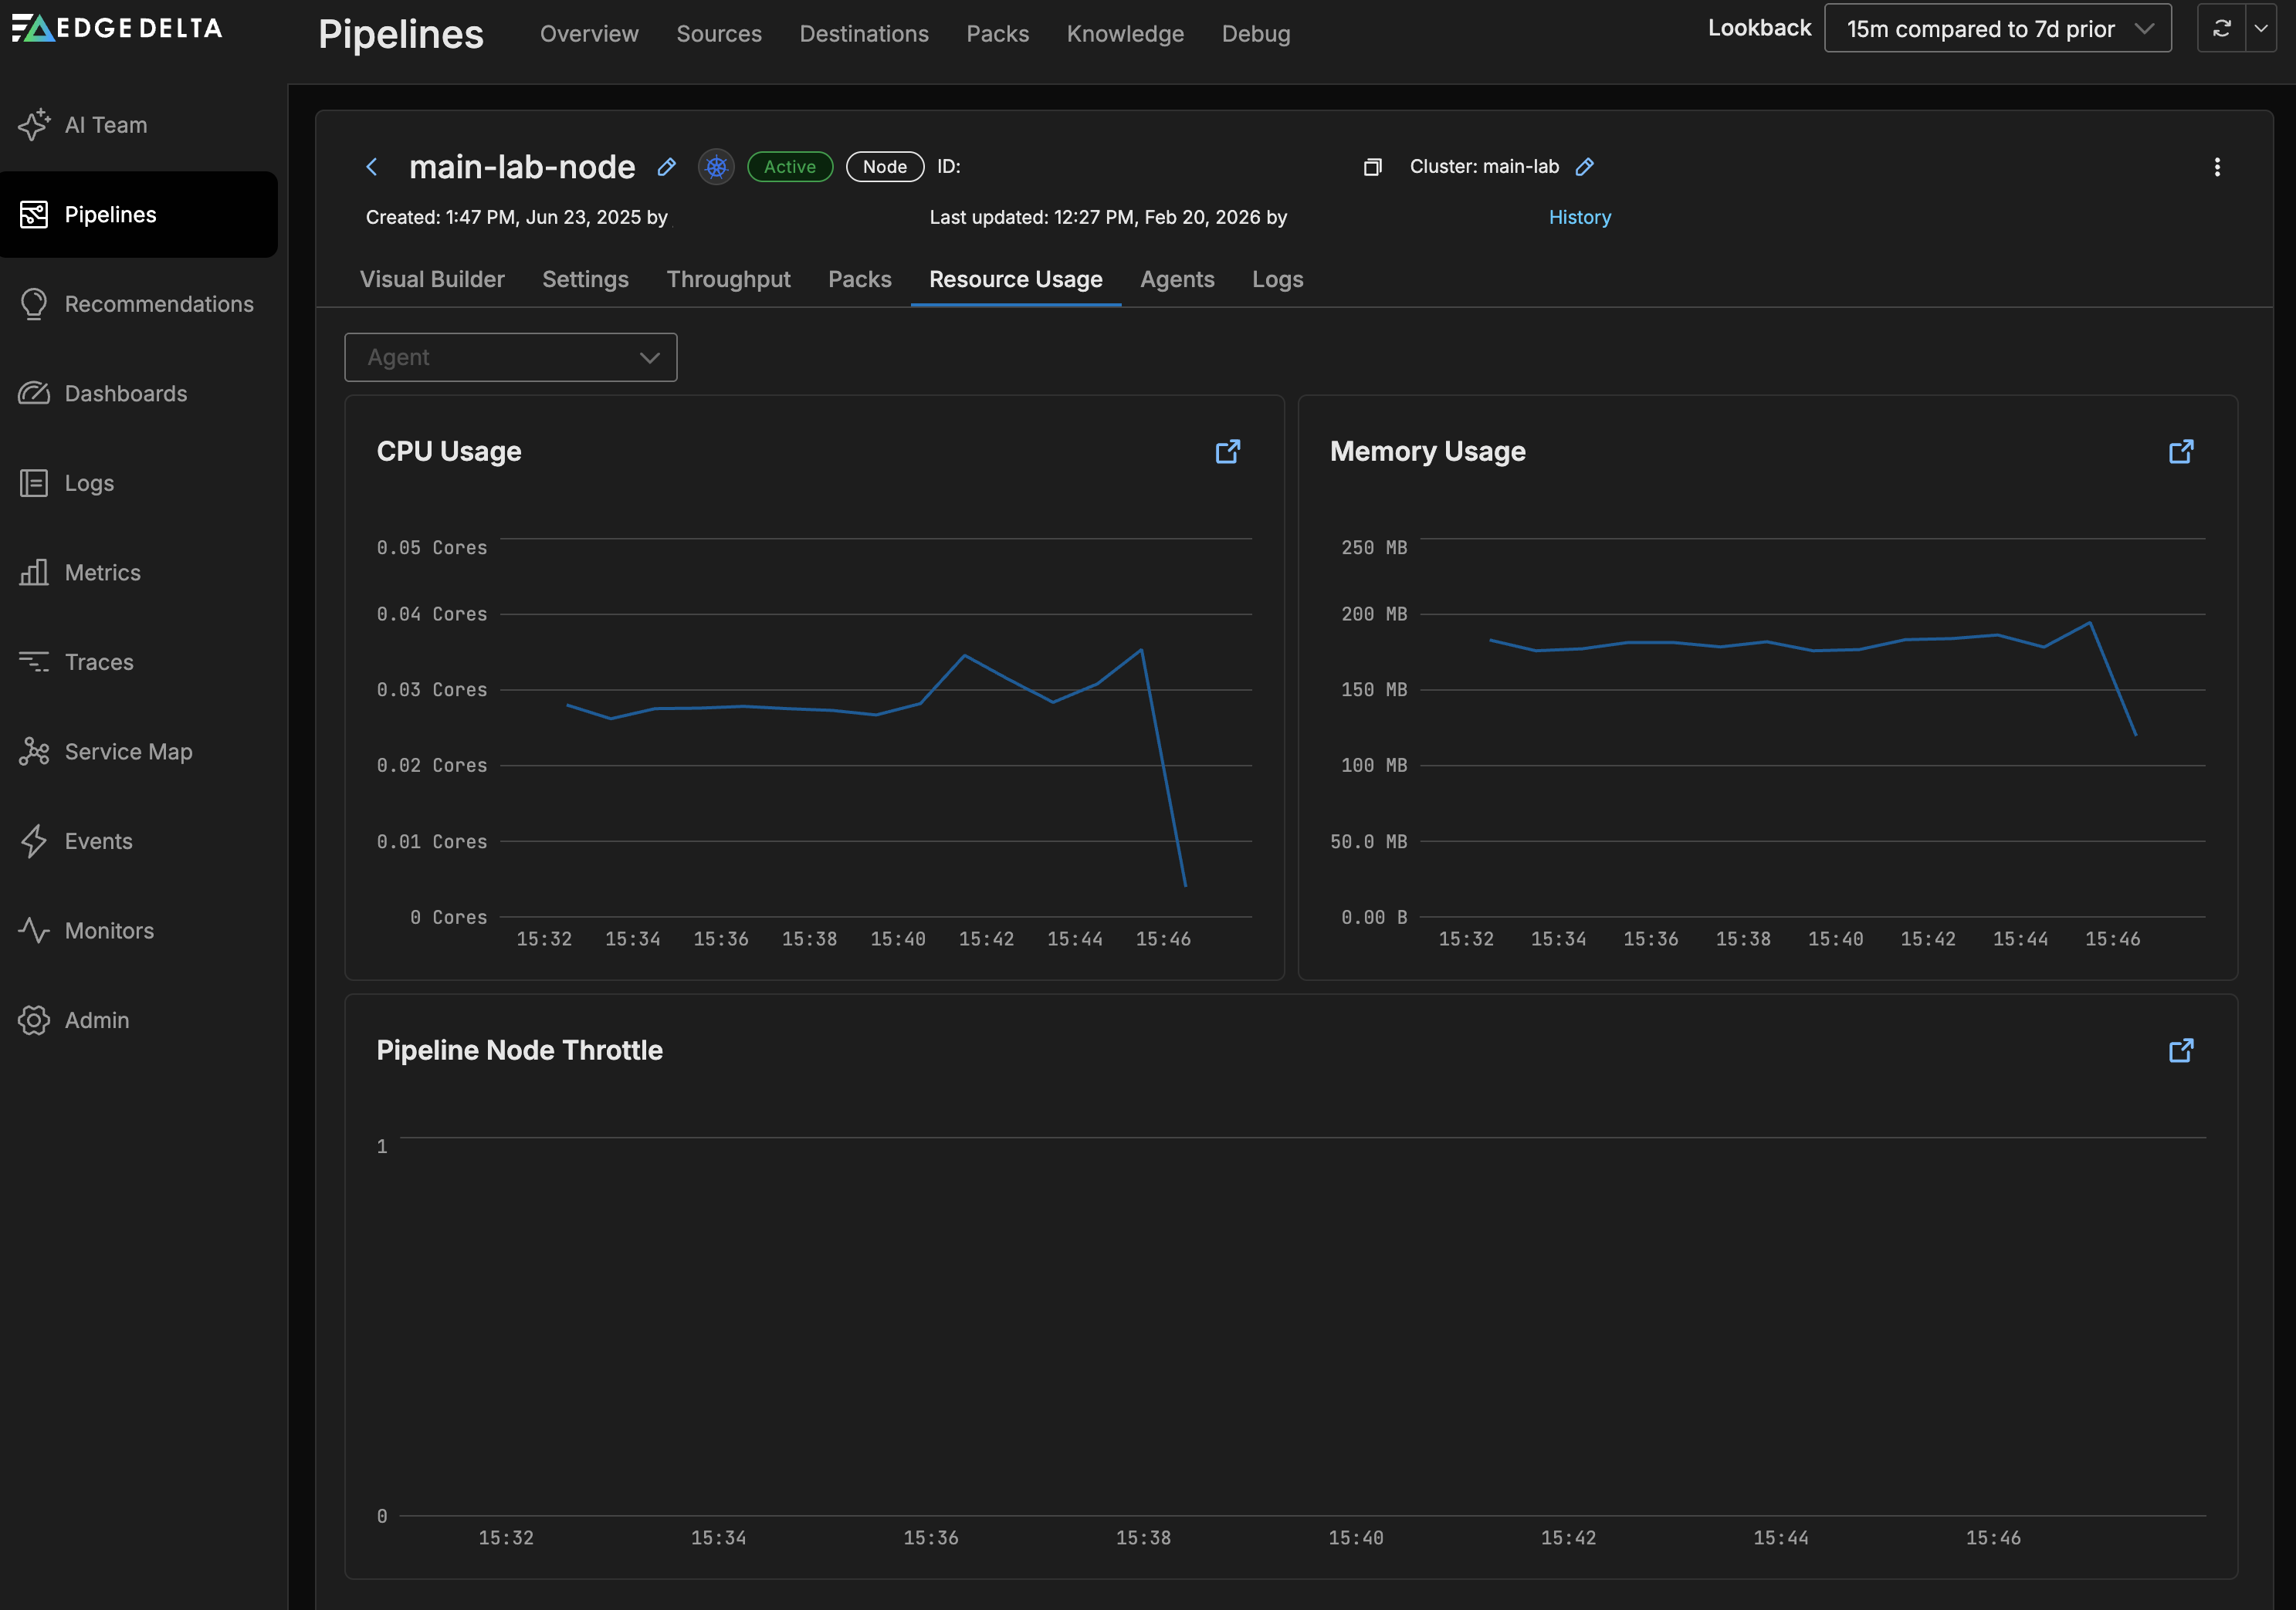
You can filter the graphs by Host:
Agents
On the Agents tab the Edge Delta agents belonging to the pipeline are listed on the Host Name table.
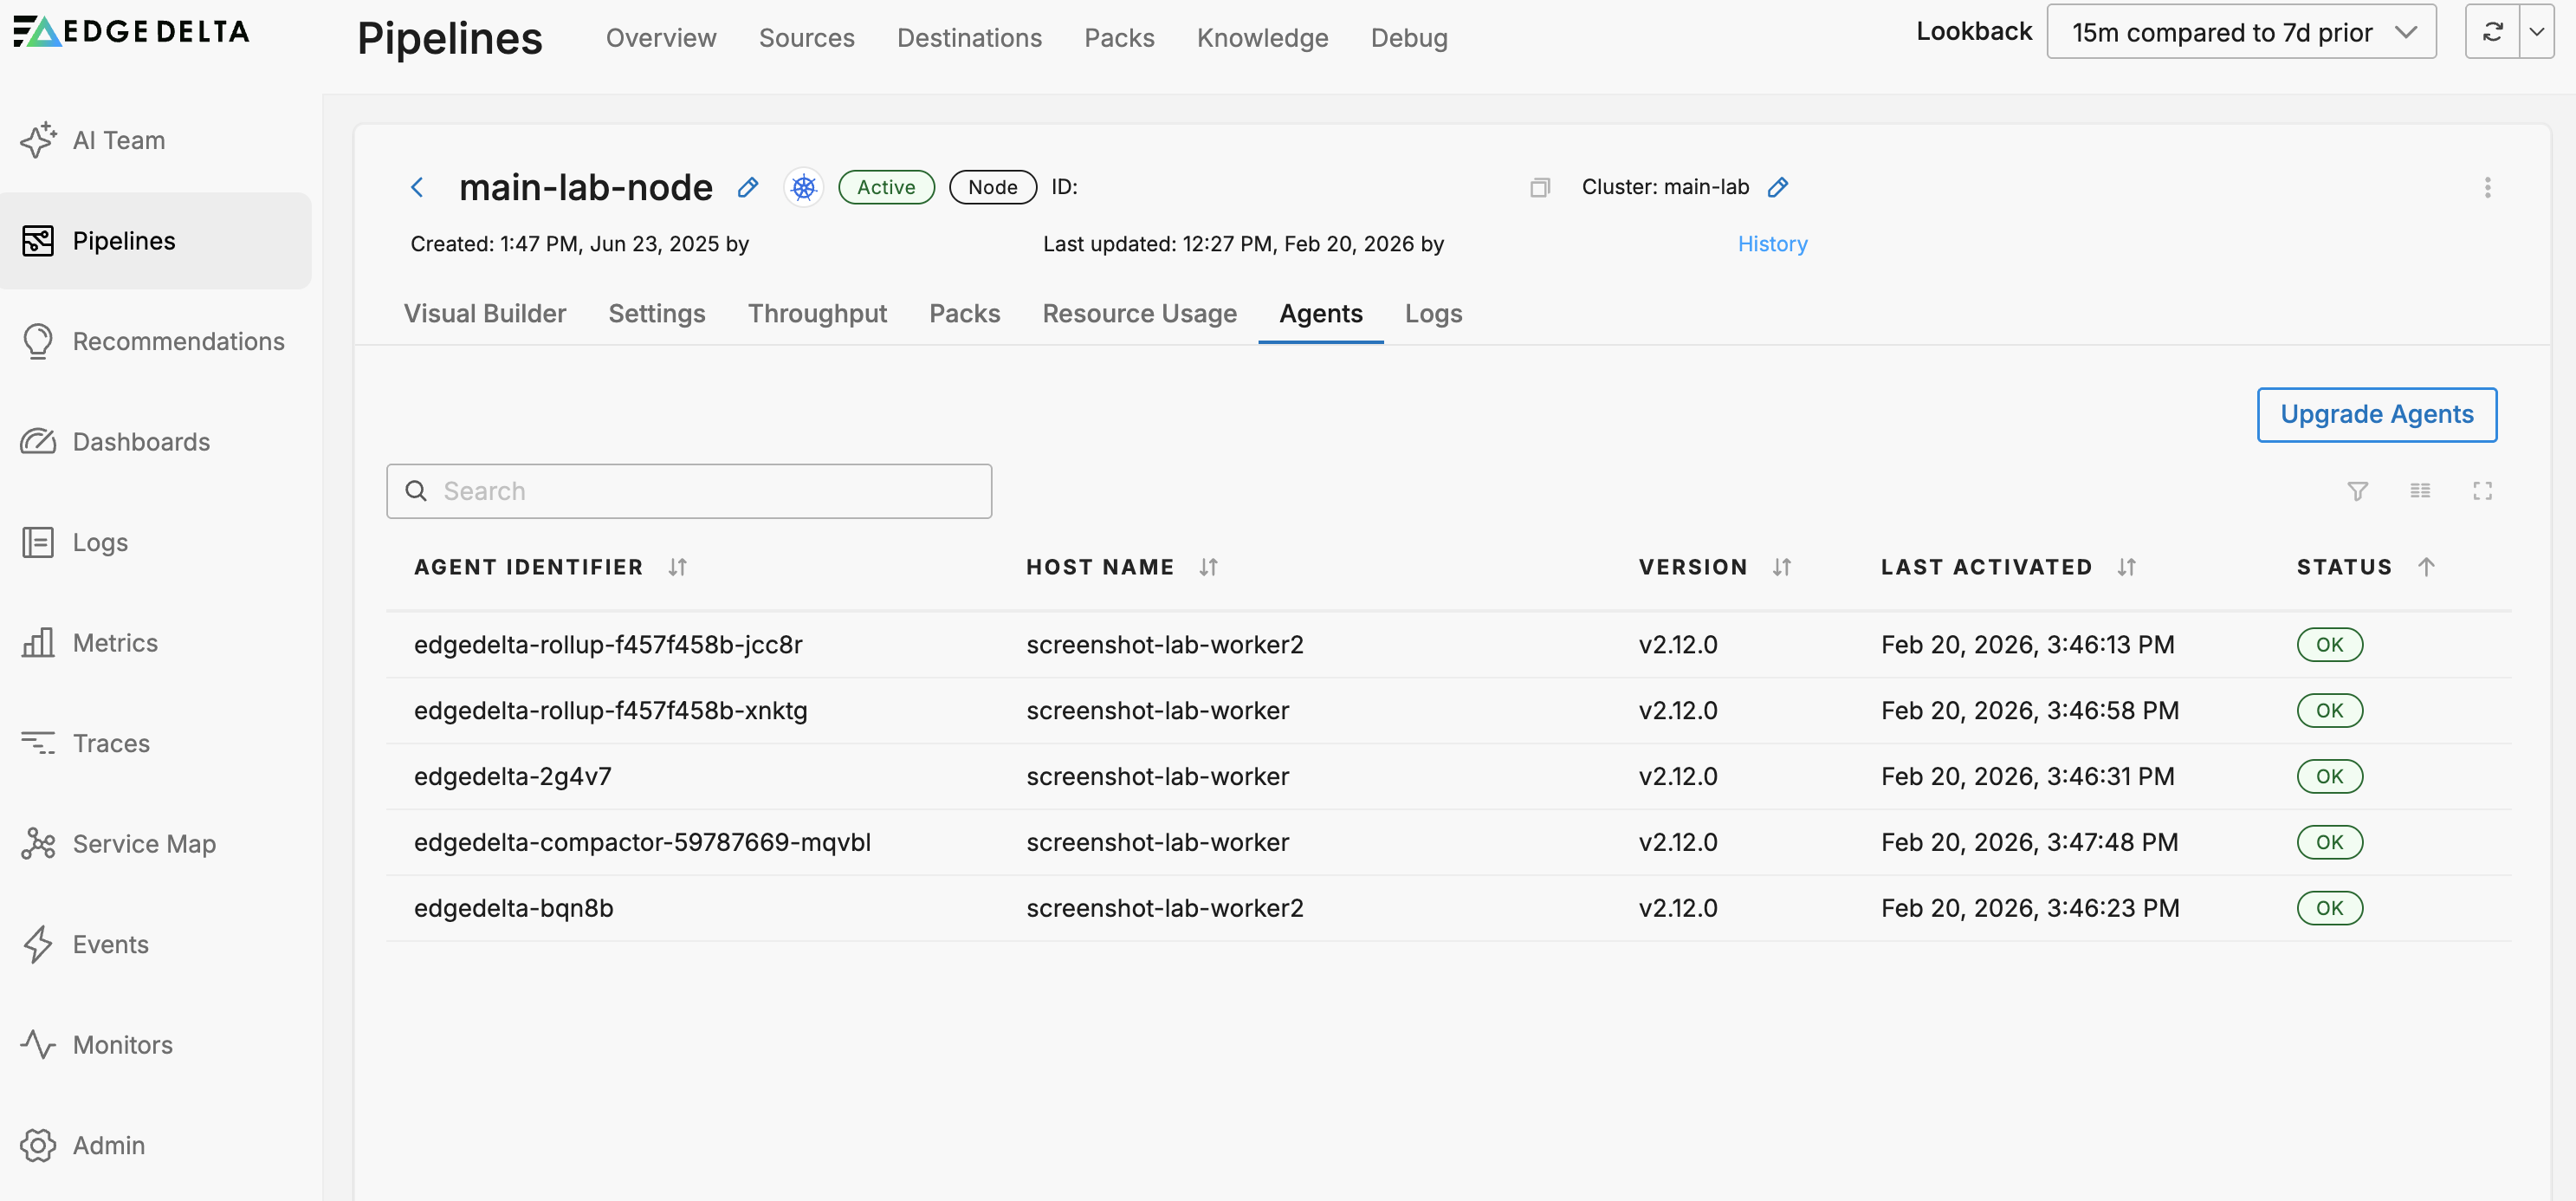
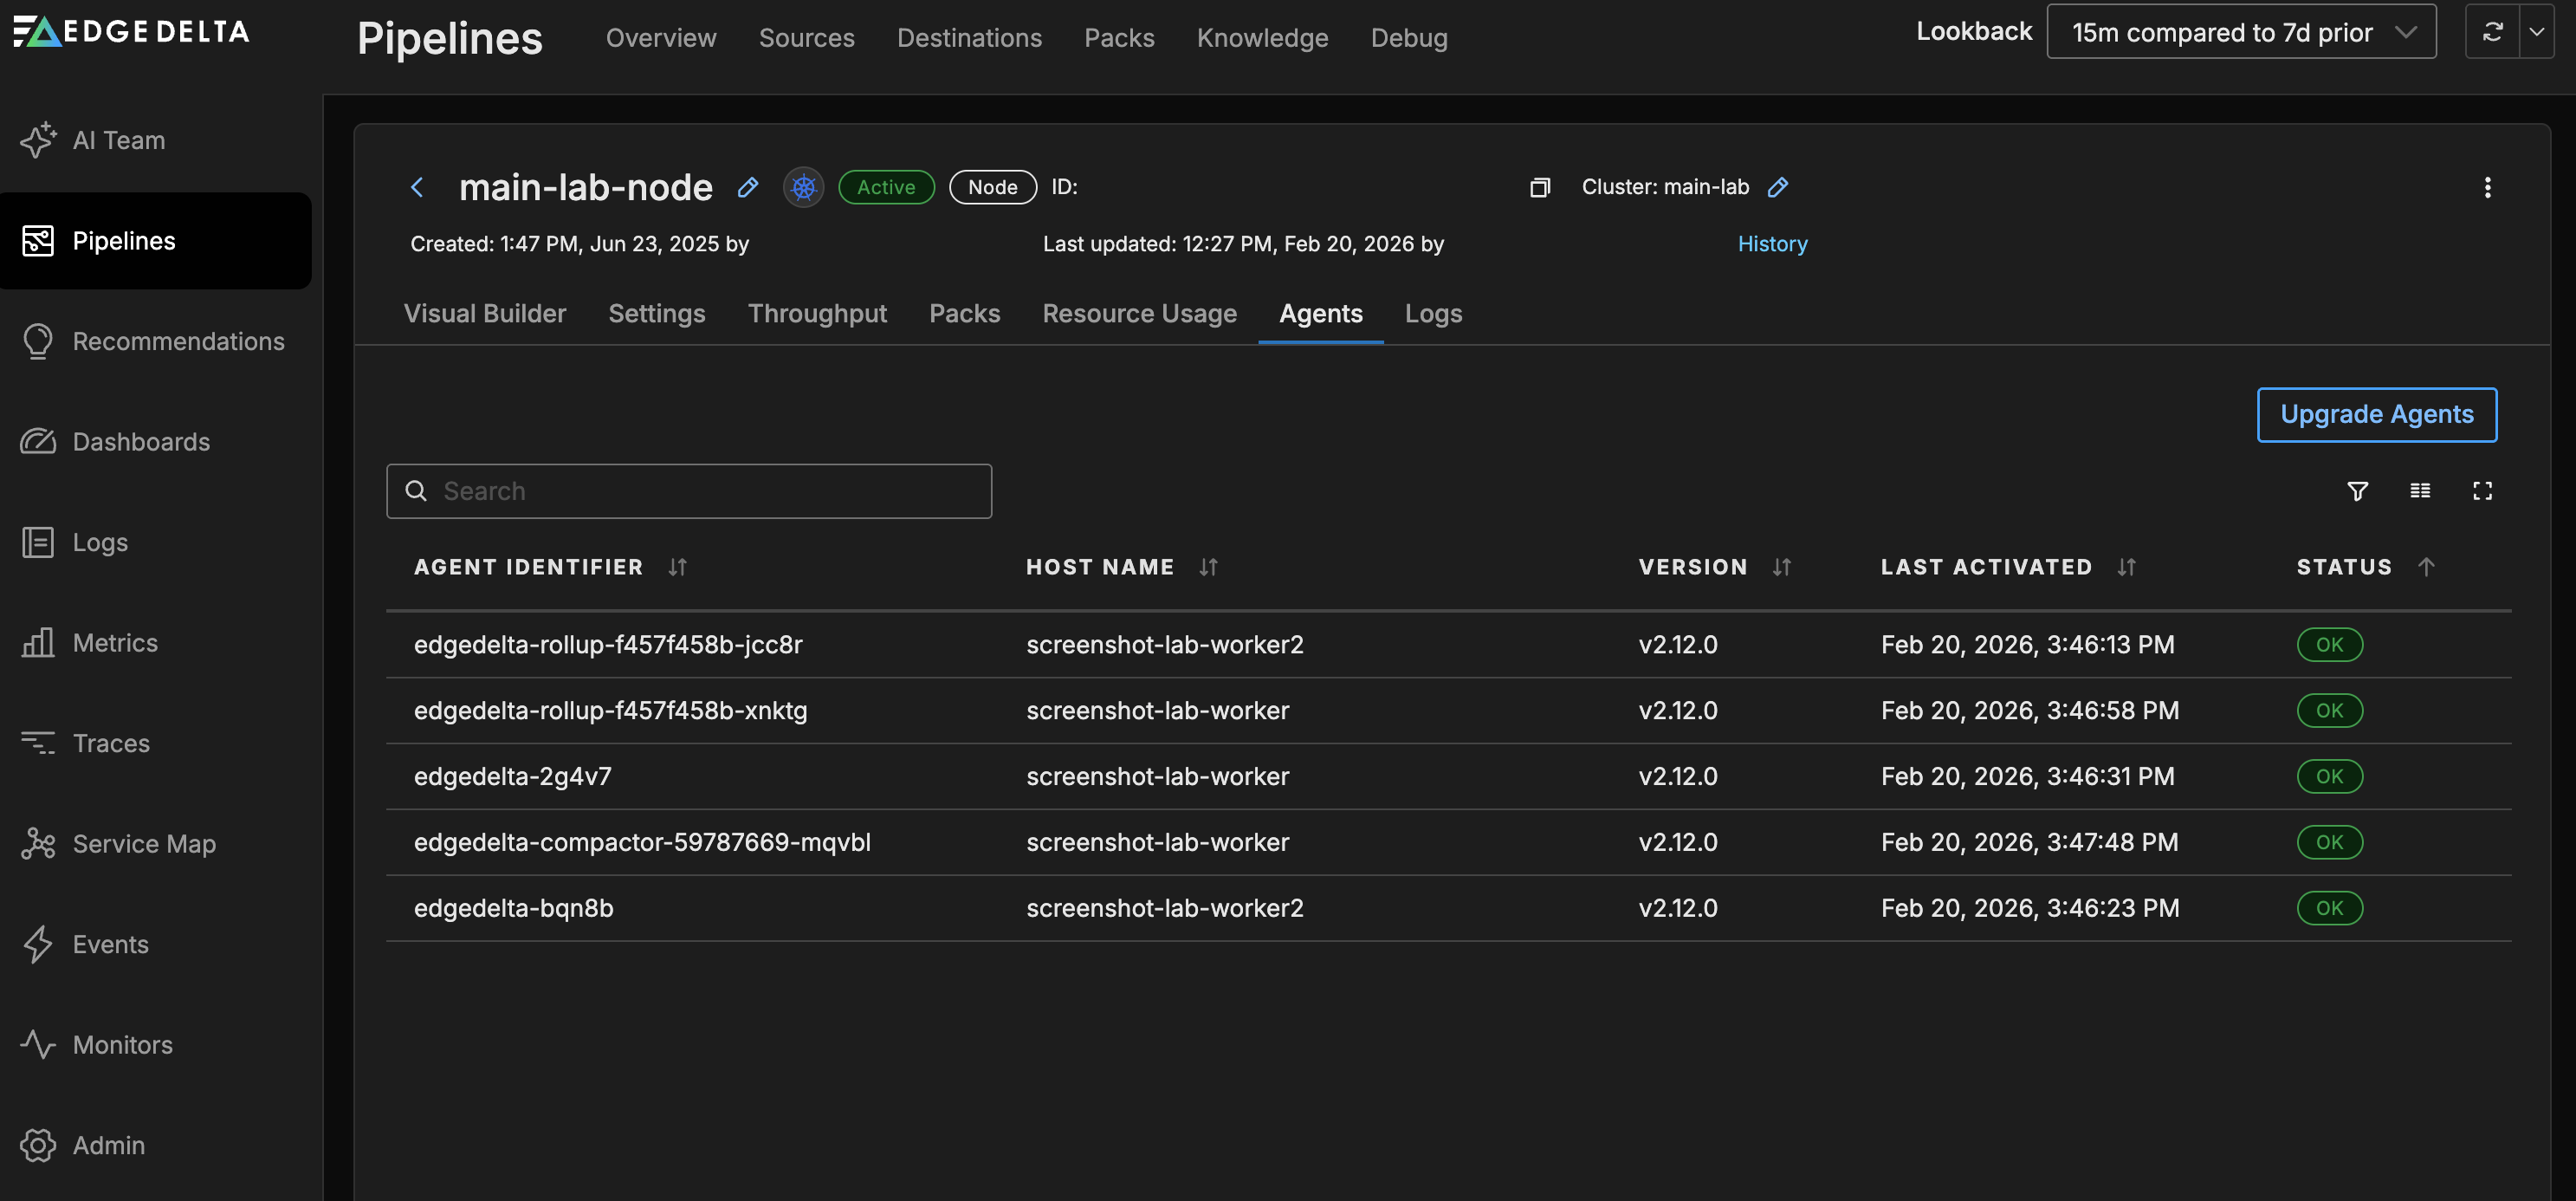
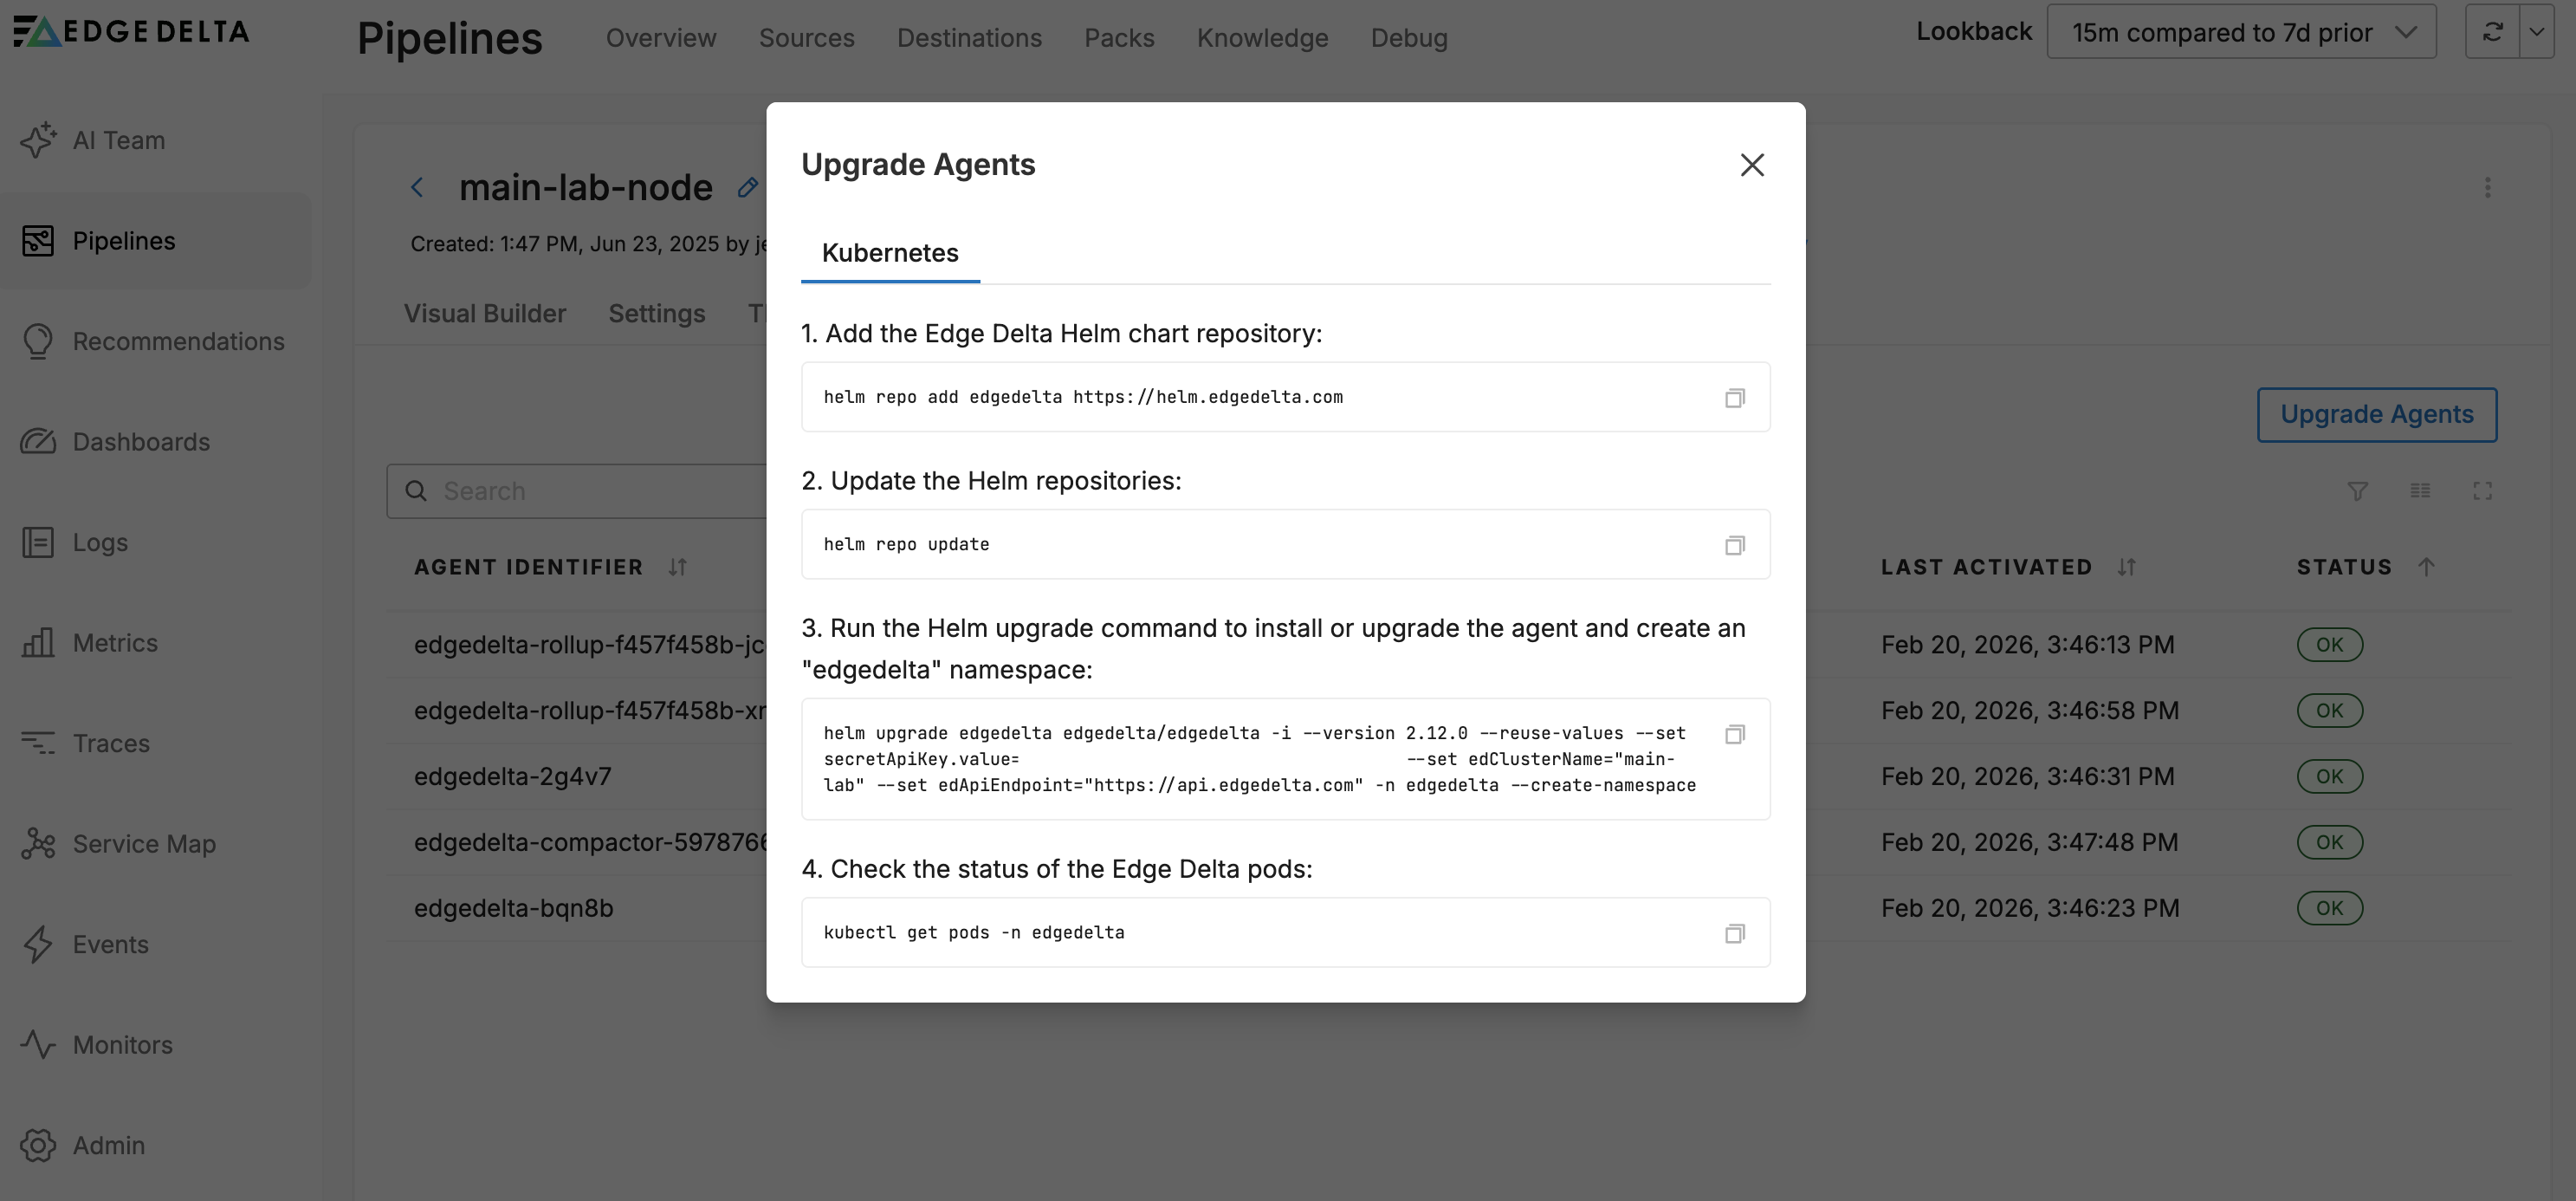
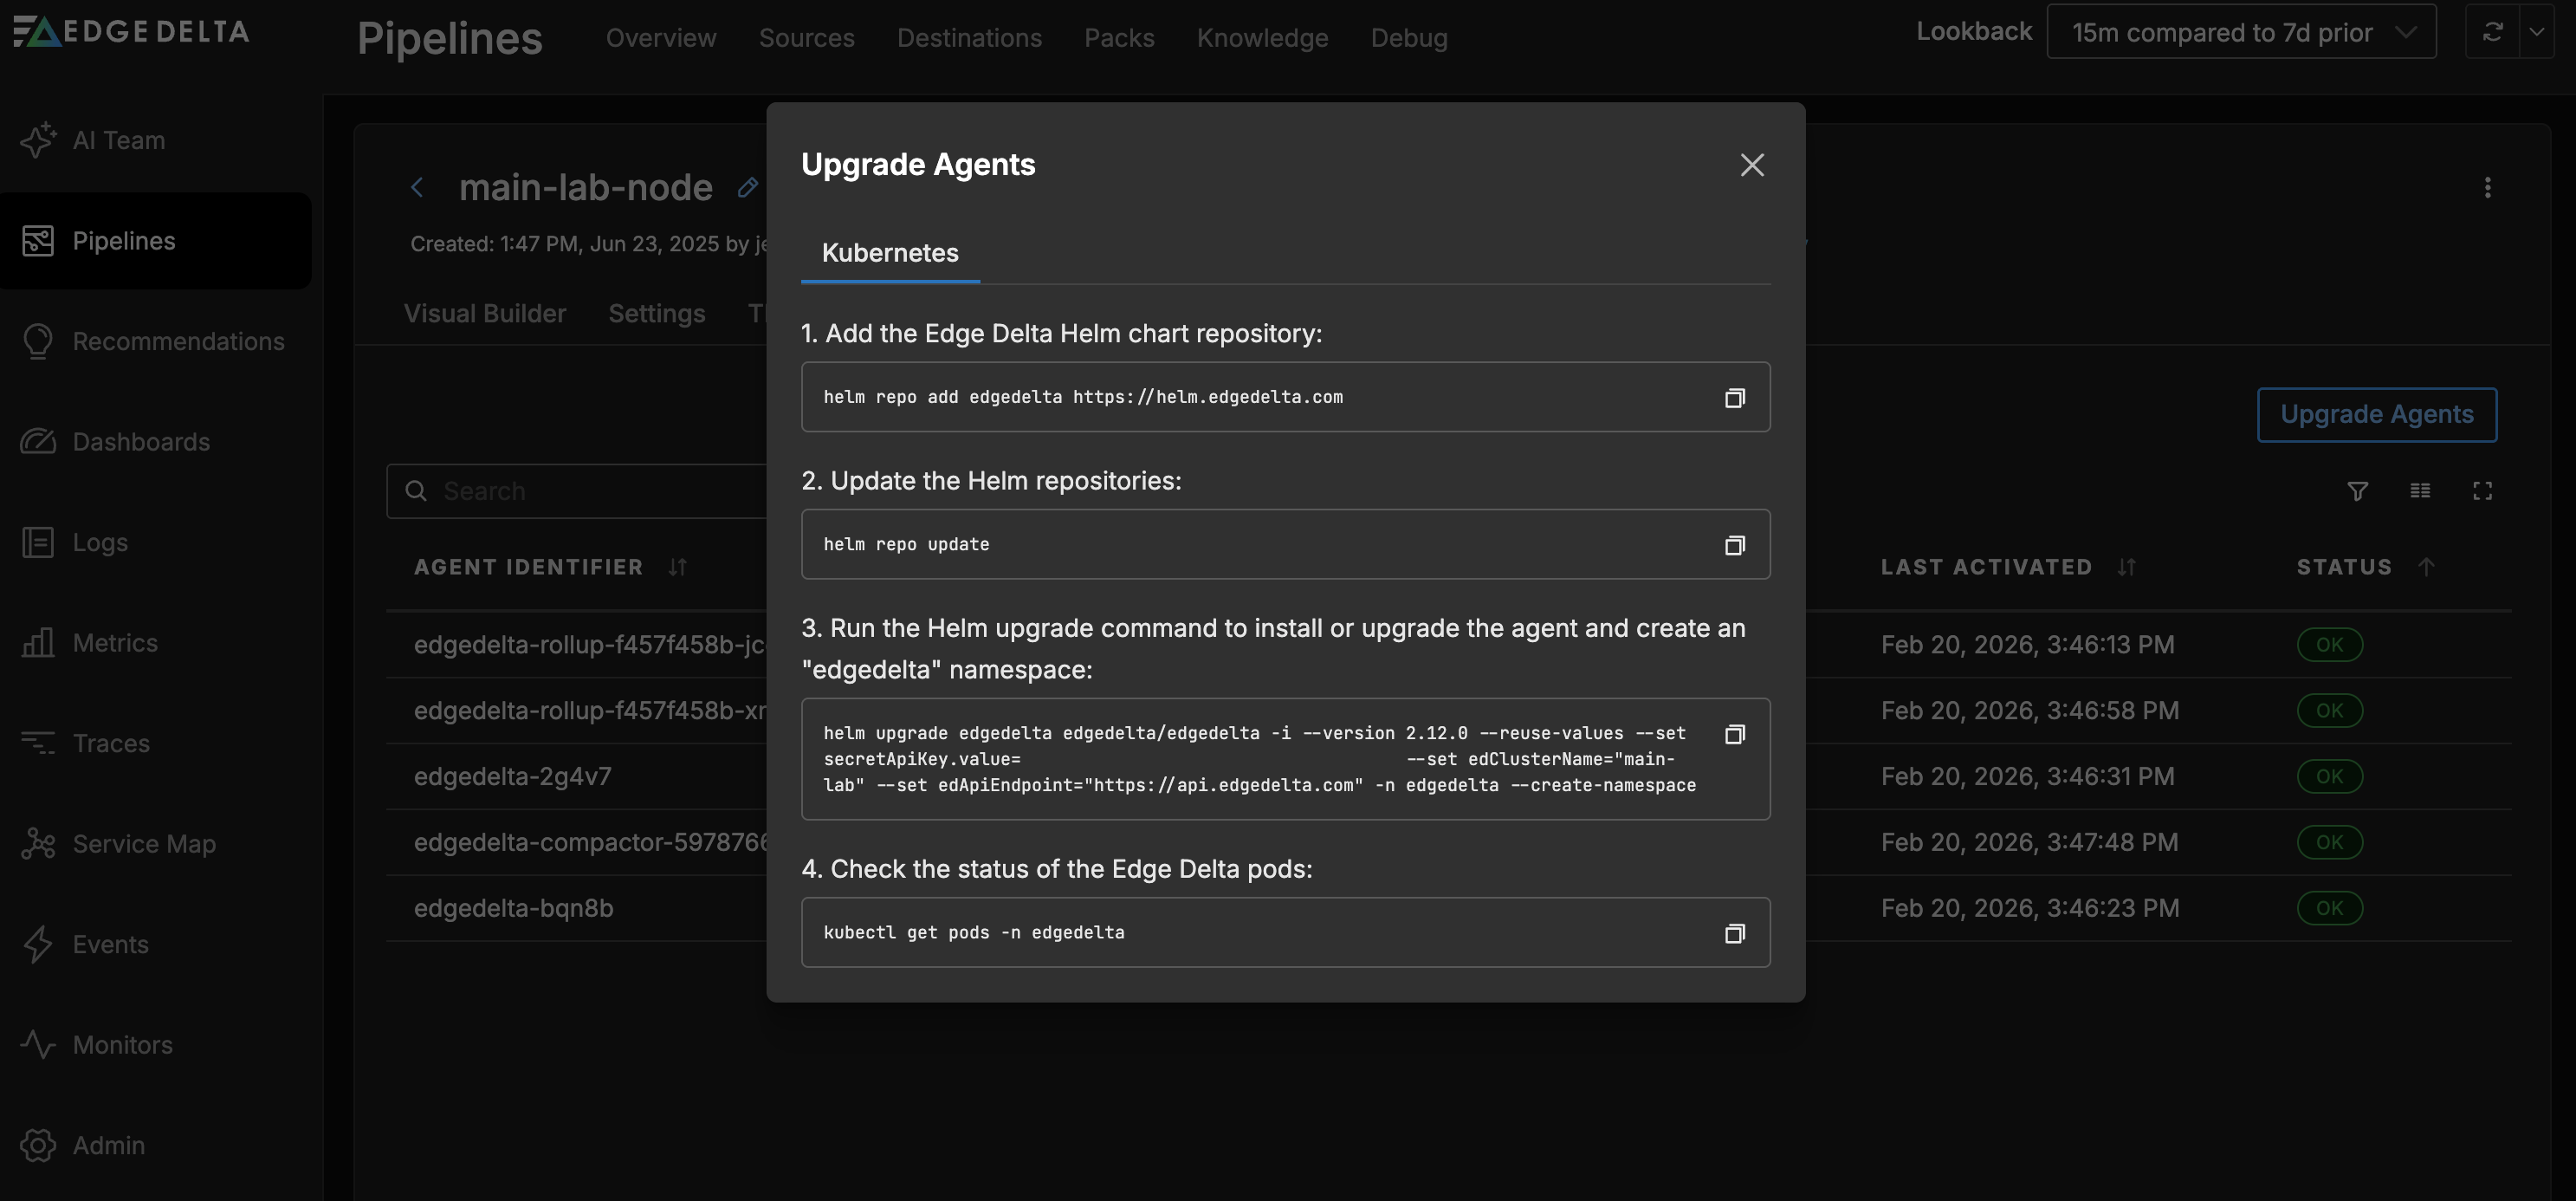
Click Upgrade Agents to view the upgrade commands for the latest version of the agents, and in the environment you selected when you created the pipeline.
Agent Details
Click an agent to view its details for troubleshooting an Edge Delta installation. It opens on the Health tab for the agent:
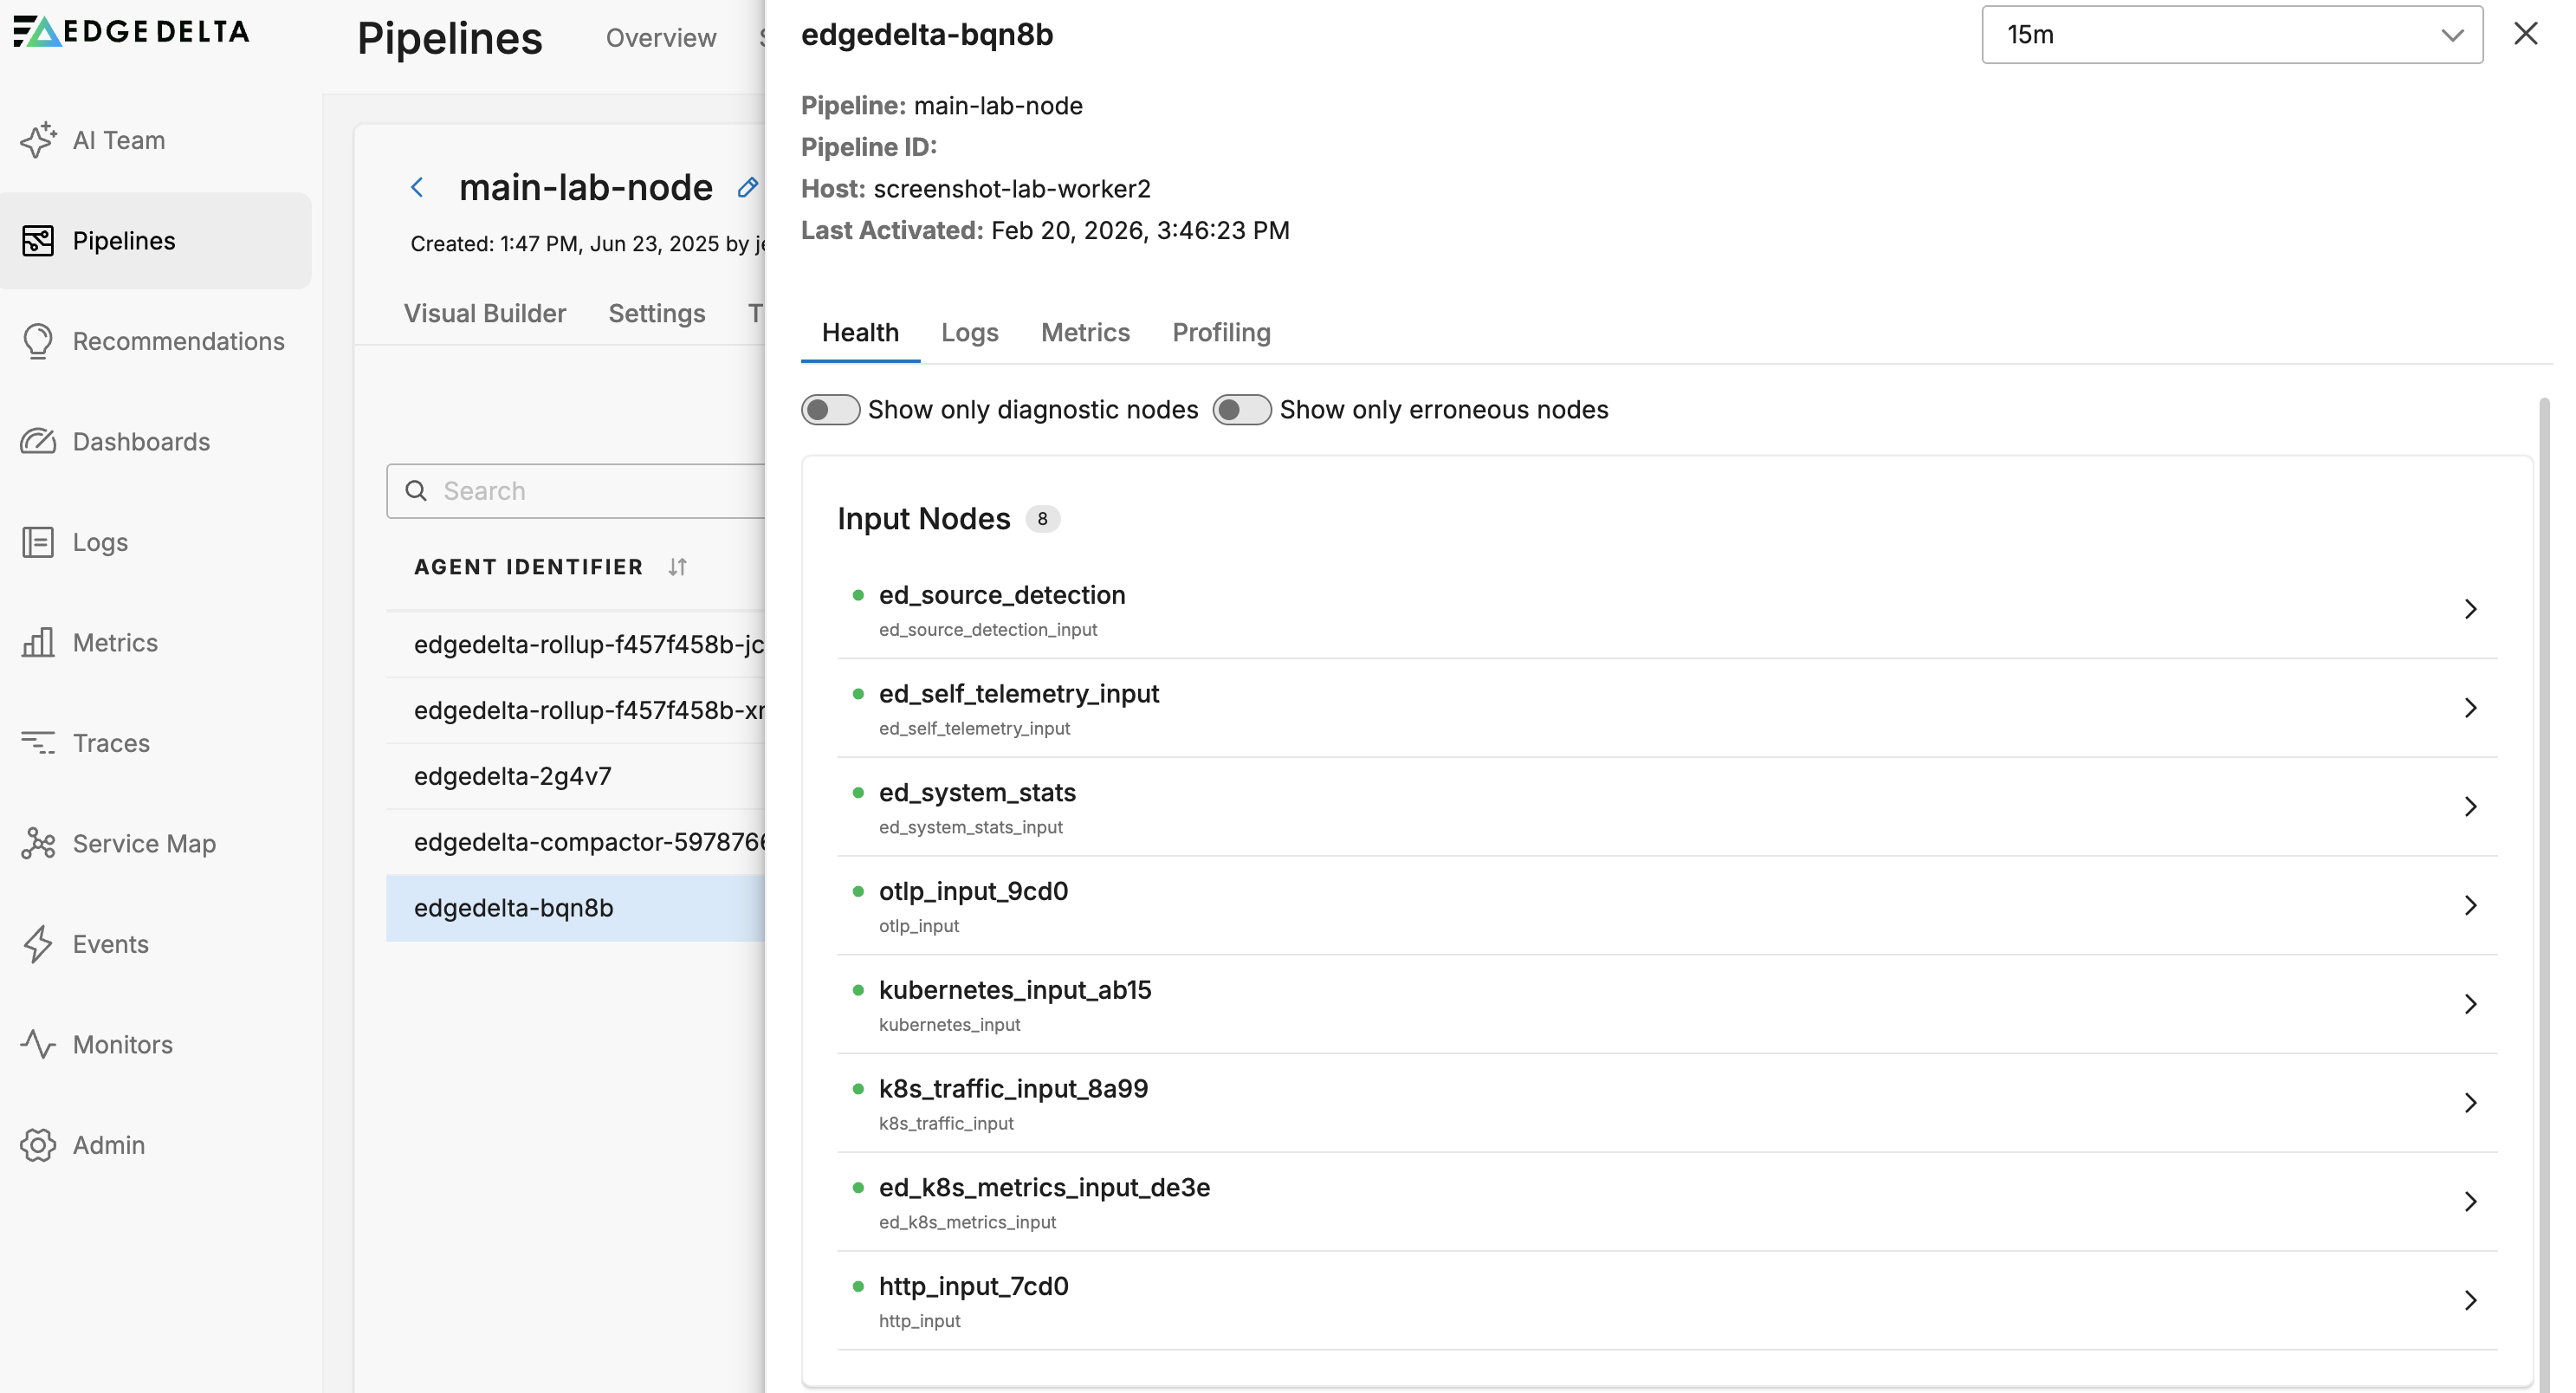
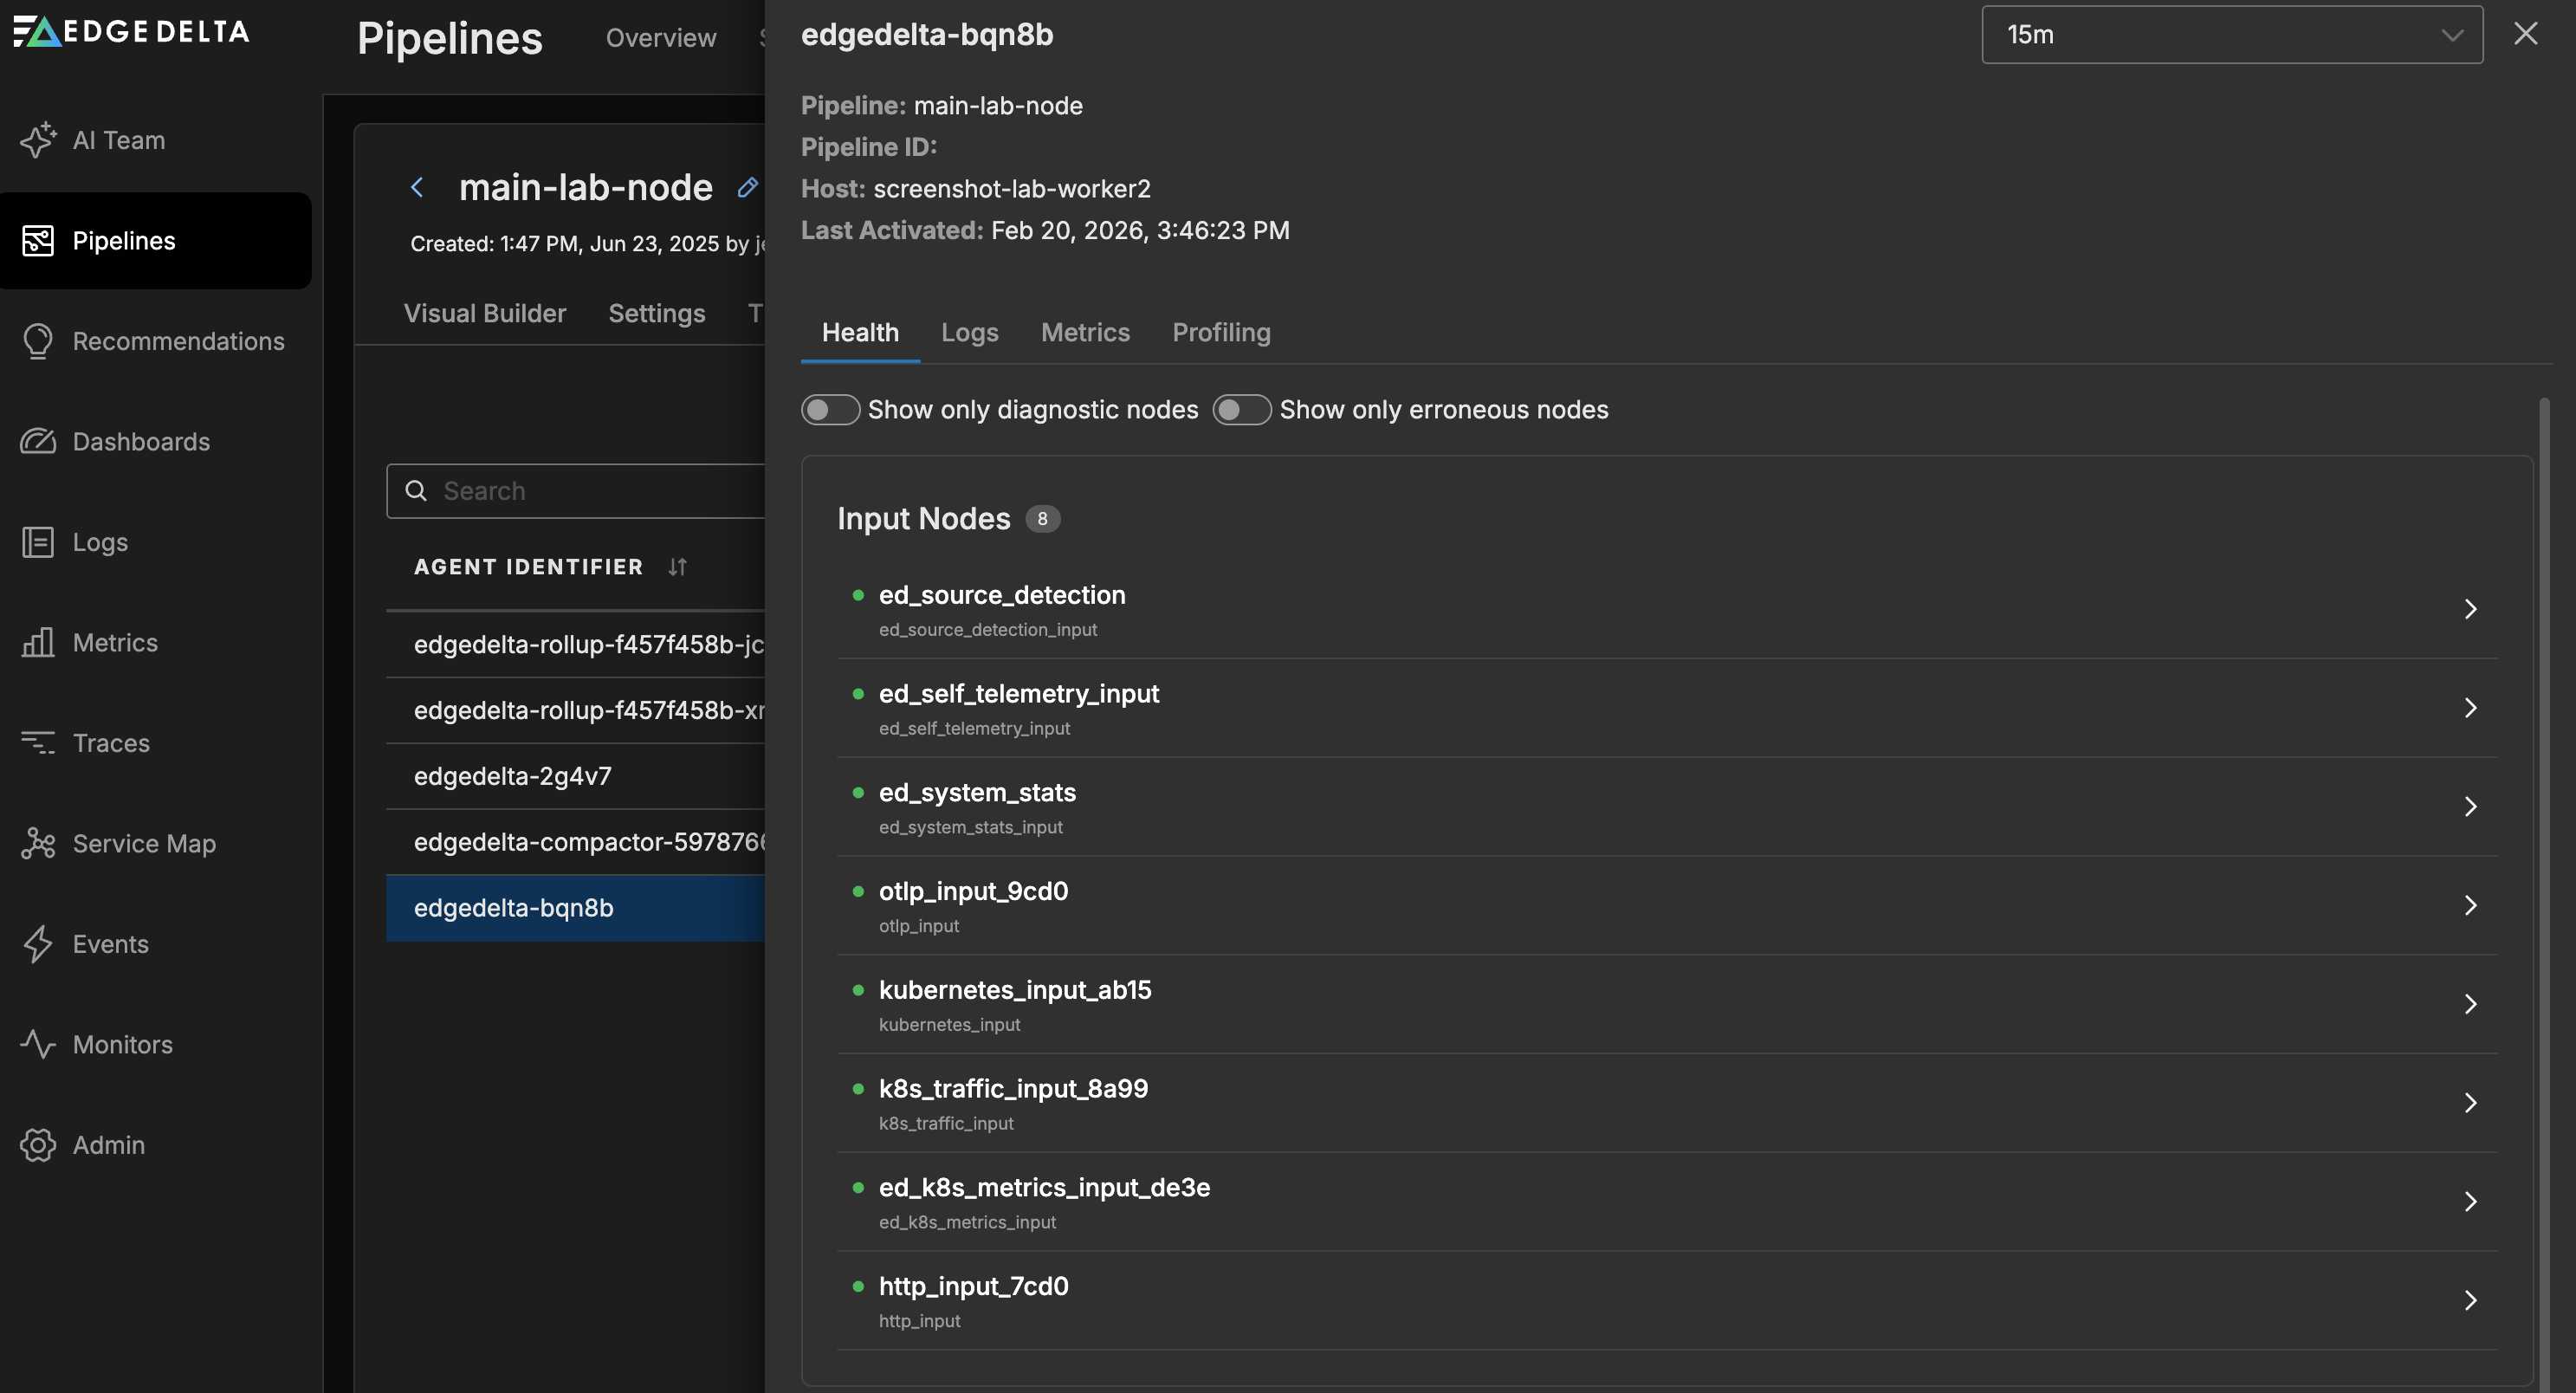
Here you can examine the health metrics for the agent internal components.
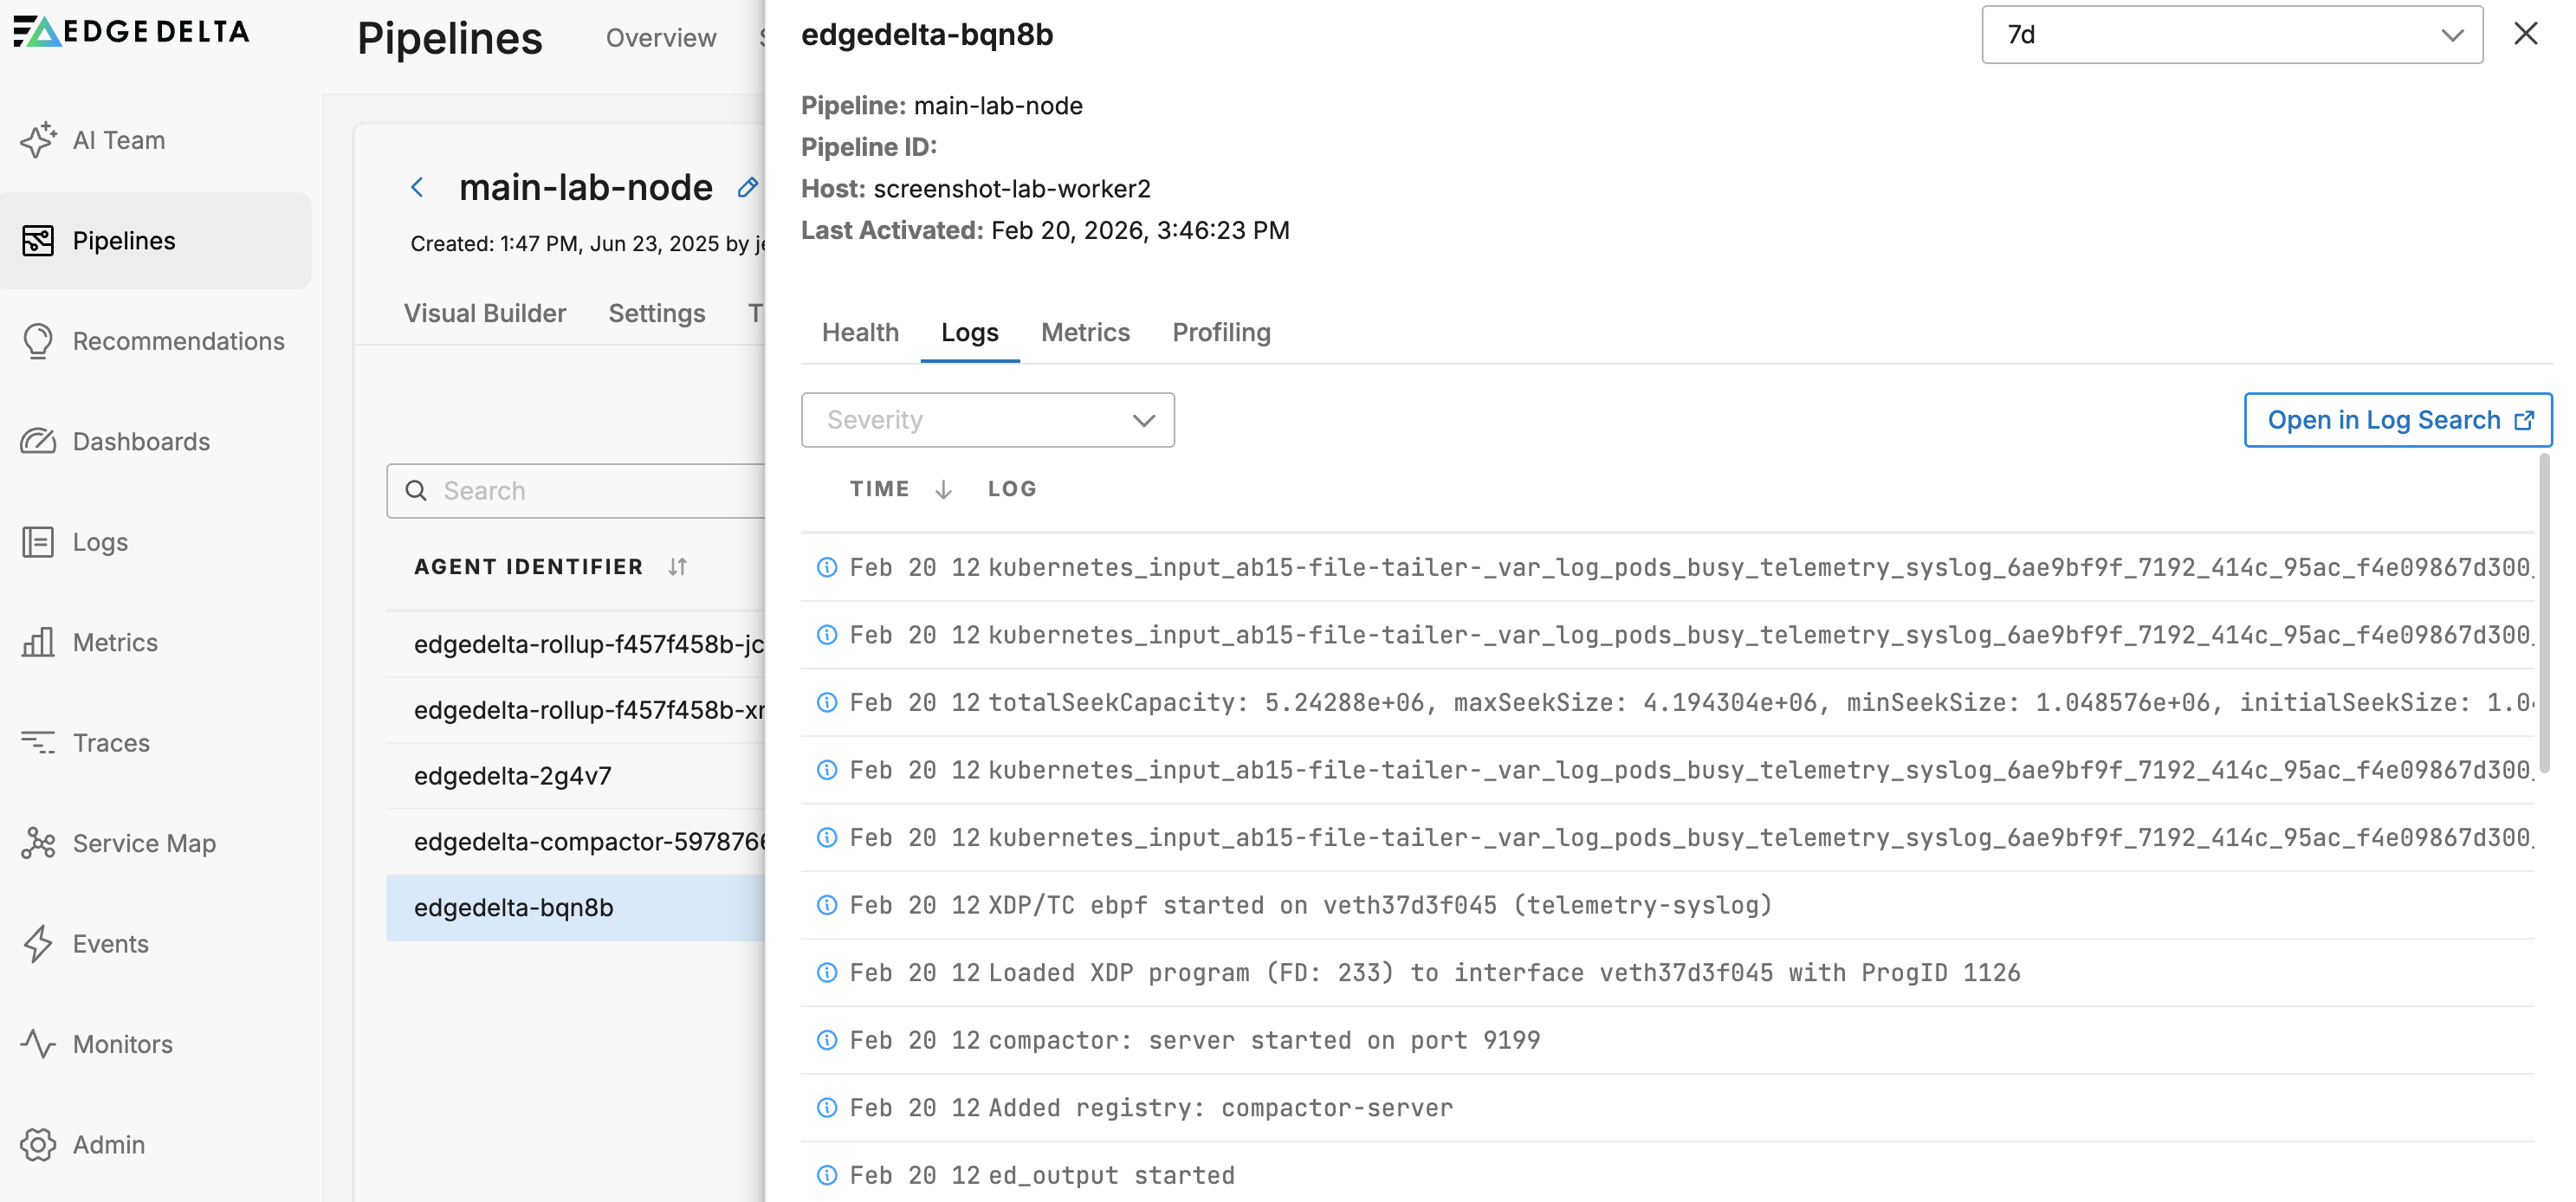
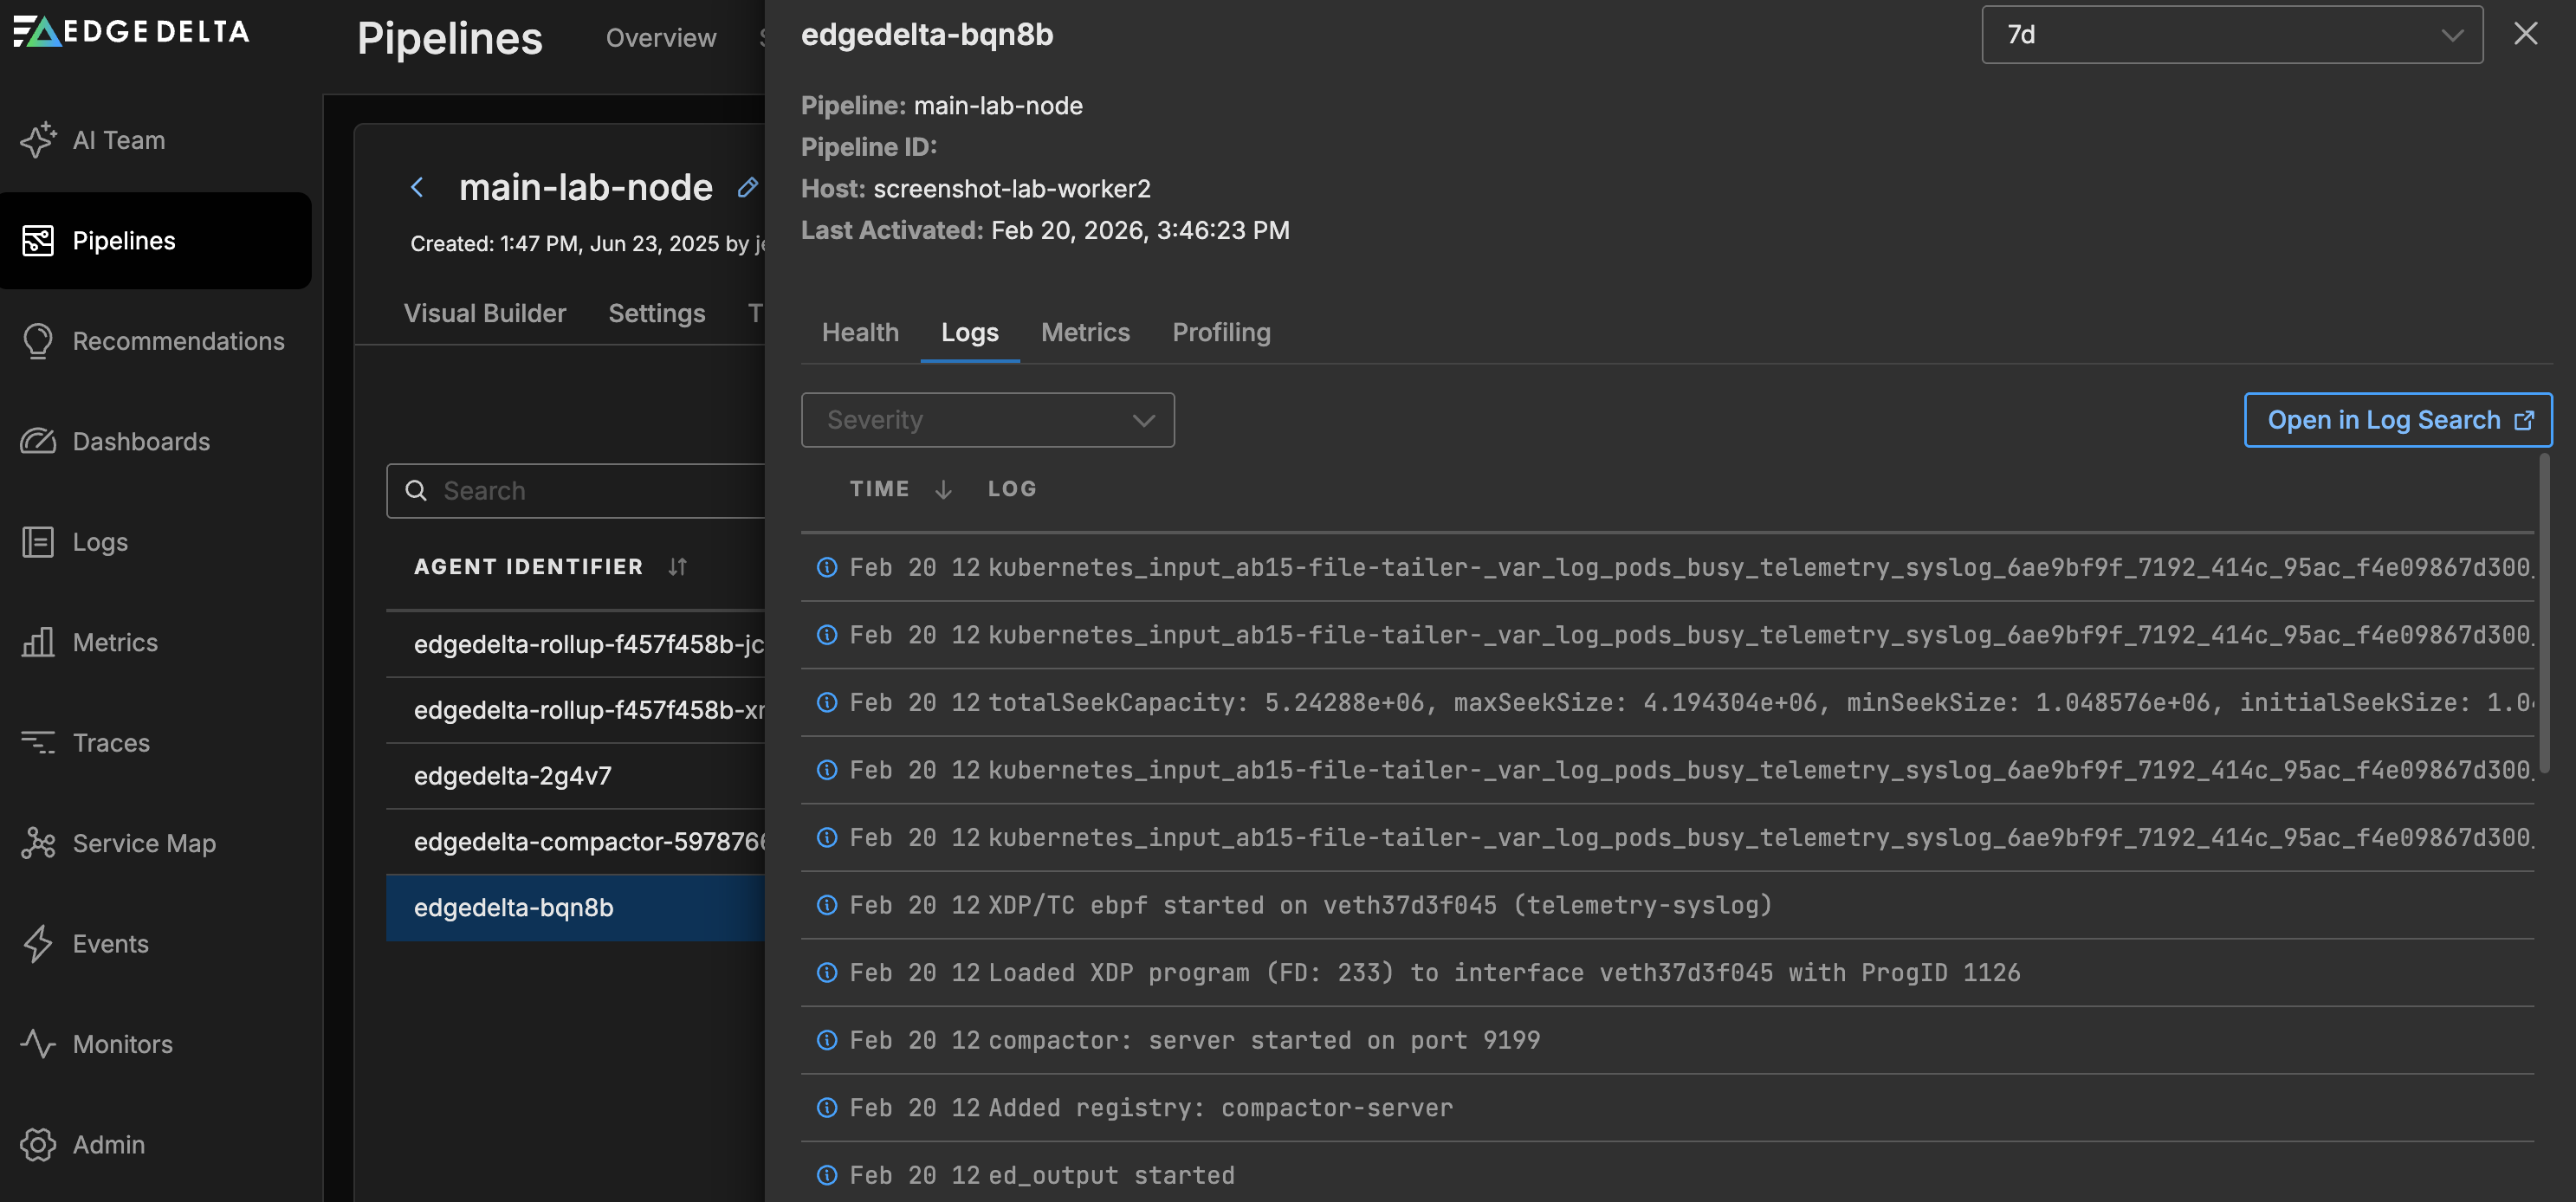
On the Logs tab you can view internal logs generated by that agent:
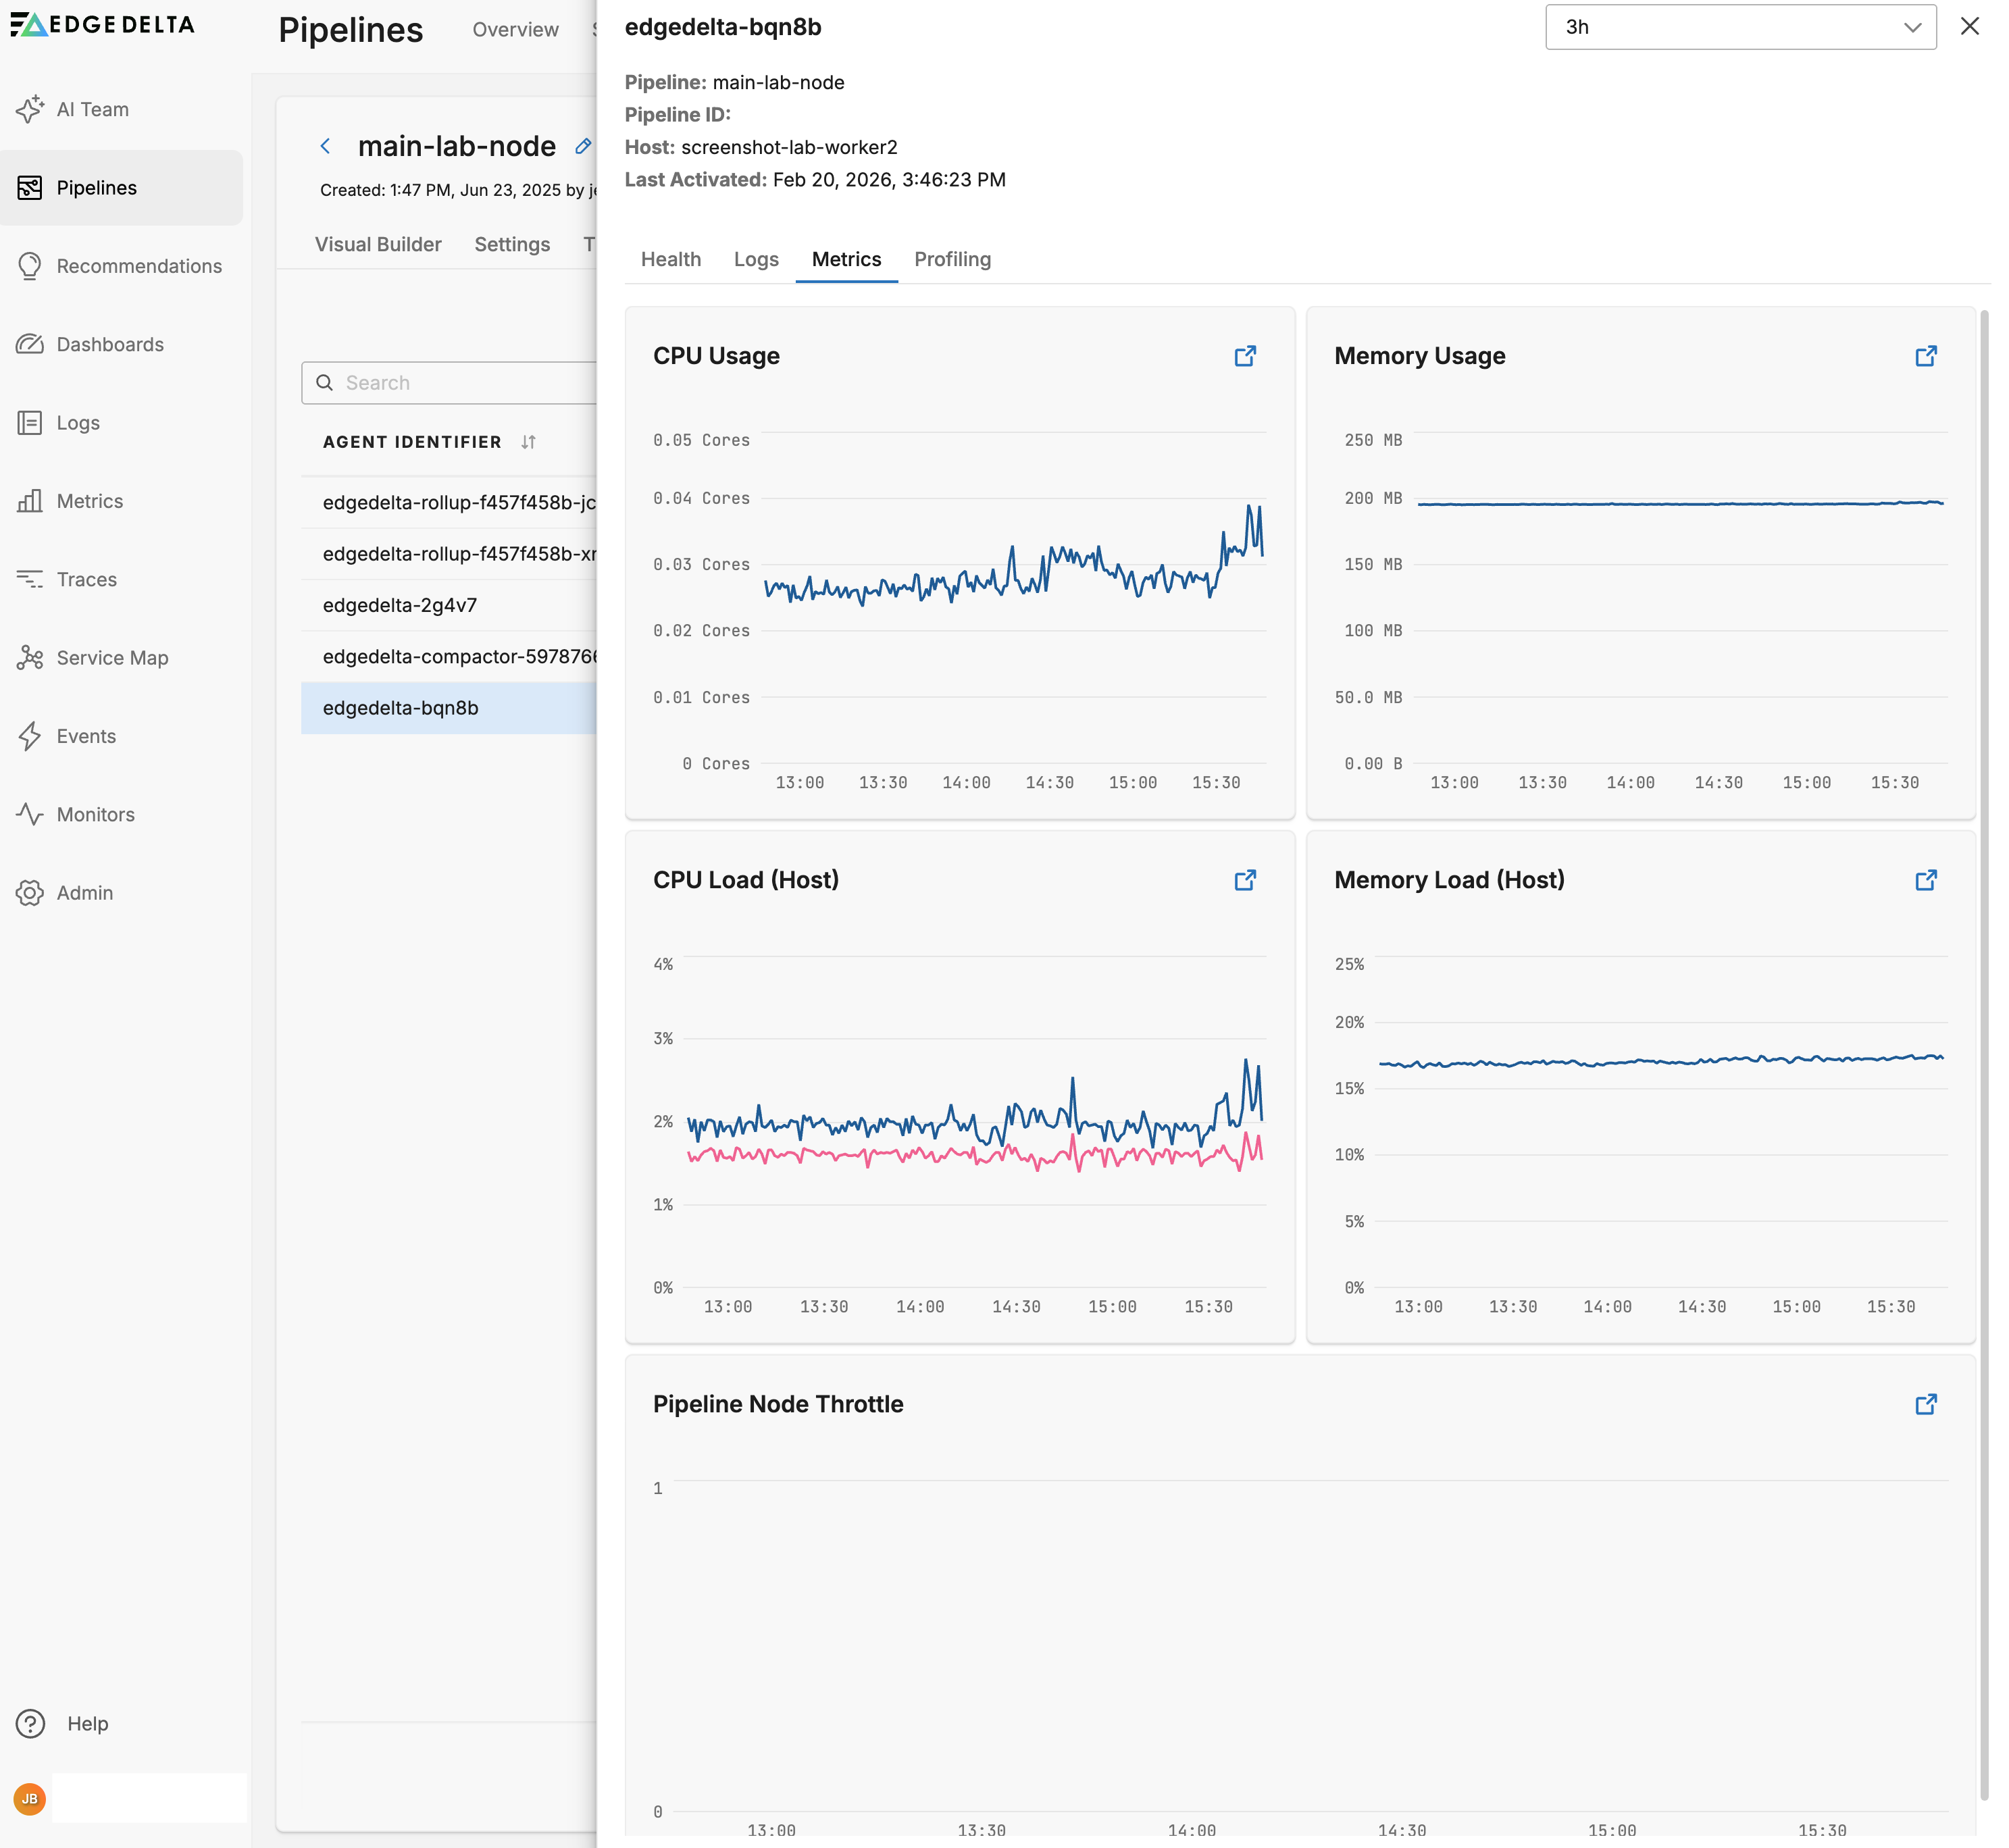
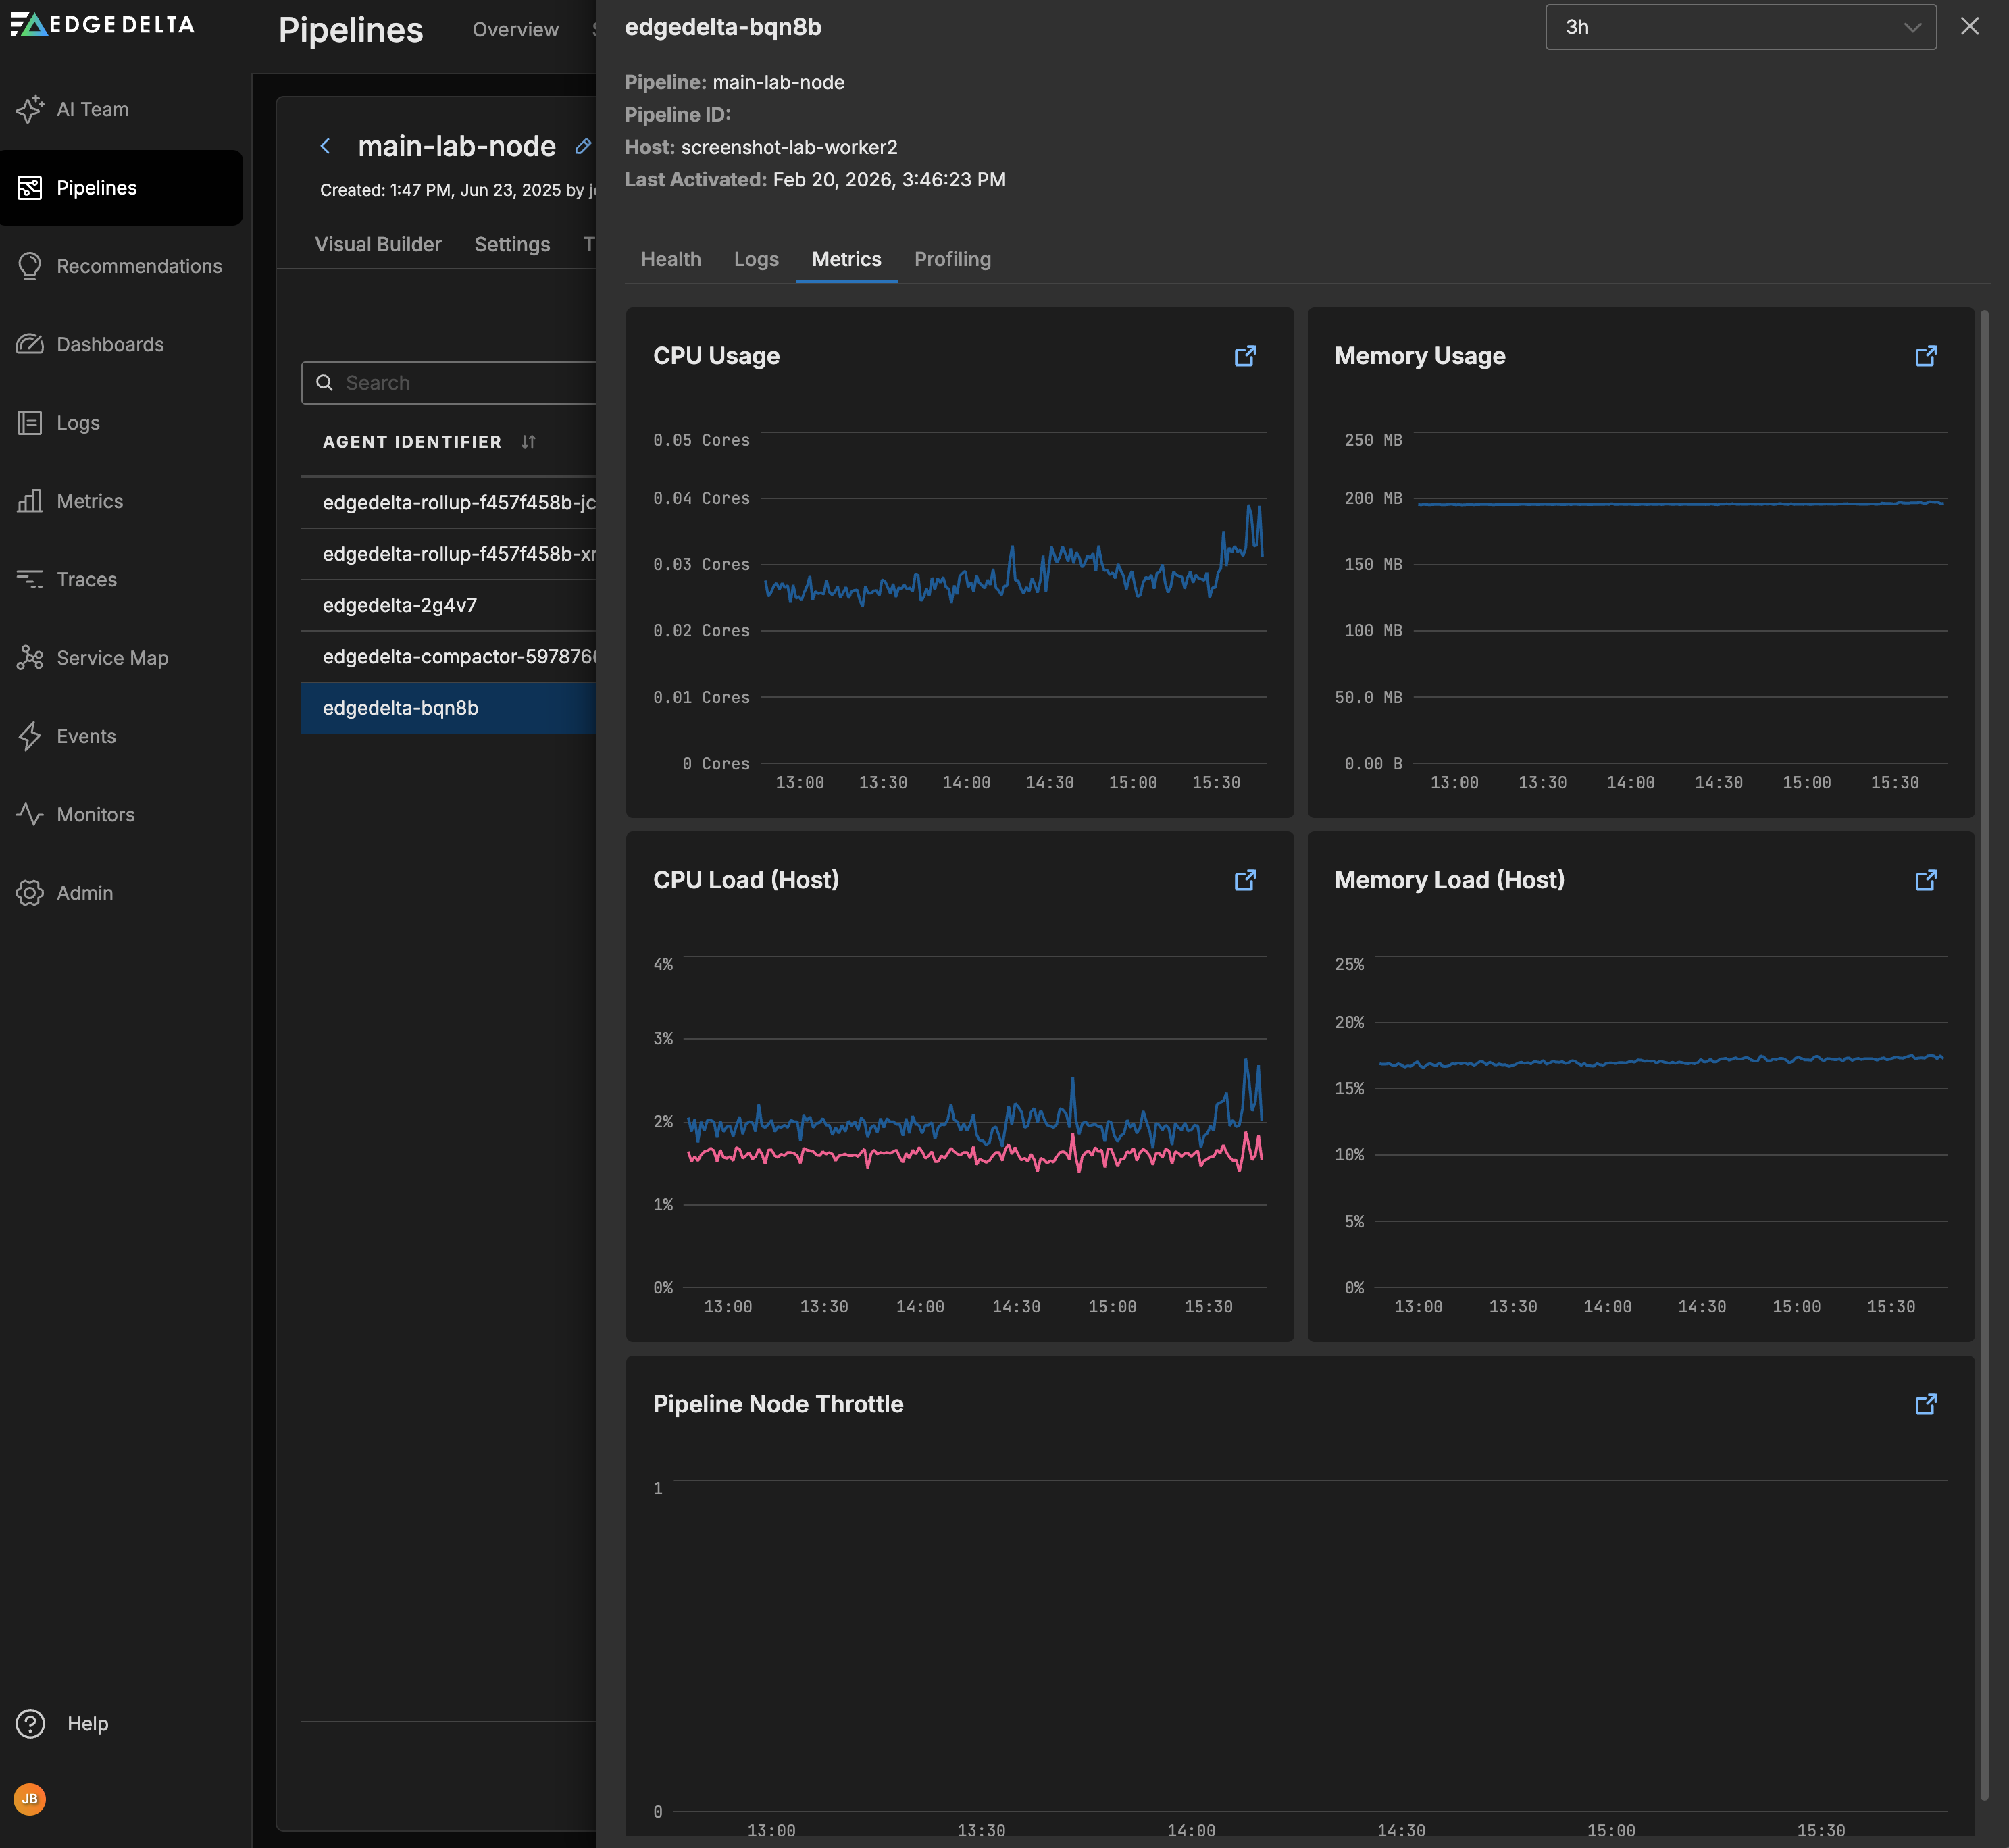
The metrics tab shows resource usage for the agent, similar to viewing pipeline resource usage filtered by Host Name.
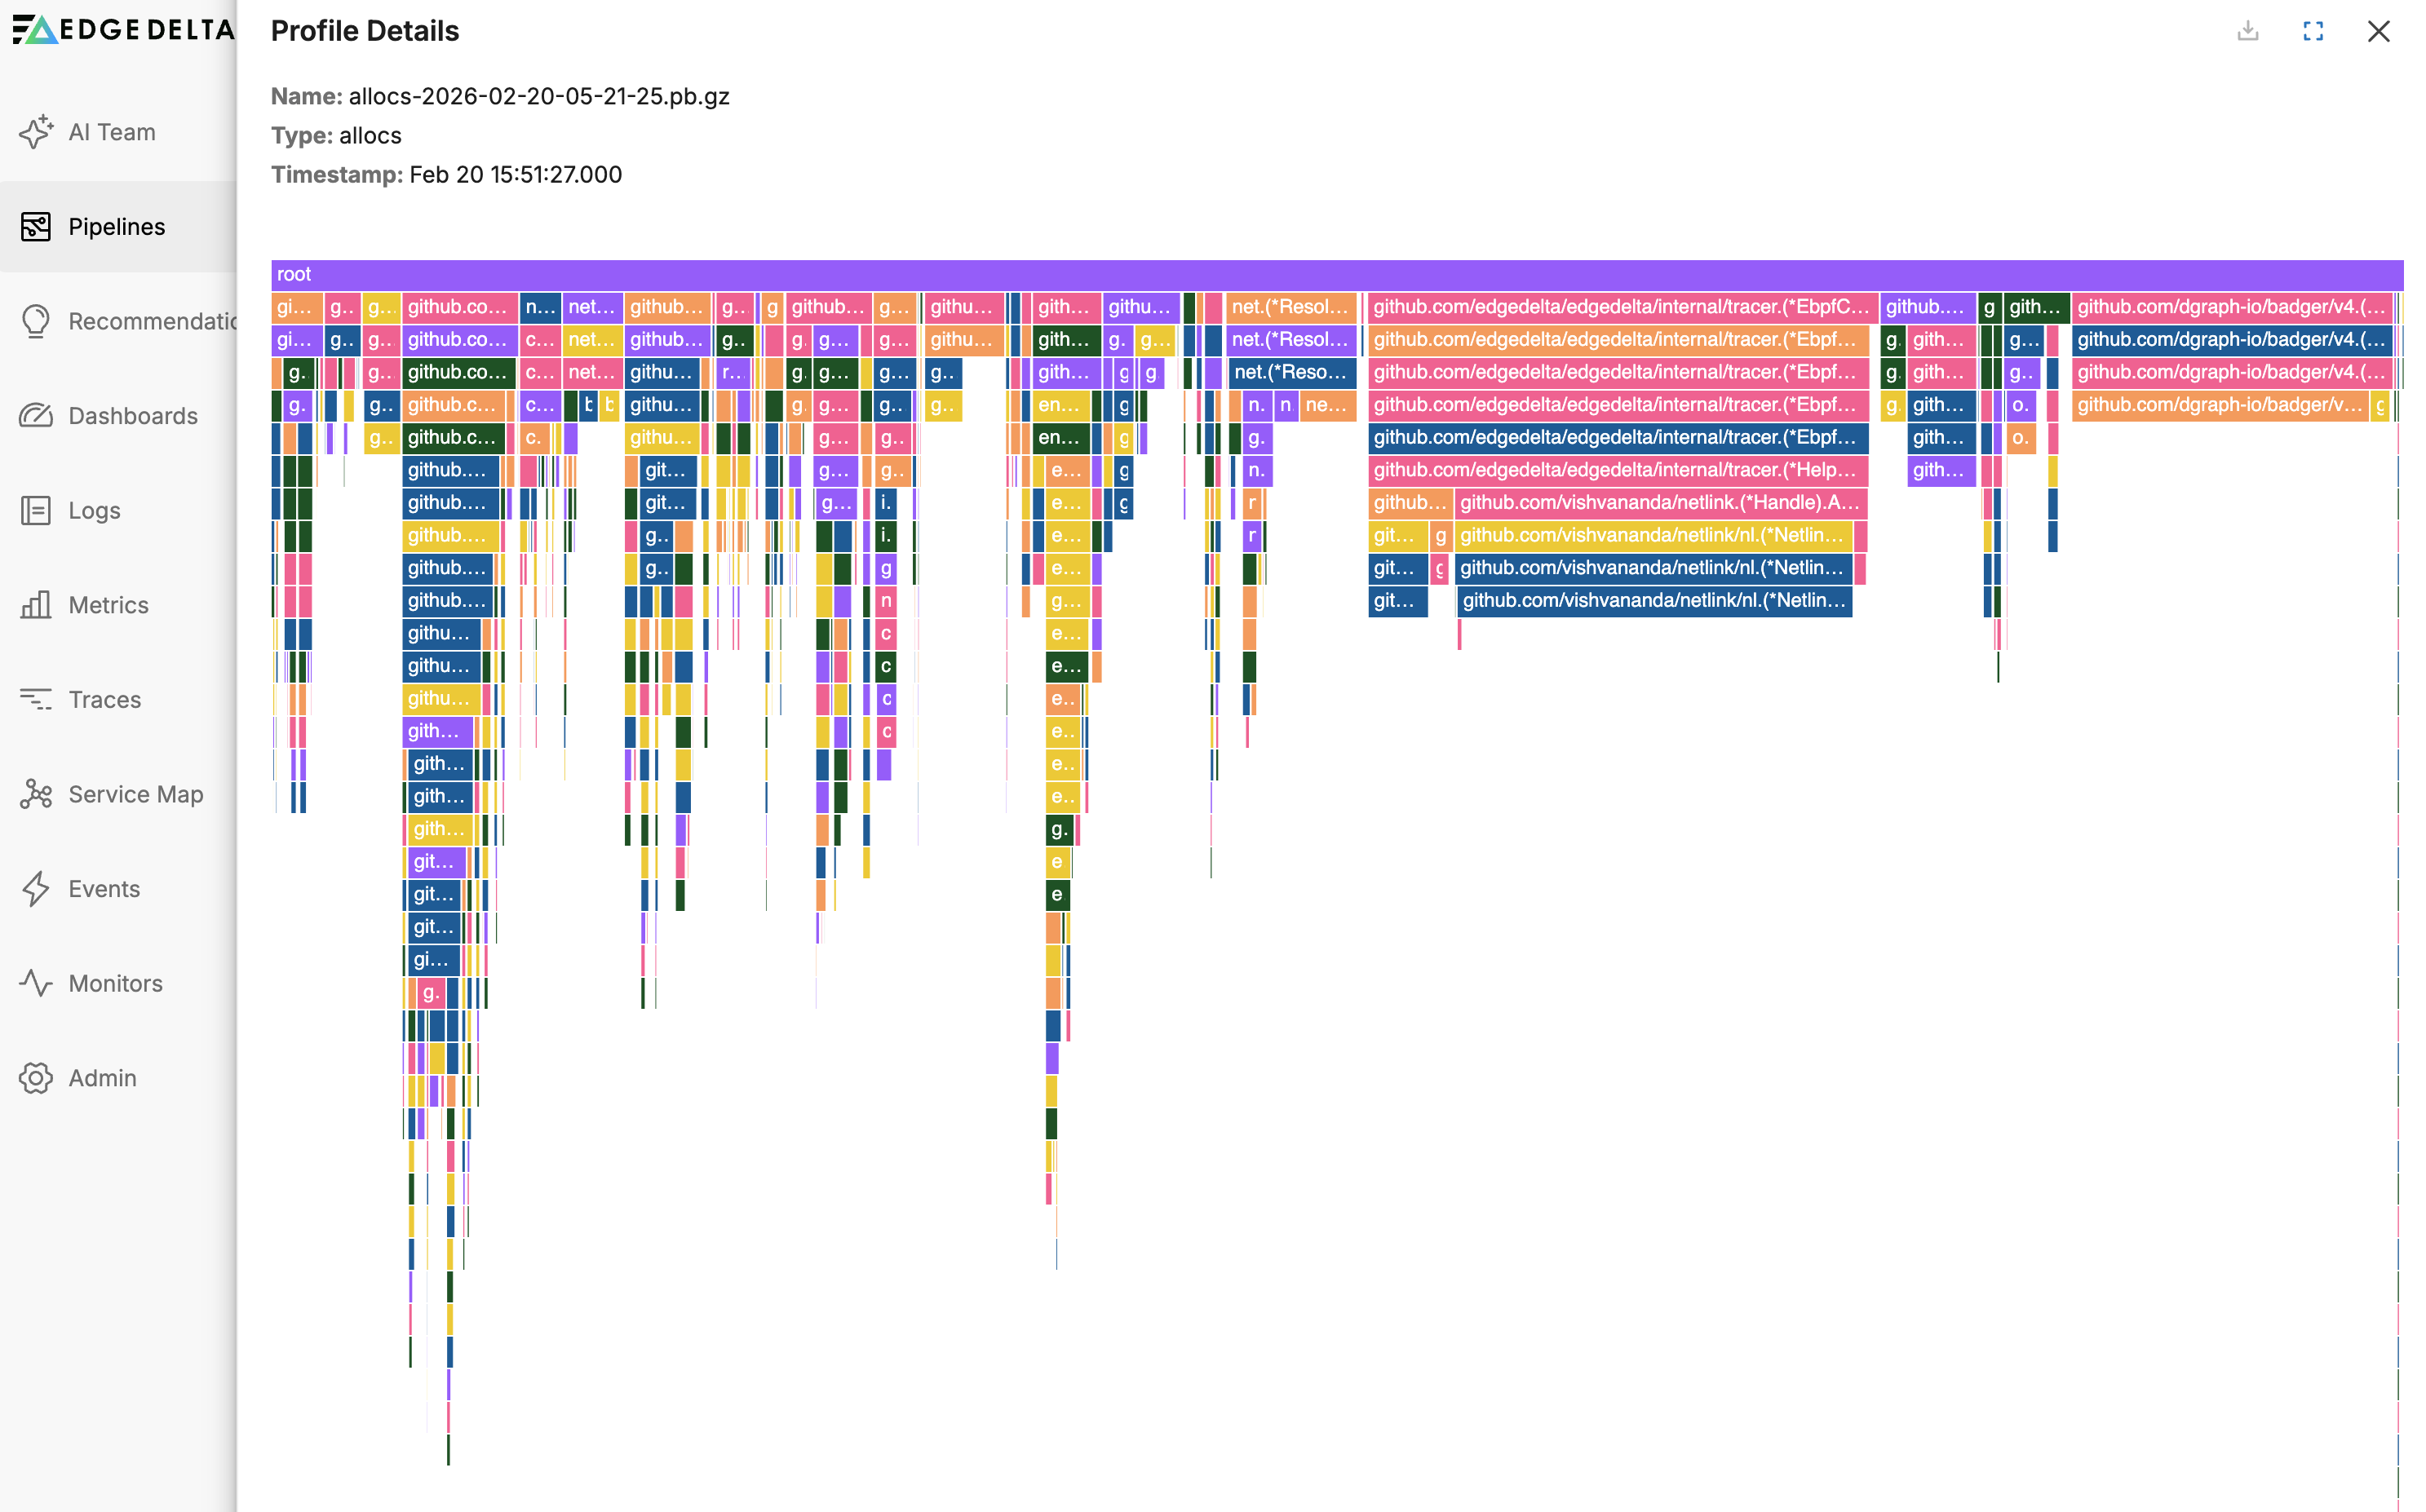
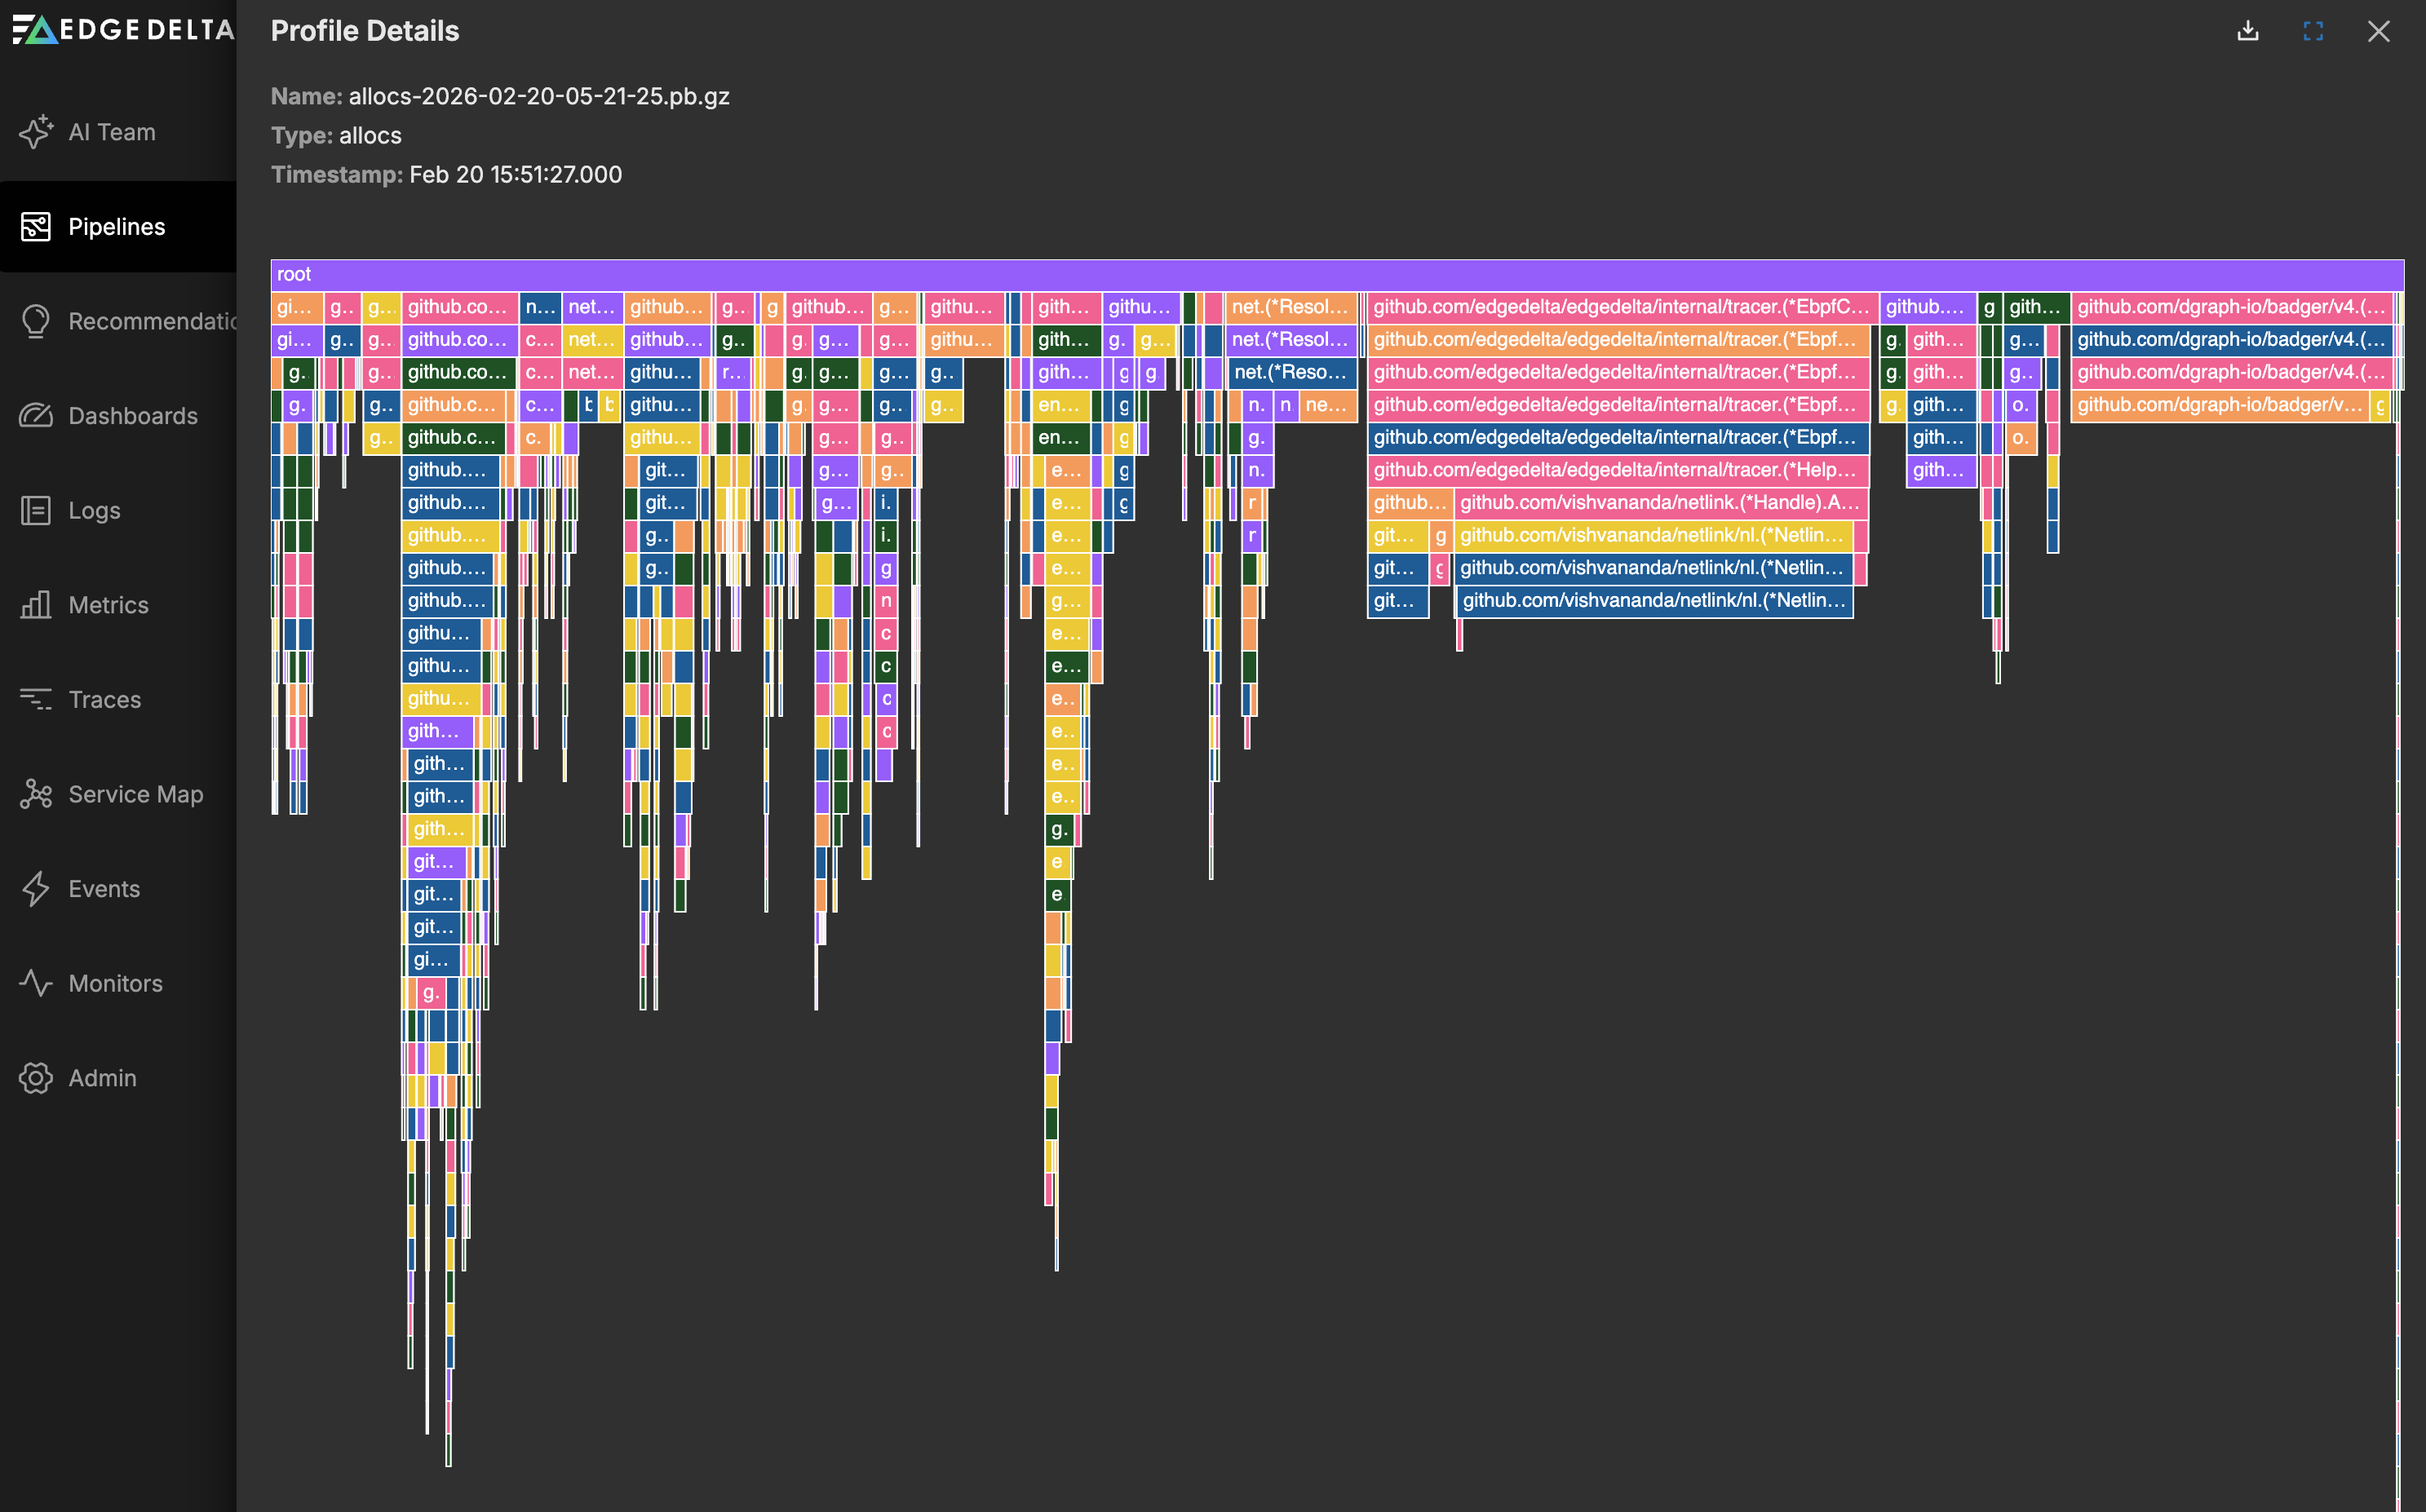
On the Profiling tab you can view the agent’s performance profile. Select a dimension to view the flame graph. See Performance Profiling Edge Delta Agents for more information.
Logs
Back on the Pipeline view page, the Logs tab shows logs generated by Edge Delta agents. You can filter them by Severity:
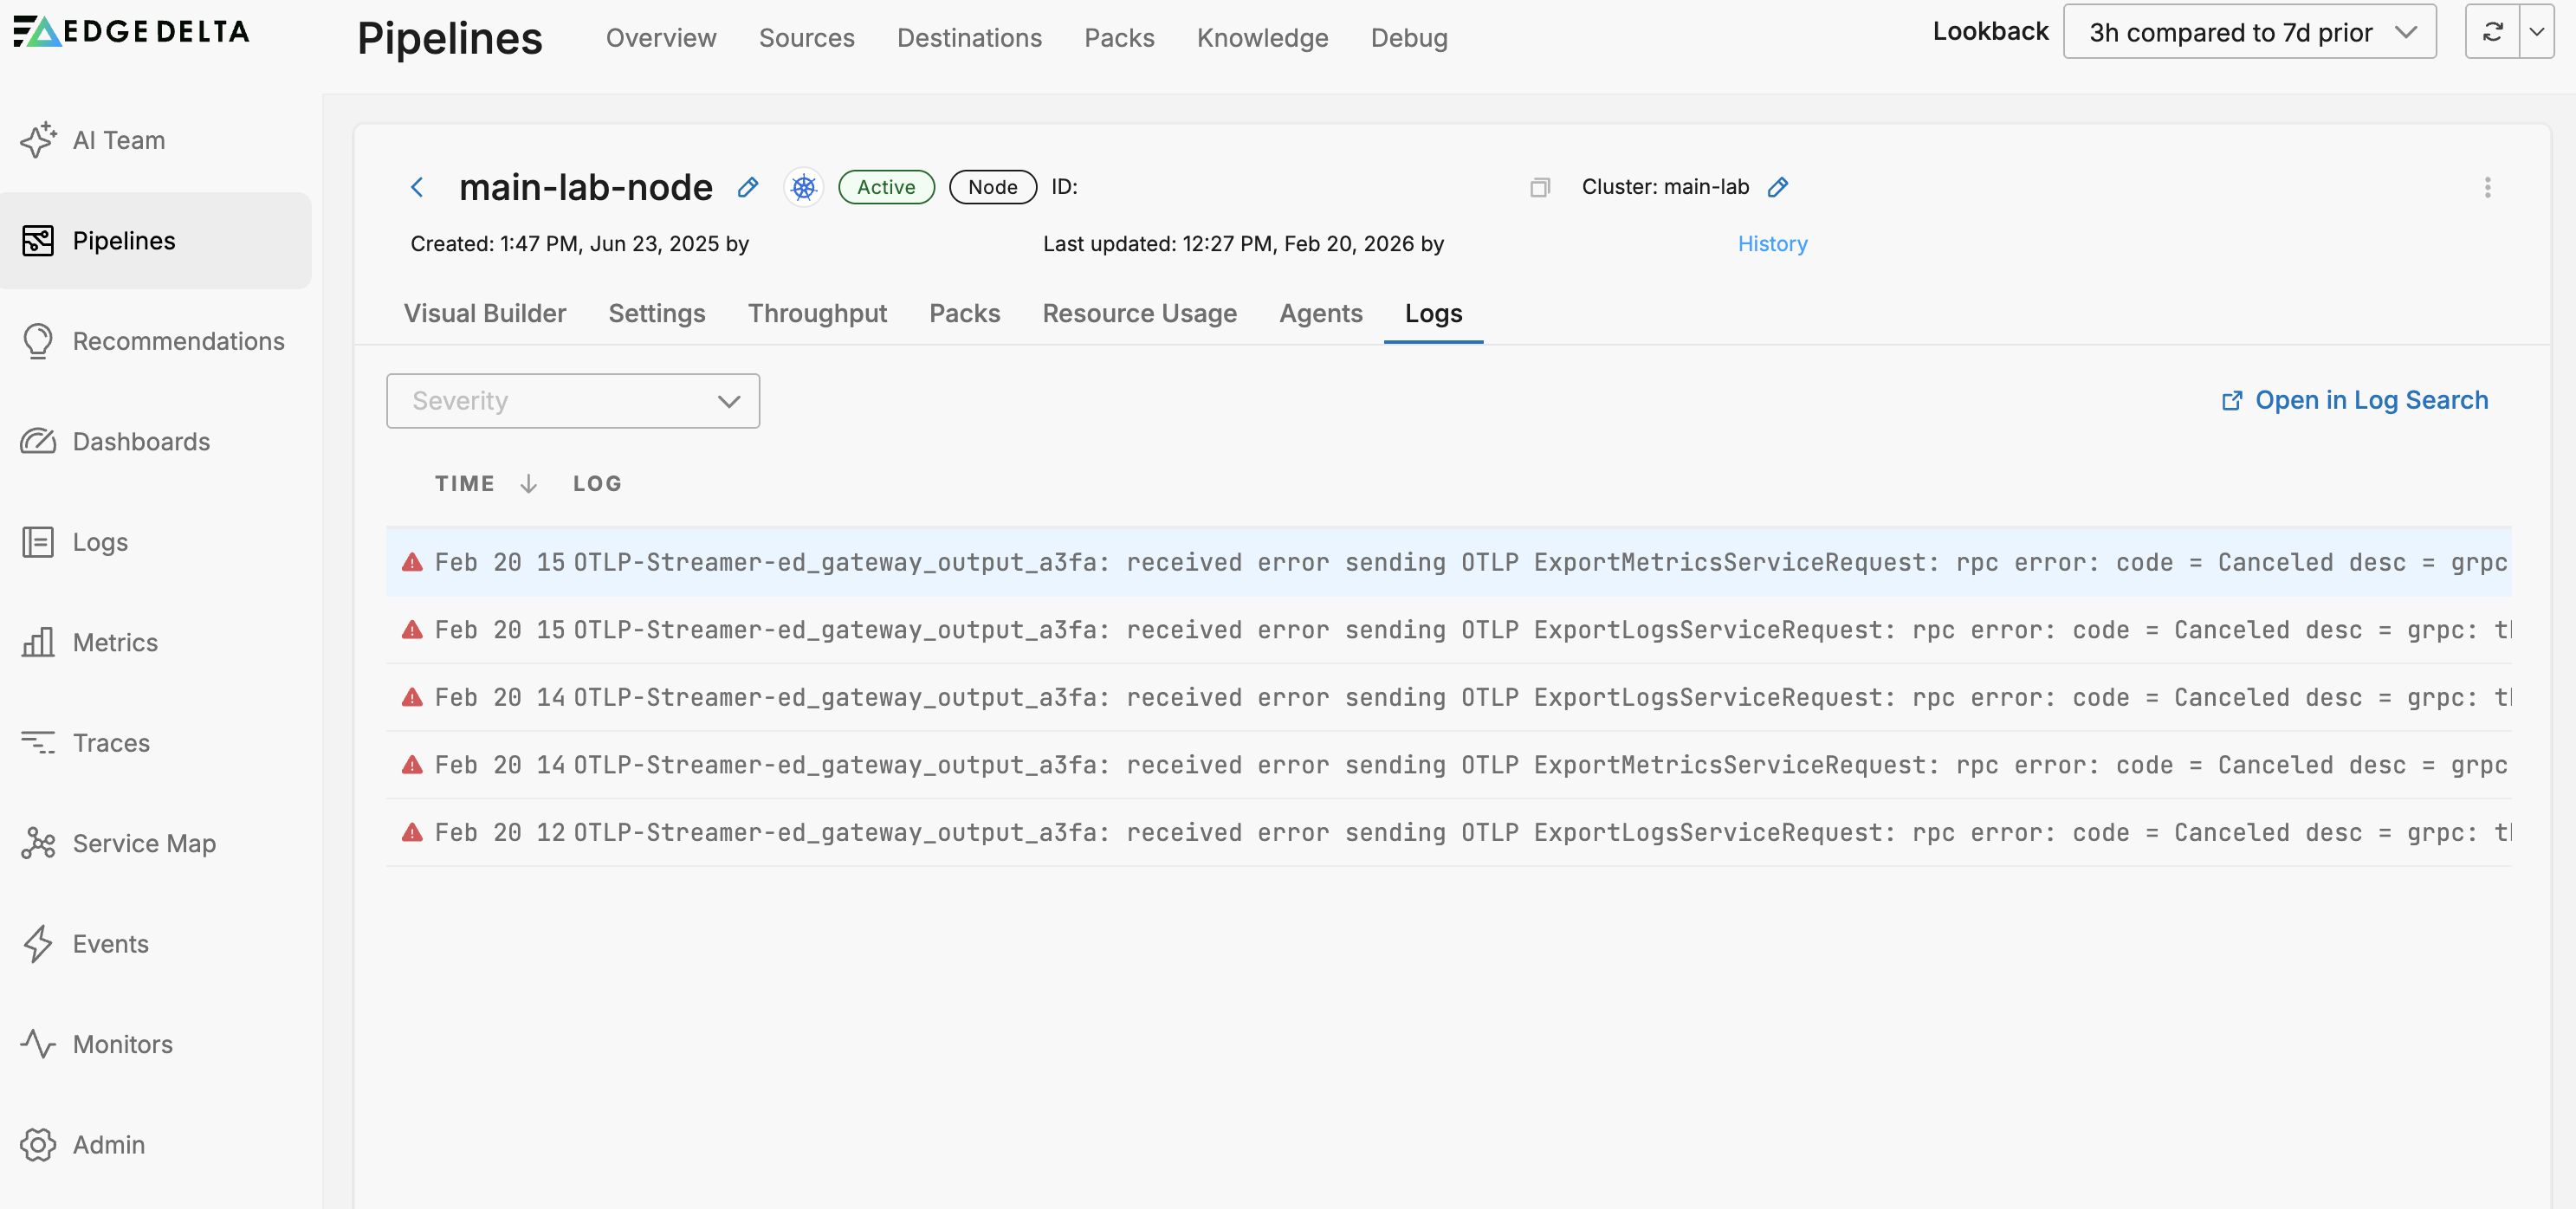
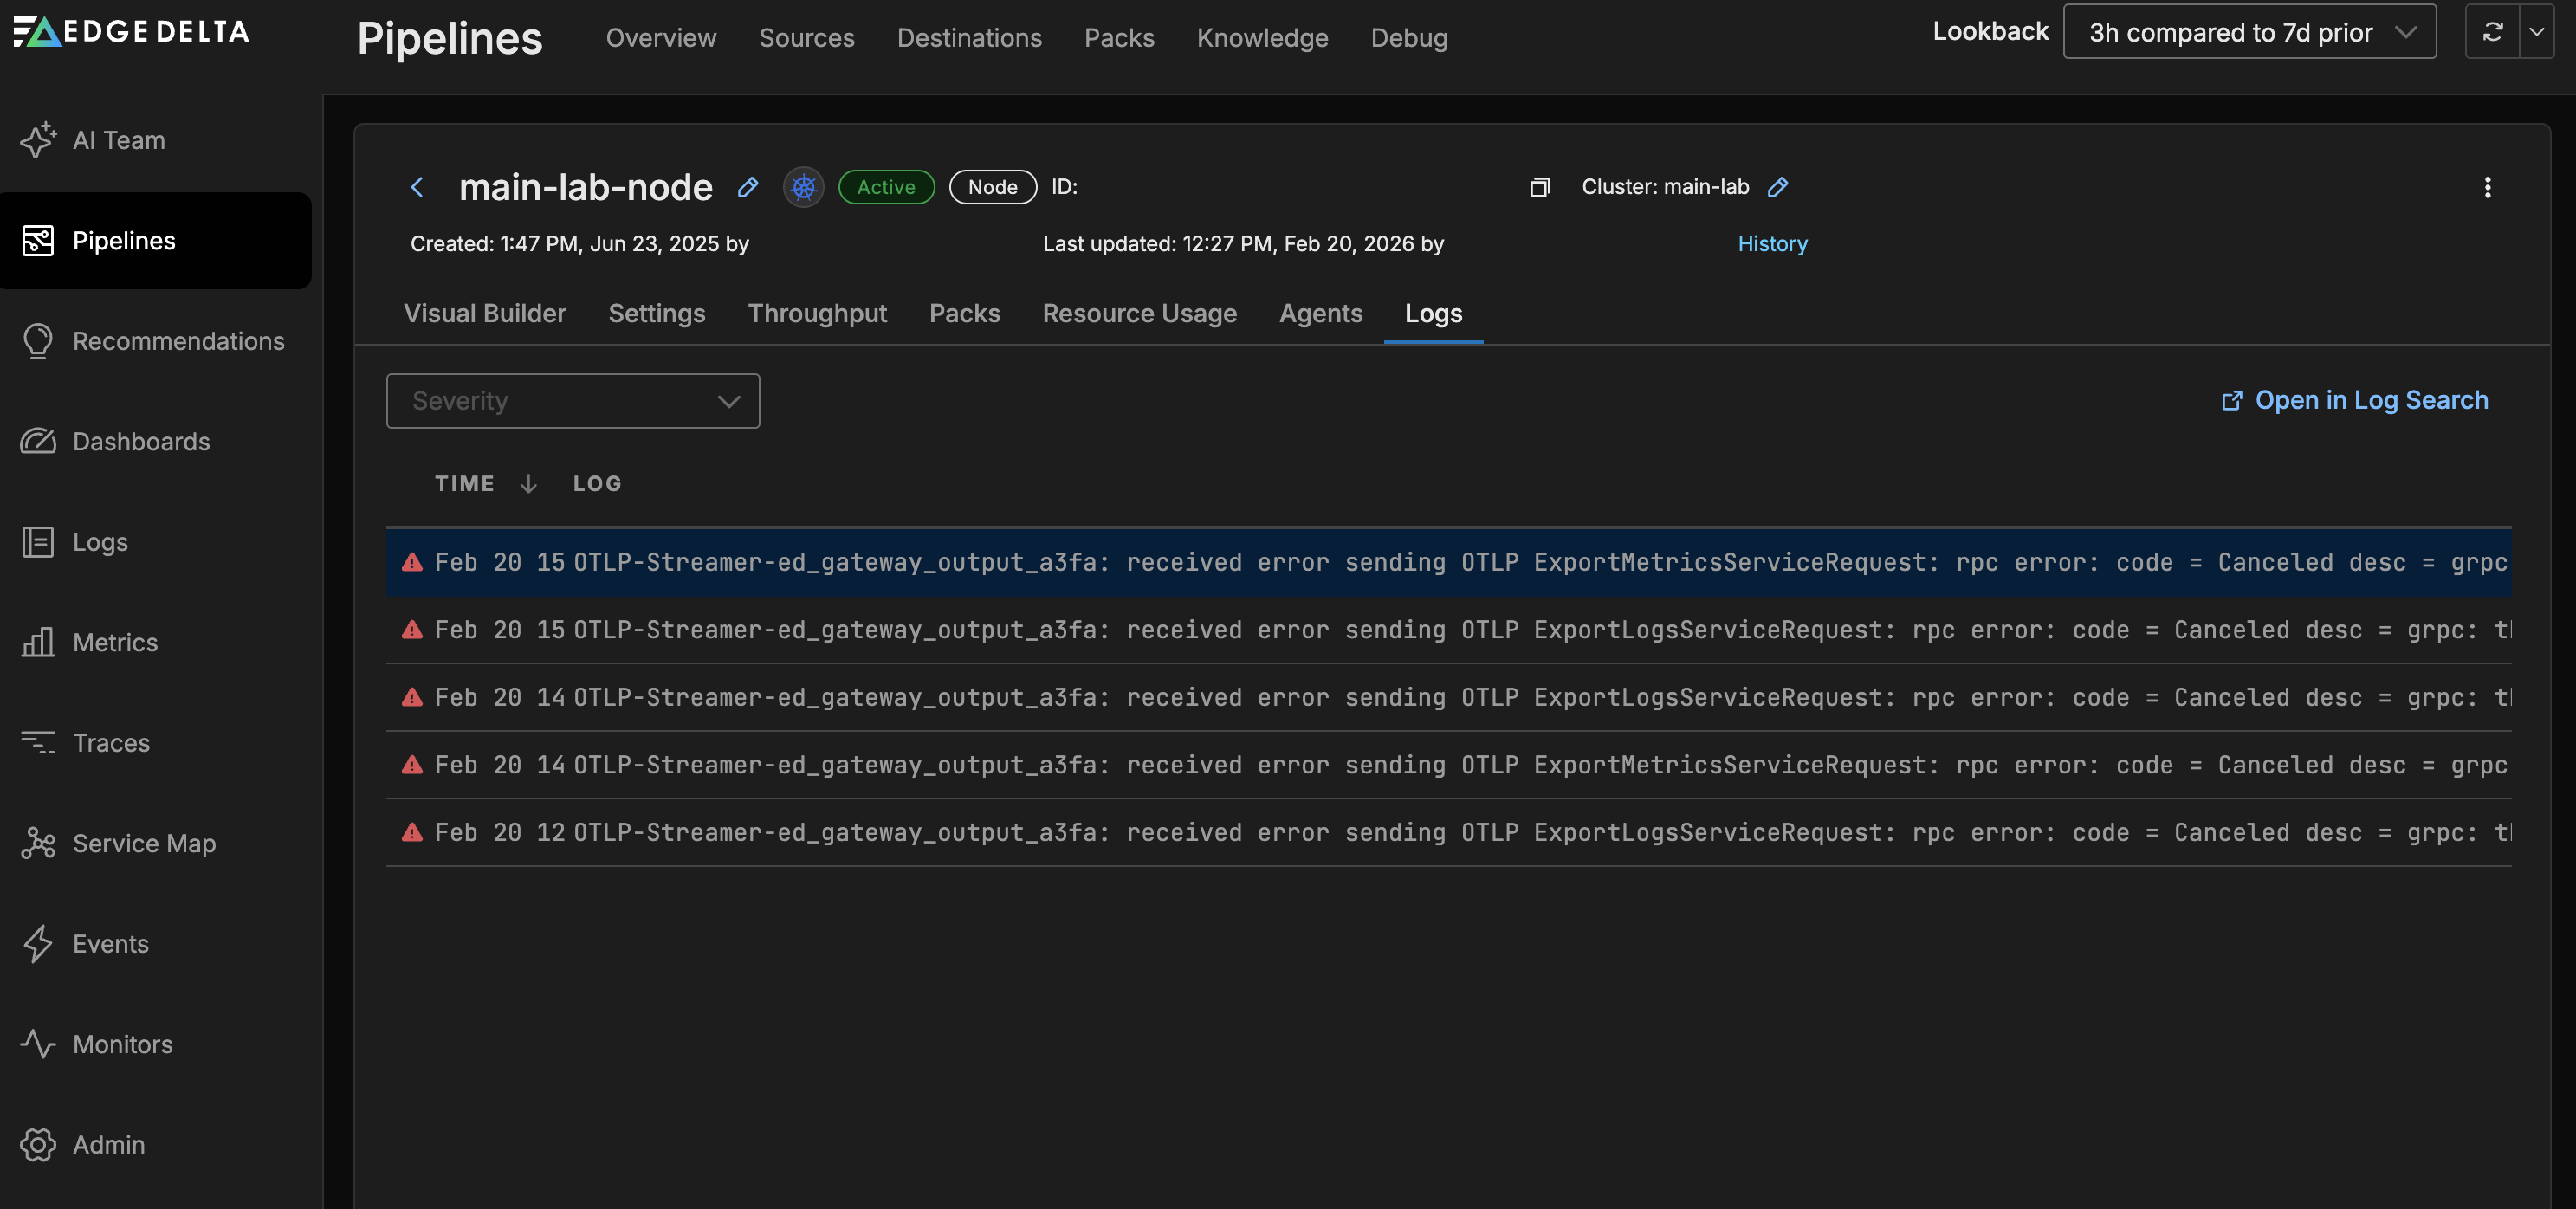
In this example, the agent logs a transient gRPC connection error from the gateway output node, which occurs when the gateway pods restart during a configuration update and existing connections are momentarily interrupted.