Send Data from Edge Delta to a Webhook
5 minute read
Overview
The Webhook node sends triggered alerts to a webhook based on an incoming signal. These signals can be generated by a threshold node on the edge. Alternatively, you can create a webhook integration, which can be triggered by a monitor in the backend, and which does not need to be deployed in a particular pipeline.
For a complete reference of available template variables and functions, see Webhook Template Variables Reference.
See Send Events from an Edge Delta Pipeline to Slack for an example using Slack.
To create a webhook node:
- Click Add Node.
- Select Webhook Destination.
- Specify the webhook endpoint.
Example 1
This example uses a webhook node. It follows on from configure a threshold node. This example requires a Teams channel endpoint.
- Enter a suppression window of
20m
. This prevents the notification channel from being flooded for 20 minutes after receiving the first alert. - Expand Advanced Settings and enter the following Payload:
{"text": "More than 1% of NGINX traffic is a 5xx error in the past minute."}
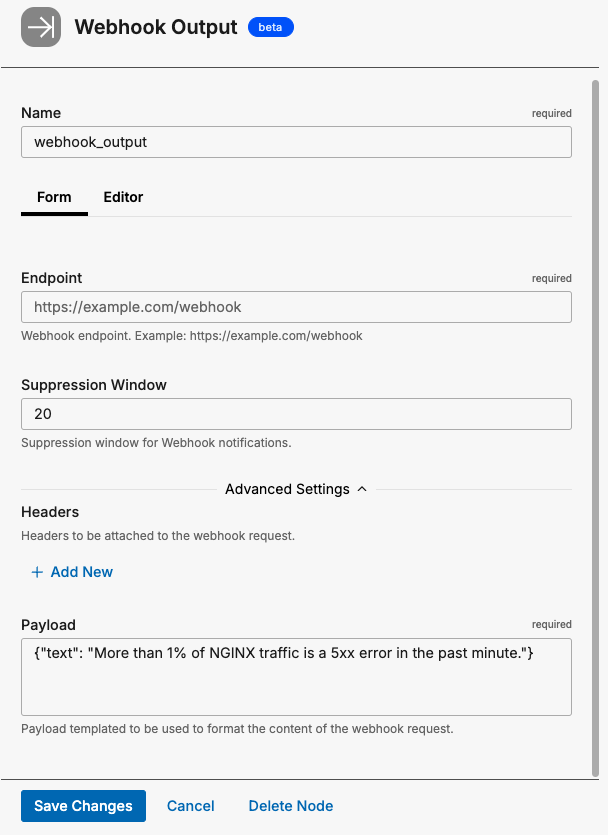
- Click Save Changes.
- Connect the Threshold node’s output to the Webhook node.
- Click Review Changes.
- Click Save Changes.
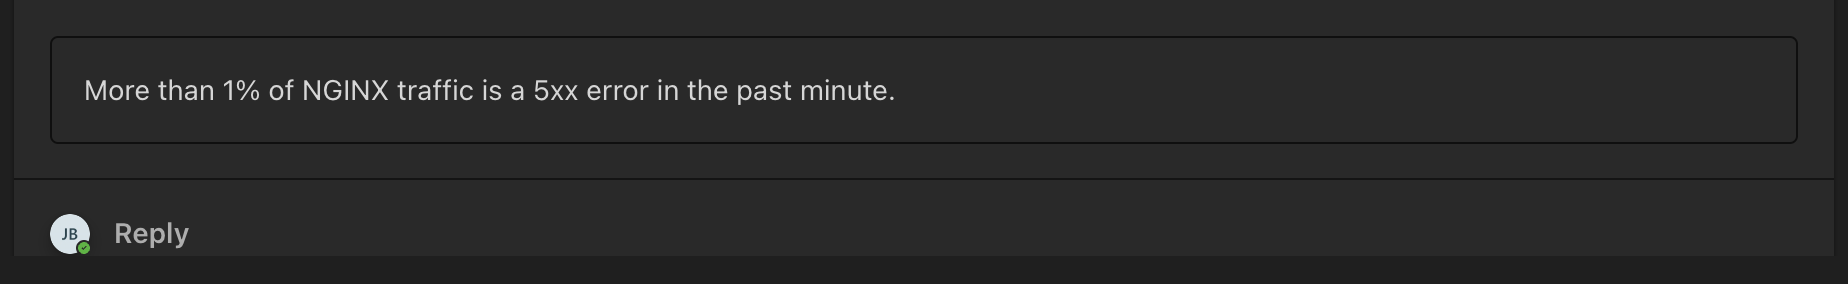
If the threshold is met a notification is sent to the application consuming the webhook:

Example 2
In this example, a rich payload is sent to a webhook node with dynamic content pulled from the alert fields. This example requires a Teams channel endpoint.
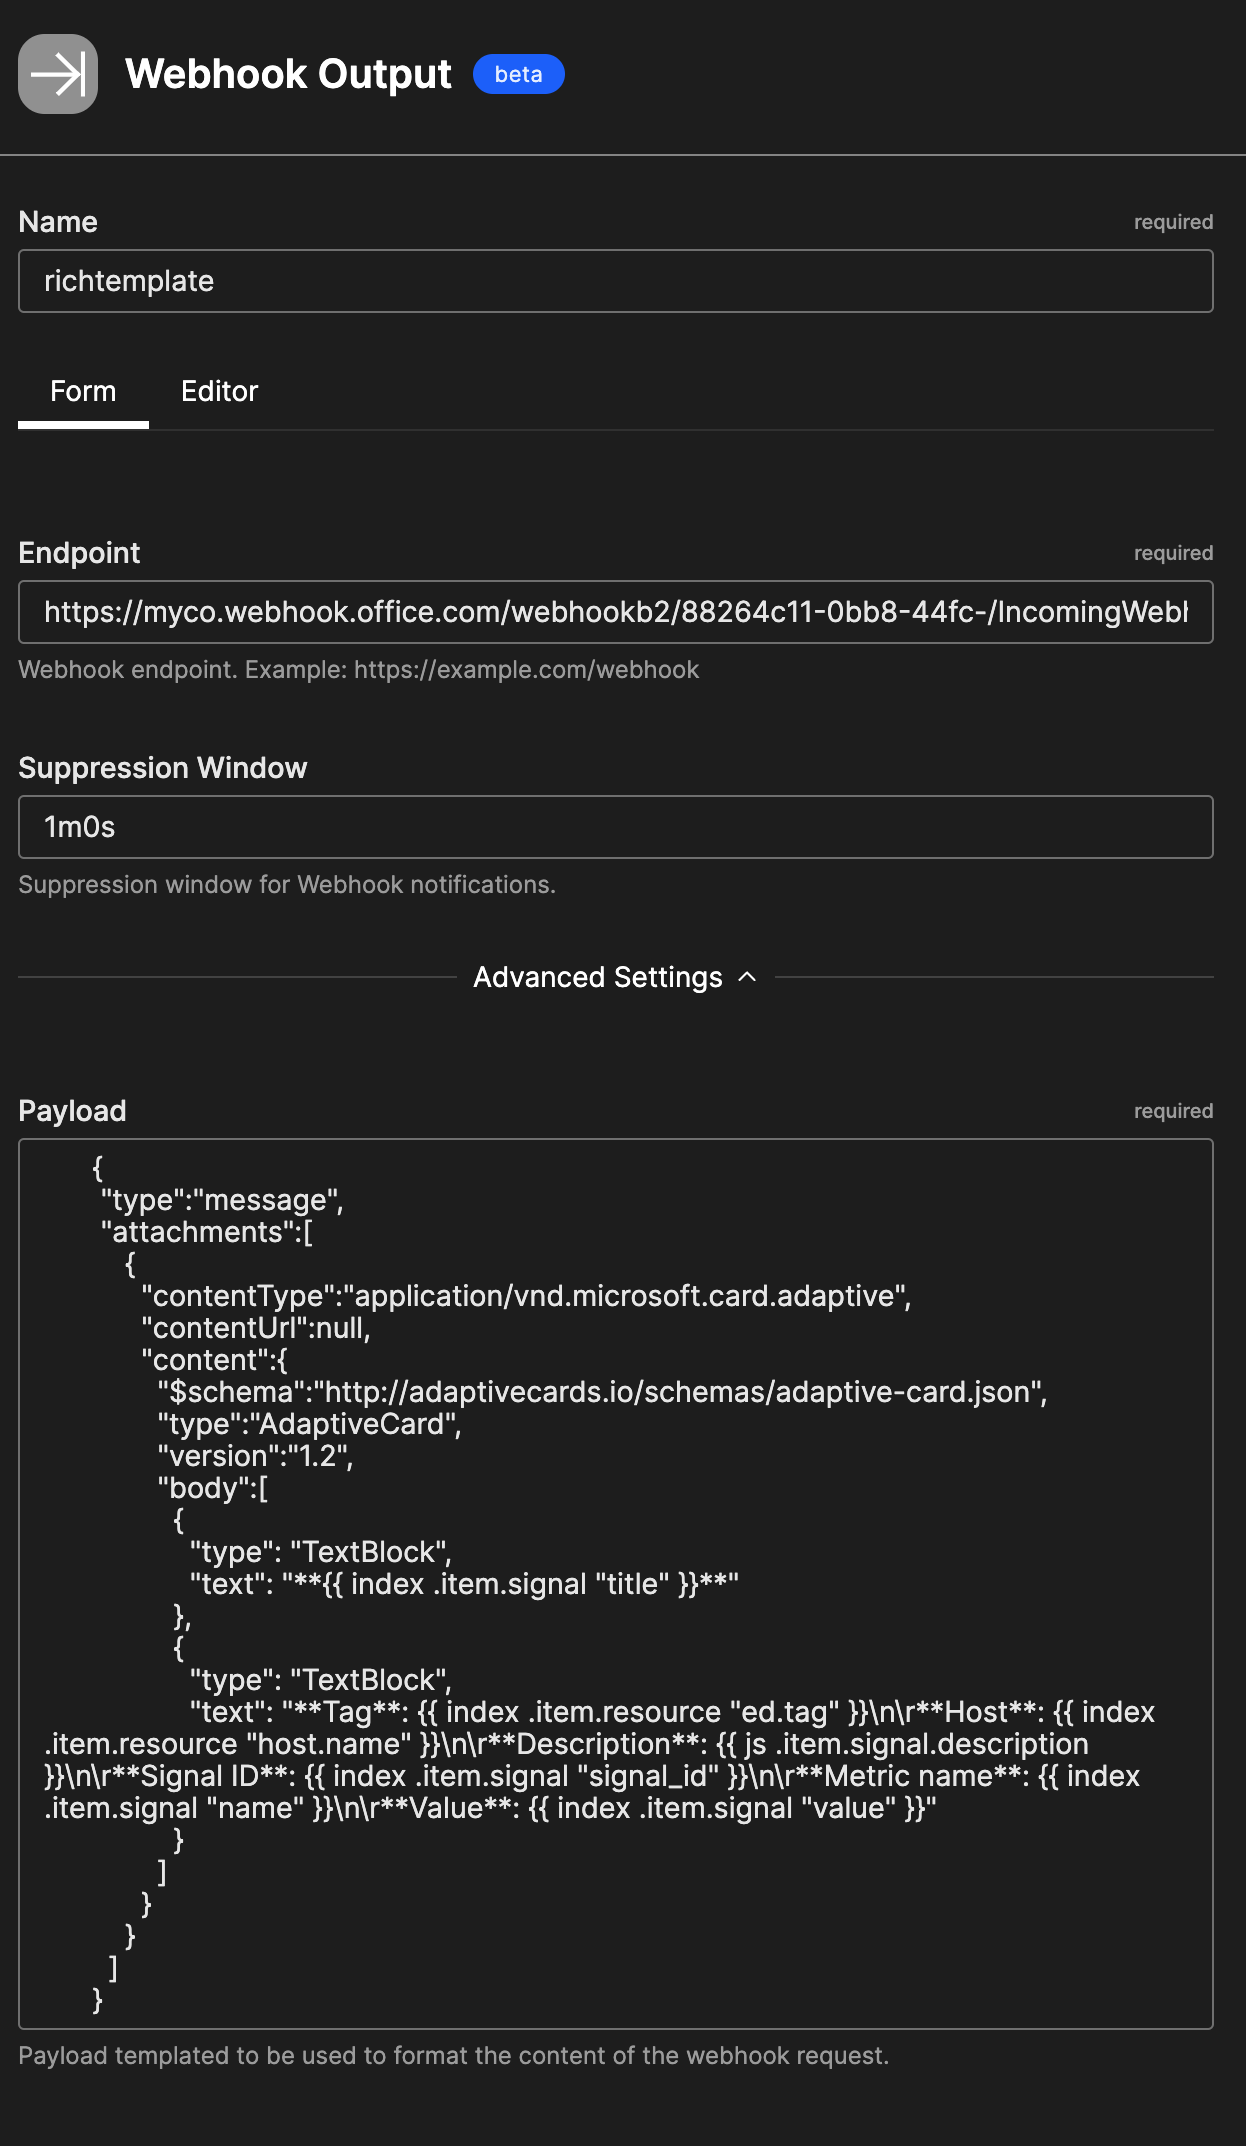
- name: richtemplate
type: webhook_output
endpoint: https://myco.webhook.office.com/webhookb2/88264c11-0bb8-44fc-/IncomingWebhook/1a2b3c4d5e6f/abcdef123456
suppression_window: 1m0s
payload: " {\n \"type\":\"message\",\n \"attachments\":[\n {\n
\ \"contentType\":\"application/vnd.microsoft.card.adaptive\",\n \"contentUrl\":null,\n
\ \"content\":{\n \"$schema\":\"http://adaptivecards.io/schemas/adaptive-card.json\",\n
\ \"type\":\"AdaptiveCard\",\n \"version\":\"1.2\",\n
\ \"body\":[\n {\n \"type\": \"TextBlock\",\n
\ \"text\": \"**{{ index .item.signal \"title\" }}**\"\n },\n
\ {\n \"type\": \"TextBlock\",\n \"text\":
\"**Tag**: {{ index .item.resource \"ed.tag\" }}\\n\\r**Host**: {{ index .item.resource
\"host.name\" }}\\n\\r**Description**: {{ js .item.signal.description }}\\n\\r**Signal
ID**: {{ index .item.signal \"signal_id\" }}\\n\\r**Metric name**: {{ index .item.signal
\"name\" }}\\n\\r**Value**: {{ index .item.signal \"value\" }}\"\n }\n
\ ]\n }\n }\n ]\n } "
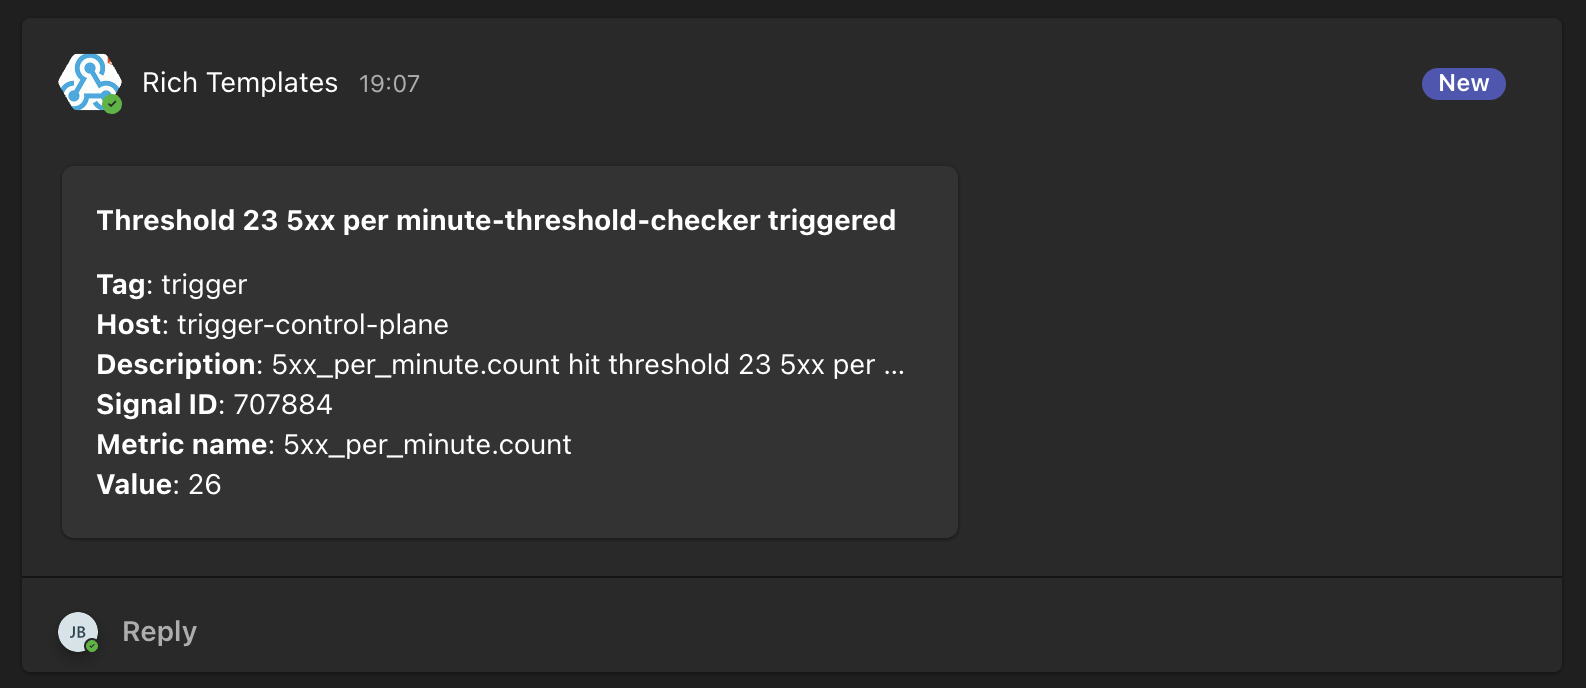
The payload is rendered in the receiving application, in this instance Microsoft Teams:

Example 3: ServiceNow Incident Creation
This example demonstrates creating incidents in ServiceNow when EdgeDelta alerts are triggered. ServiceNow is a popular IT Service Management (ITSM) platform used for incident management and workflow automation.
Prerequisites
- ServiceNow Instance: You need access to a ServiceNow instance (e.g.,
instance.service-now.com
) - ServiceNow Credentials: A user account with permissions to create incidents via the REST API
- Basic Authentication: Encode your credentials in Base64 format:
username:password
Step-by-Step Configuration
1. Set up Environment Variables
First, configure your ServiceNow credentials as environment variables on the EdgeDelta agent:
export SERVICENOW_INSTANCE="your-instance"
export SERVICENOW_CREDENTIALS="base64_encoded_username:password"
2. Create the Webhook Node
Configure a webhook node that sends alerts to ServiceNow’s Table API:
- name: servicenow_incidents
type: webhook_output
endpoint: https://${SERVICENOW_INSTANCE}.service-now.com/api/now/table/incident
headers:
Content-Type: "application/json"
Accept: "application/json"
Authorization: "Basic ${SERVICENOW_CREDENTIALS}"
suppression_window: 30m
payload: |
{
"short_description": "{{ .item.signal.title }}",
"description": "EdgeDelta Alert Details:\n\nAlert: {{ .item.signal.description }}\n\nAffected System:\n- Host: {{ index .item.resource \"host.name\" }}\n- Source: {{ index .item.resource \"ed.source_name\" }}\n- Source Type: {{ index .item.resource \"ed.source_type\" }}\n\nMetric Information:\n- Metric Name: {{ .item.signal.name }}\n- Current Value: {{ .item.signal.value }}\n- Threshold: {{ .item.signal.threshold_value }}\n- Threshold Type: {{ .item.signal.threshold_type }}\n\nSignal ID: {{ .item.signal.signal_id }}\nTimestamp: {{ .item.timestamp }}",
"urgency": "{{ if gt .item.signal.value .item.signal.threshold_value }}2{{ else }}3{{ end }}",
"impact": "2",
"category": "Infrastructure",
"subcategory": "Monitoring",
"assignment_group": "Infrastructure Team",
"cmdb_ci": "{{ index .item.resource \"host.name\" }}",
"correlation_id": "edgedelta-{{ .item.signal.signal_id }}",
"work_notes": "Automated incident created by EdgeDelta monitoring at {{ .item.timestamp }}. Agent tag: {{ index .item.resource \"ed.tag\" }}"
}
3. Connect to a Threshold Node
Connect this webhook node to a threshold node that triggers based on your monitoring criteria:
nodes:
- name: error_rate_threshold
type: threshold
metric: error_rate
operator: ">"
value: 0.05
window: 5m
- name: servicenow_incidents
type: webhook_output
# ... configuration from above ...
links:
- from: error_rate_threshold
to: servicenow_incidents
Understanding the Payload
The ServiceNow incident payload uses the following key fields:
Field | Description | EdgeDelta Variable |
---|---|---|
short_description |
Brief incident summary | Uses alert title |
description |
Detailed incident information | Combines multiple alert fields |
urgency |
How quickly the incident needs attention (1-3) | Dynamically set based on threshold |
impact |
Business impact (1-3) | Fixed or can be dynamic |
category |
Incident category | Fixed as “Infrastructure” |
assignment_group |
Team responsible for resolution | Configure per your organization |
cmdb_ci |
Configuration item (affected server/service) | Uses host name |
correlation_id |
Unique identifier for deduplication | Uses signal ID |
Testing the Integration
-
Test with a private or local endpoint: Before connecting to ServiceNow, test your payload using a local HTTP server (e.g., httpbin, ngrok with a local server, or a custom internal endpoint):
endpoint: http://localhost:8080/webhook-test
-
Verify JSON Syntax: Use the EdgeDelta UI to validate your configuration
-
Check ServiceNow Response: ServiceNow returns the created incident details:
{ "result": { "sys_id": "abcd1234...", "number": "INC0001234", "short_description": "High CPU Usage on prod-server-01" } }
Advanced Configuration
Dynamic Priority Mapping
Map EdgeDelta alert severity to ServiceNow priority:
payload: |
{
"priority": "{{ if gt .item.signal.value (mul .item.signal.threshold_value 2) }}1{{ else if gt .item.signal.value .item.signal.threshold_value }}2{{ else }}3{{ end }}",
...
}
Including Custom Tags
Include custom attributes in the incident:
payload: |
{
"u_environment": "{{ index .item.attributes \"environment\" | default \"production\" }}",
"u_application": "{{ index .item.attributes \"application\" | default \"unknown\" }}",
...
}
Resolving Incidents Automatically
Create a separate webhook for auto-resolution when metrics return to normal:
- name: servicenow_resolve
type: webhook_output
endpoint: https://${SERVICENOW_INSTANCE}.service-now.com/api/now/table/incident
headers:
Content-Type: "application/json"
Authorization: "Basic ${SERVICENOW_CREDENTIALS}"
payload: |
{
"correlation_id": "edgedelta-{{ .item.signal.signal_id }}",
"state": "6",
"close_code": "Solved (Permanently)",
"close_notes": "Alert condition resolved automatically at {{ .item.timestamp }}"
}
Troubleshooting
- 401 Unauthorized: Verify your Base64 encoded credentials
- 400 Bad Request: Check JSON syntax and required fields for your ServiceNow instance
- Field not found errors: Custom fields vary by ServiceNow configuration - check your instance’s incident table schema
- No incident created: Verify the suppression window isn’t preventing notifications
Best Practices
- Use Correlation IDs: Prevent duplicate incidents with unique correlation IDs
- Set Appropriate Suppression: 30 minutes is typically good for infrastructure alerts
- Include Context: Provide enough detail in descriptions for effective troubleshooting
- Test Thoroughly: Always test with non-production endpoints first
- Monitor API Limits: ServiceNow has rate limits - ensure your alert volume is appropriate