Edge Delta Trace Explorer
Explore and analyze traces in the Edge Delta Trace Explorer, supporting OpenTelemetry and eBPF traces for detailed system insights.
6 minute read
Overview
Tracing is vital in distributed systems as it enables in-depth analysis and troubleshooting by providing detailed views of requests across various services. It aids in debugging network or service-related issues, identifies performance bottlenecks, and offers critical insights into errors, status codes, and request durations. Tracing also facilitates performance monitoring and resource management by tracking essential service-level metrics like latency and error rates. Additionally, it provides a holistic view of system interactions, crucial for understanding dependencies and maintaining reliable, high-performing applications.
The Trace Explorer provides a detailed and organized view of traces. Search for traces using CQL syntax.
Note: Requires agent version 1.24.0 or higher.
Traces
Edge Delta supports OpenTelemetry (OTEL) traces and out-of-the-box eBPF traces:
- OTEL traces capture high-level application data, such as the logical flow of requests through services, database queries, HTTP requests, and custom business logic spans.
- Linux’s Extended Berkeley Packet Filter (eBPF) technology collects telemetry data directly from the operating system, without requiring changes to the application code. Operating at the kernel level, eBPF traces capture system-level information such as network packet paths, file system access, process execution, and kernel function calls. This low-level system data helps in understanding the underlying infrastructure and performance characteristics of applications.
Note: Edge Delta’s eBPF support for traces is currently limited to Kubernetes environments. Although eBPF is a Linux kernel feature, Edge Delta’s implementation relies on Kubernetes metadata for context enrichment—such as pod name, namespace, and labels. Without this metadata (as in bare-metal or Docker-only environments), eBPF traces offer limited observability value. Edge Delta can ingest host-level metrics on Linux VMs using eBPF.
Prerequisites
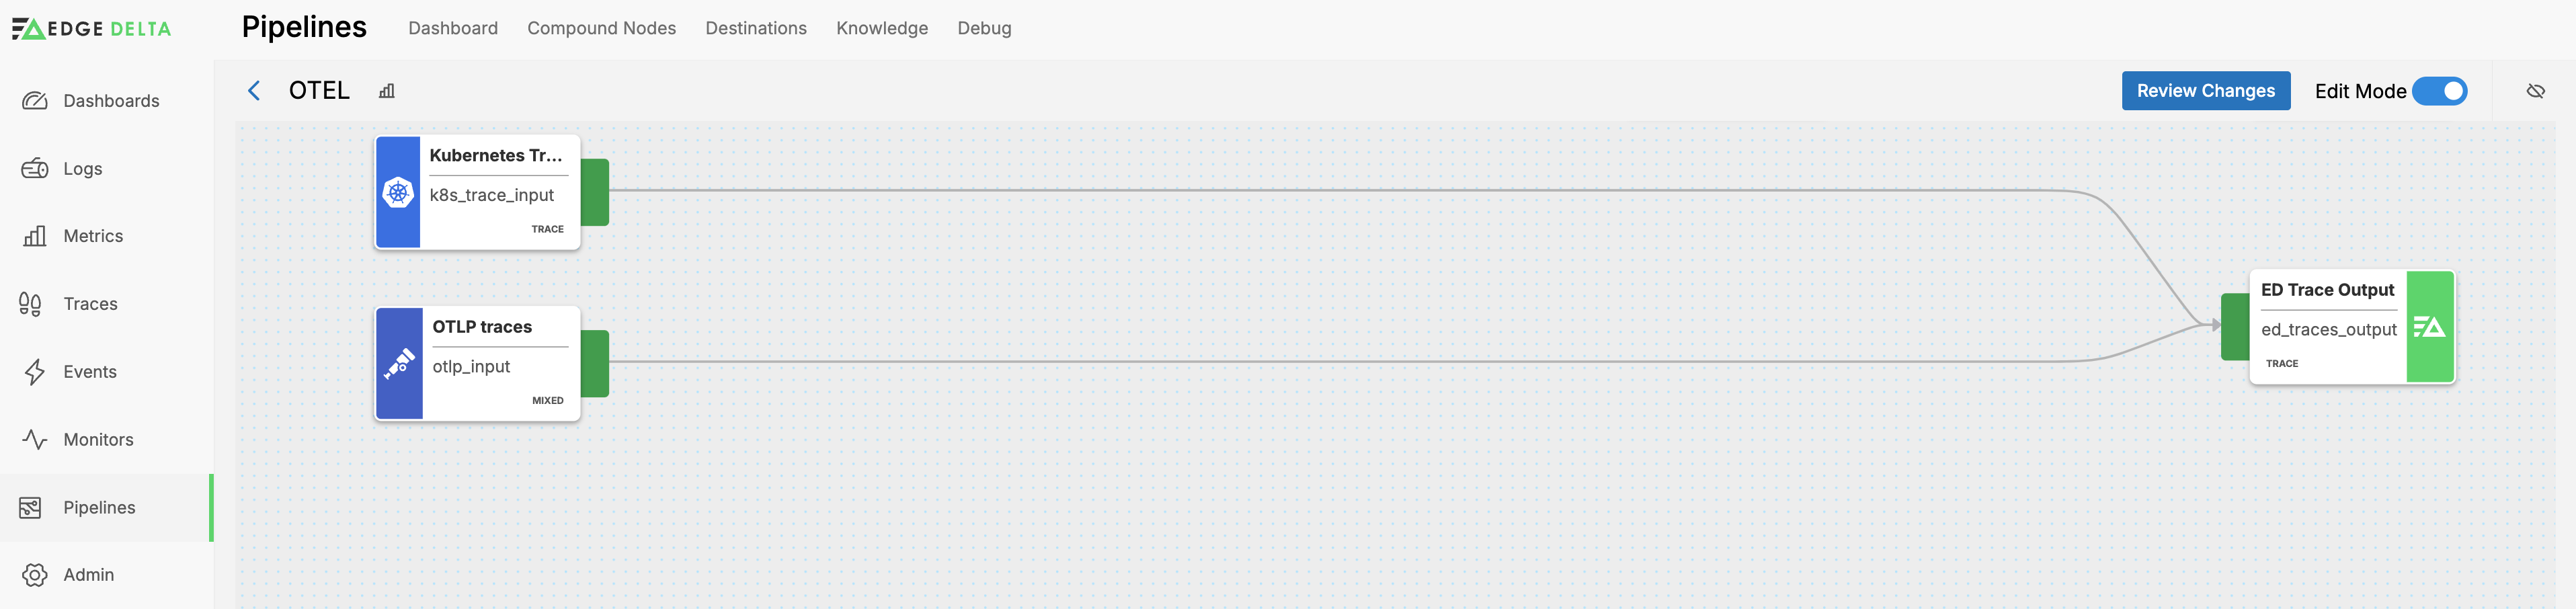
To ingest OTEL traces, you must deploy a pipeline with the OTLP Source node and configure it to listen on a port that is receiving traces.
To enable eBPF for traces within Kubernetes, you must:
- Deploy the Kubernetes Trace Source or Kubernetes Traffic Input Node.
- Set
tracerProps.enabled=truewhen deploying the Edge Delta agent using Helm. - Ensure your Kubernetes environment grants the necessary kernel-level privileges (e.g., Security Context Constraints in OpenShift).
You can also route traces to third party destinations that support the trace data type.
Trace Explorer
Click Traces to open the Traces Explorer.
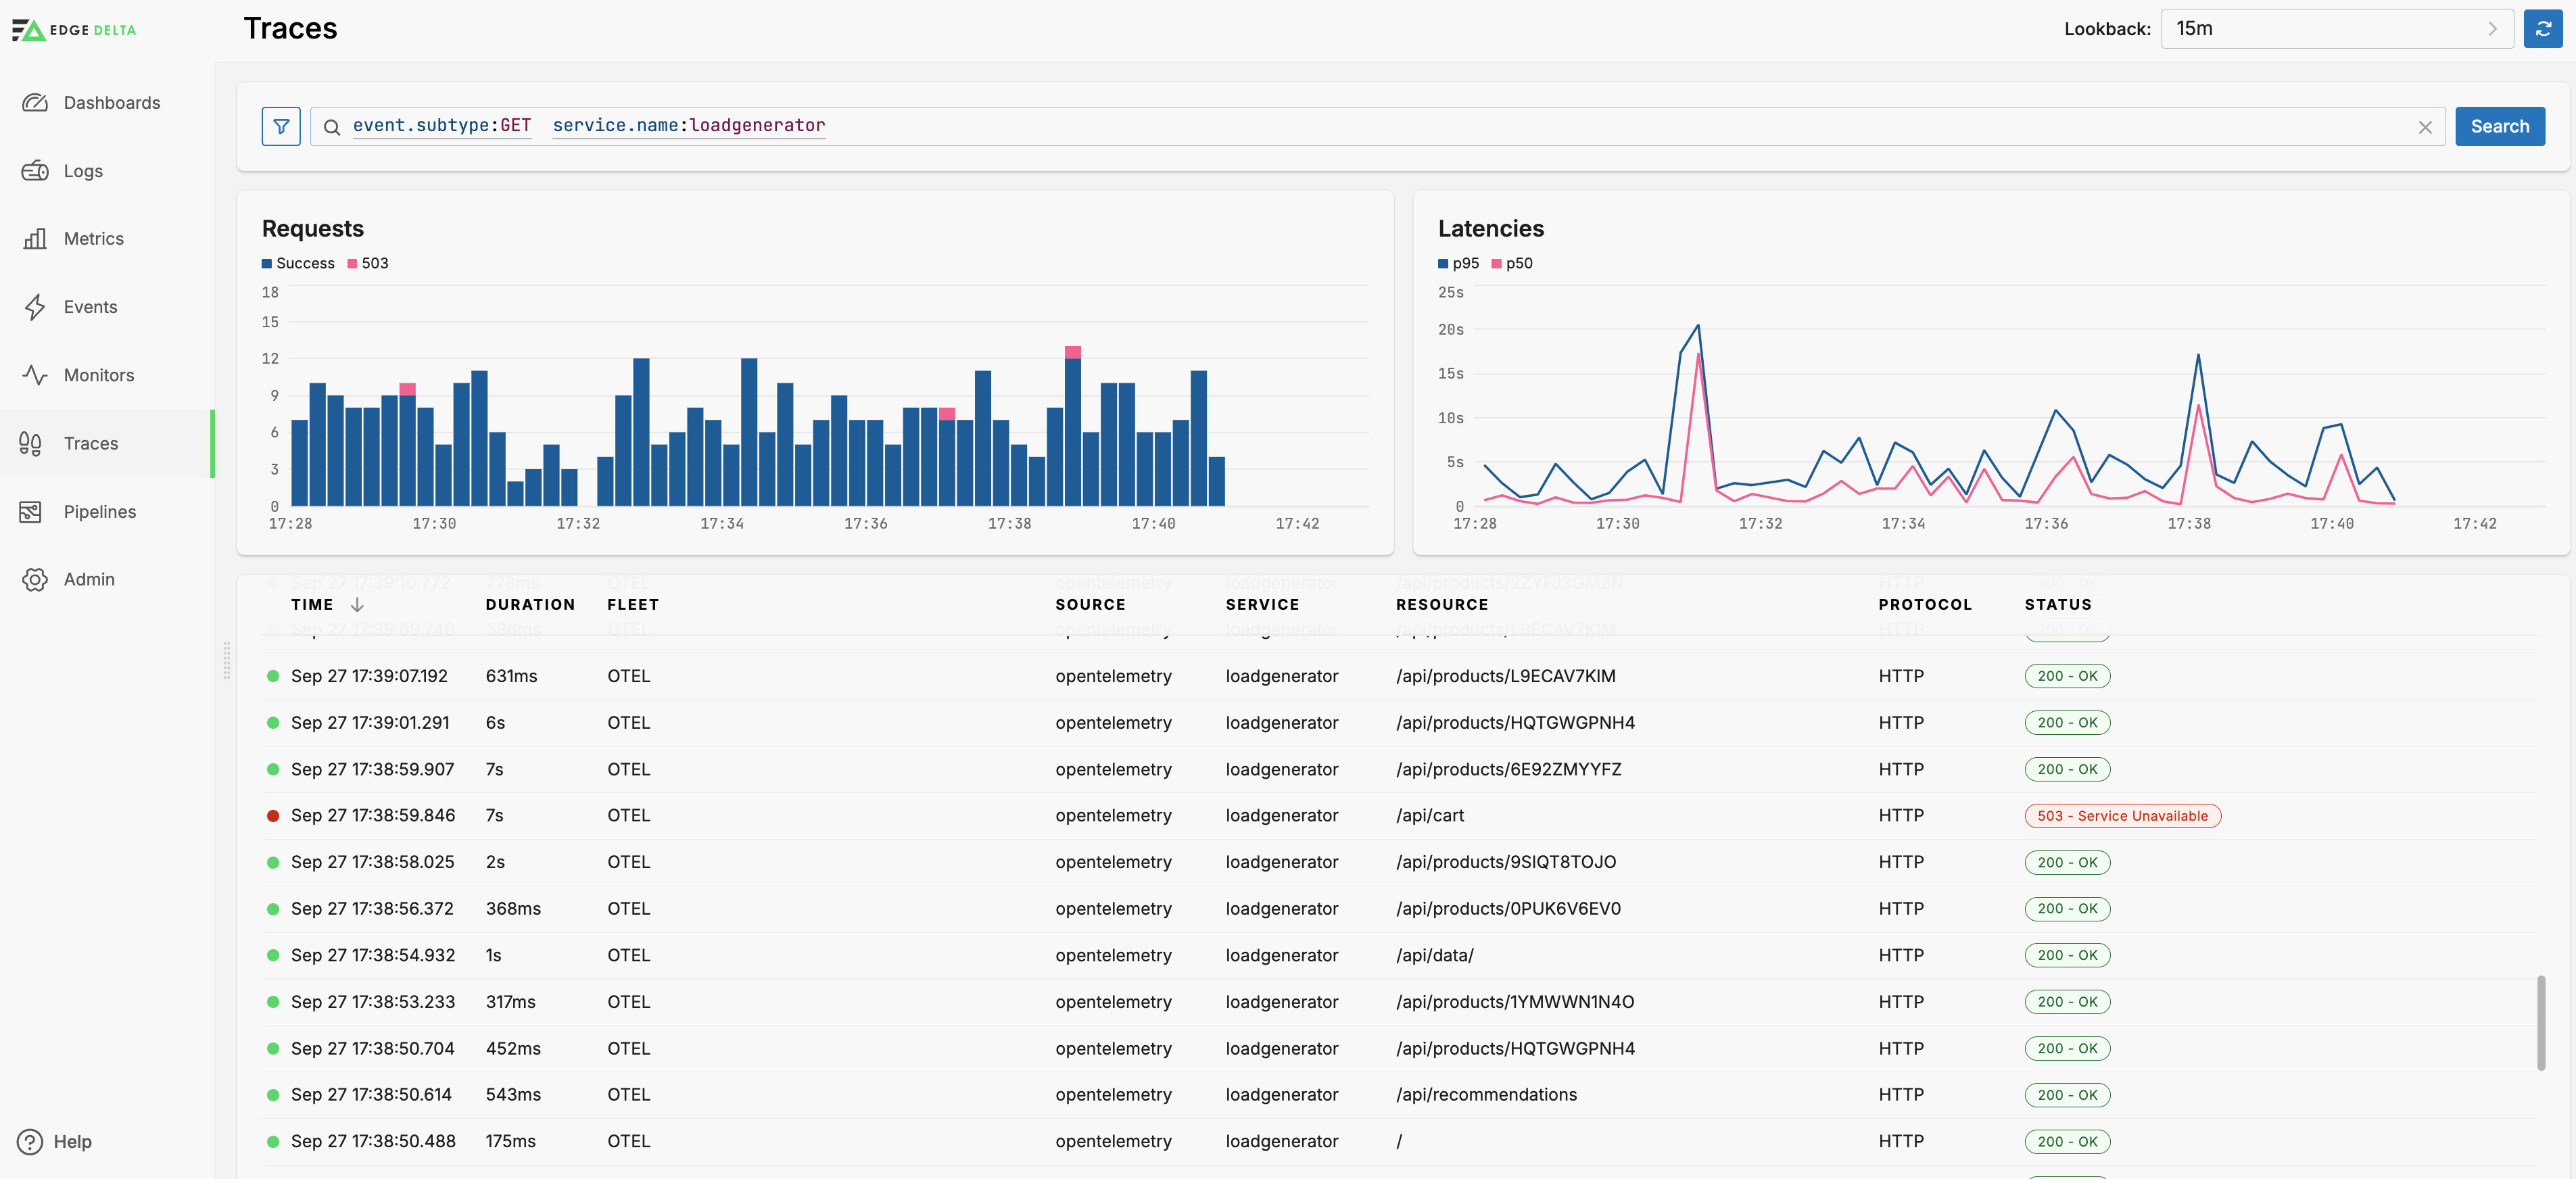
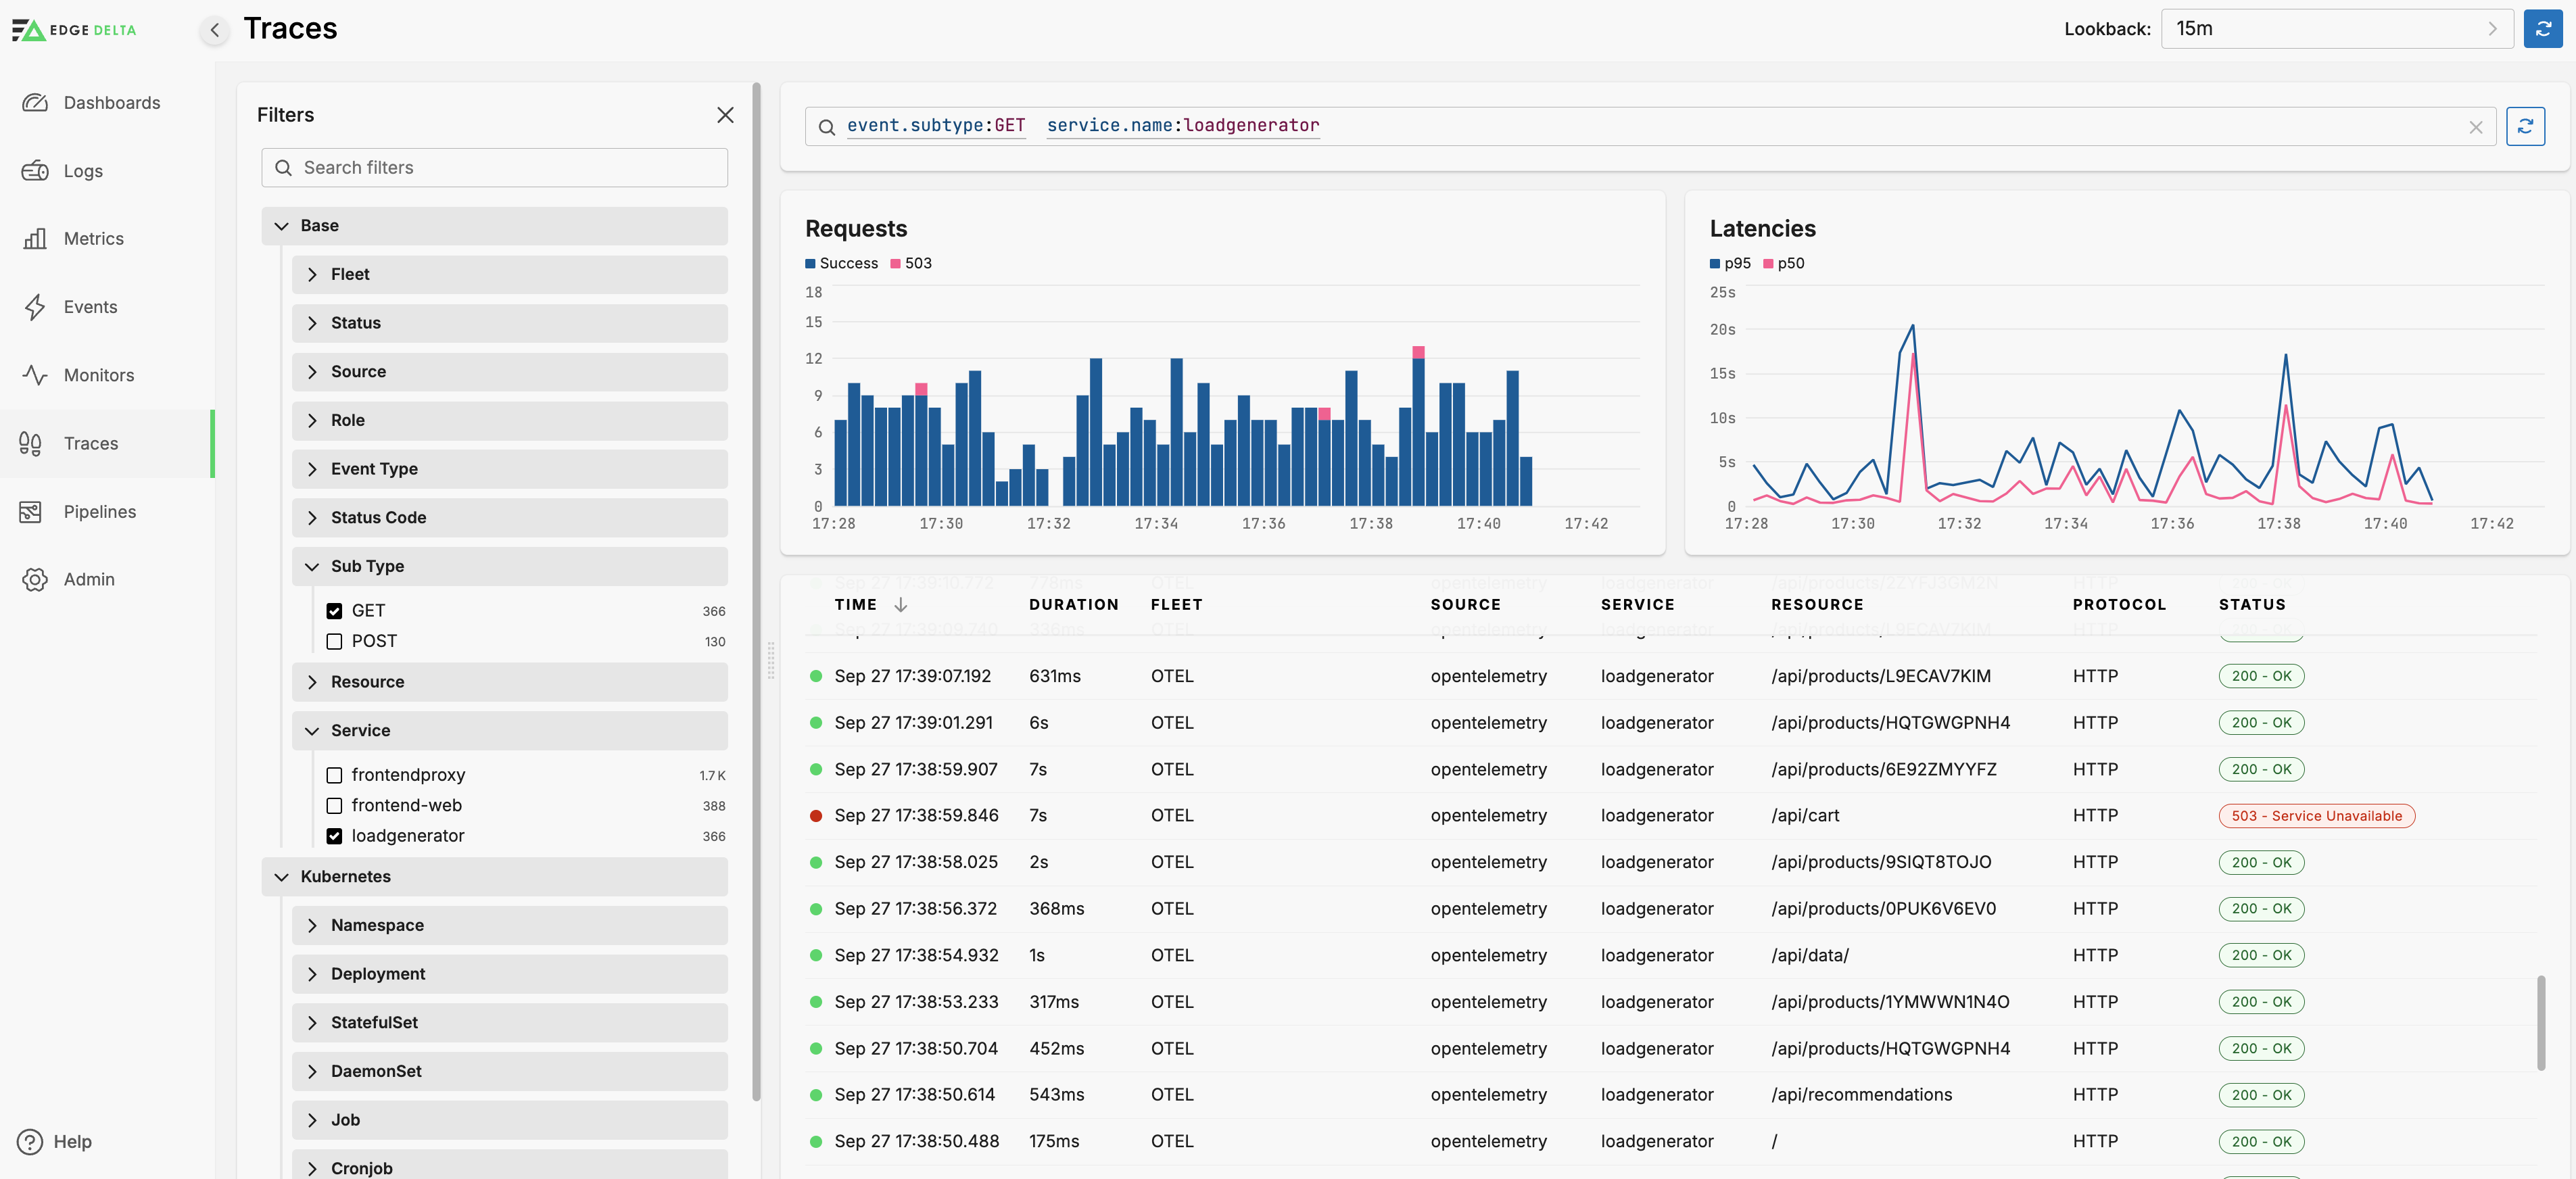
You can filter by multiple default dimensions including the Service.
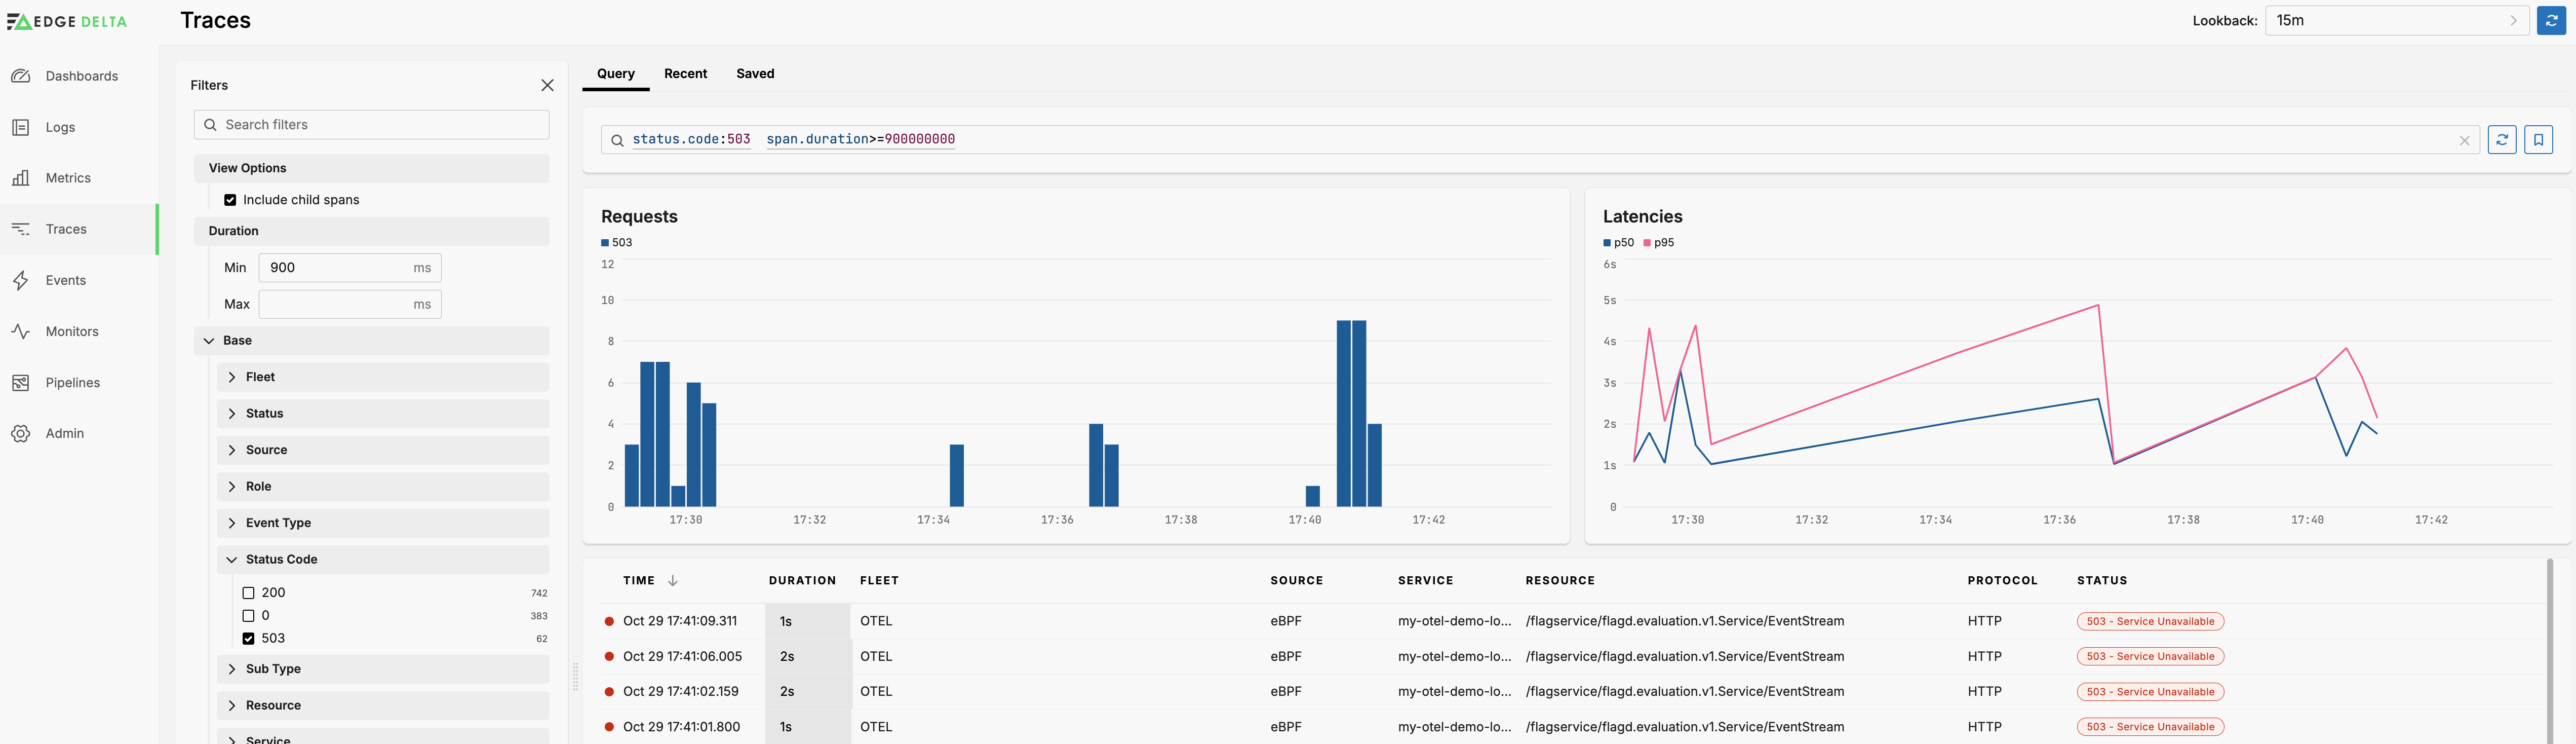
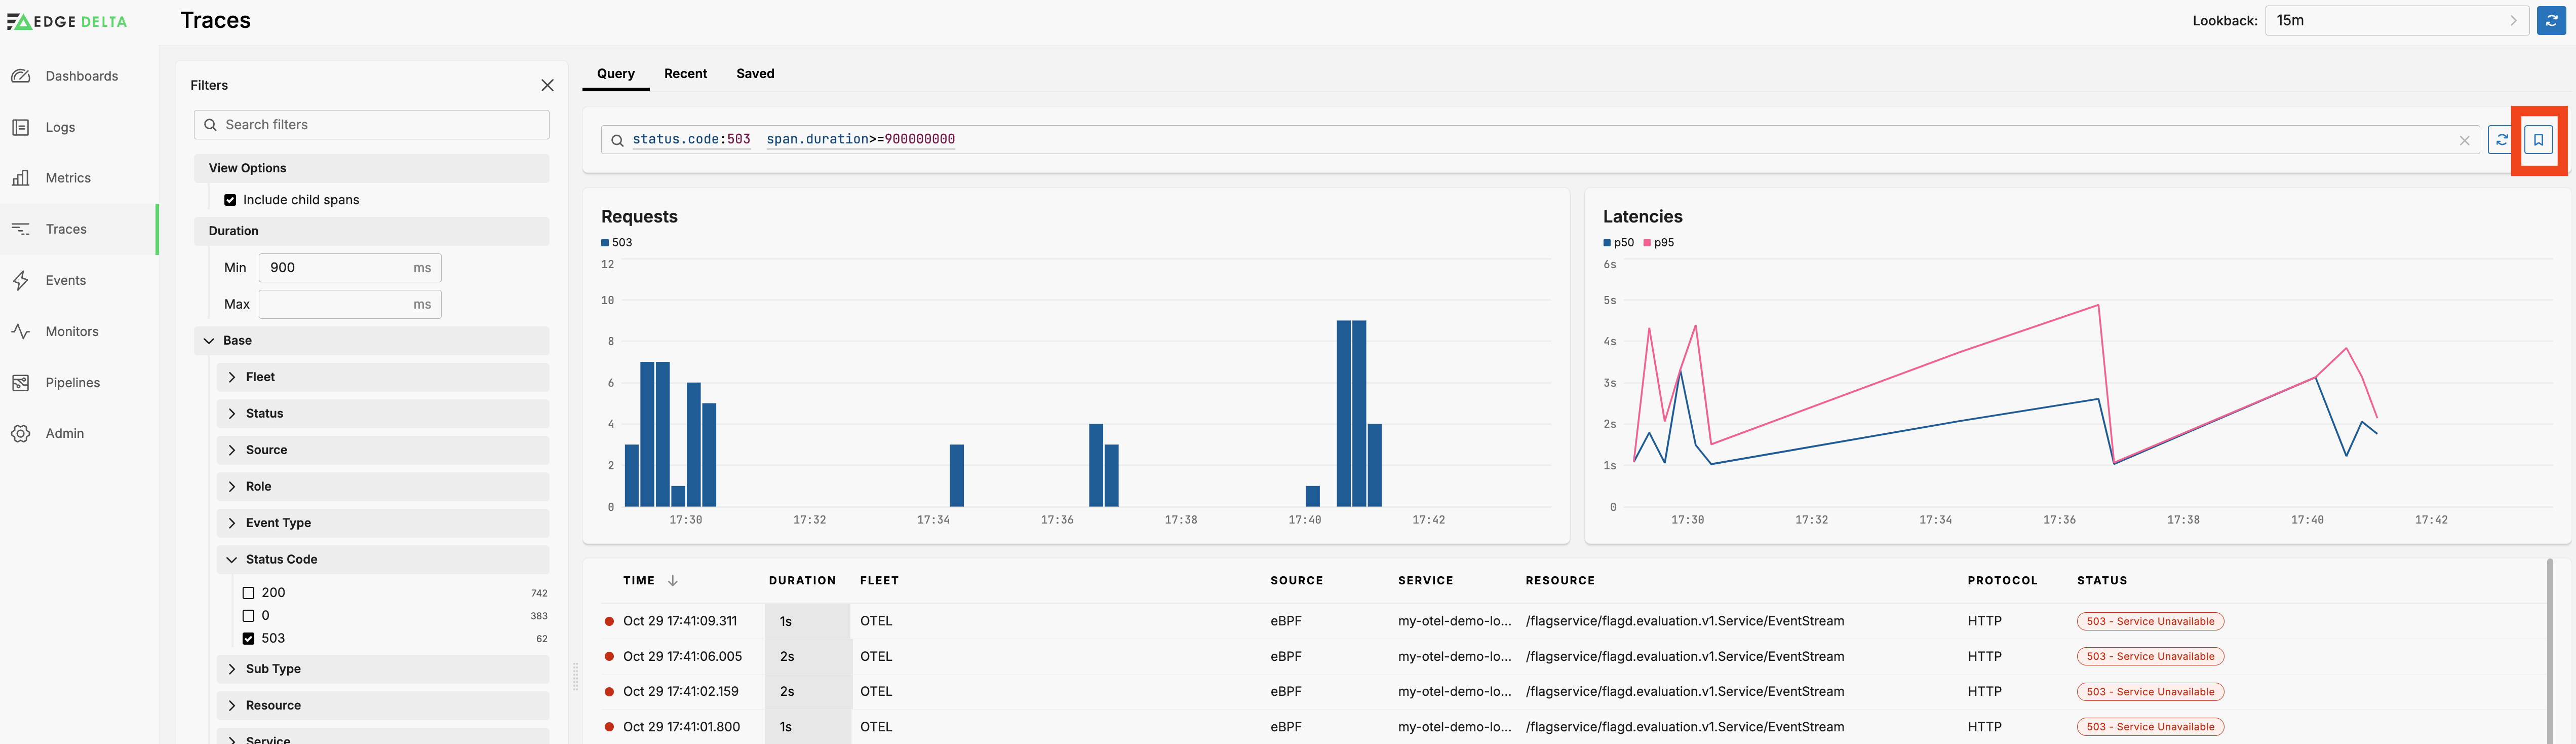
Filter by Duration
You can also filter traces and their child spand by the duration to focus on, for example, traces with an abnormally high latency. This is useful when investigating 5xx status codes for example.
Save Query
When you have configured a detailed set of filters for a particular use case you can save it for later use. Click Save Query to add it to the Saved tab.
Trace Details
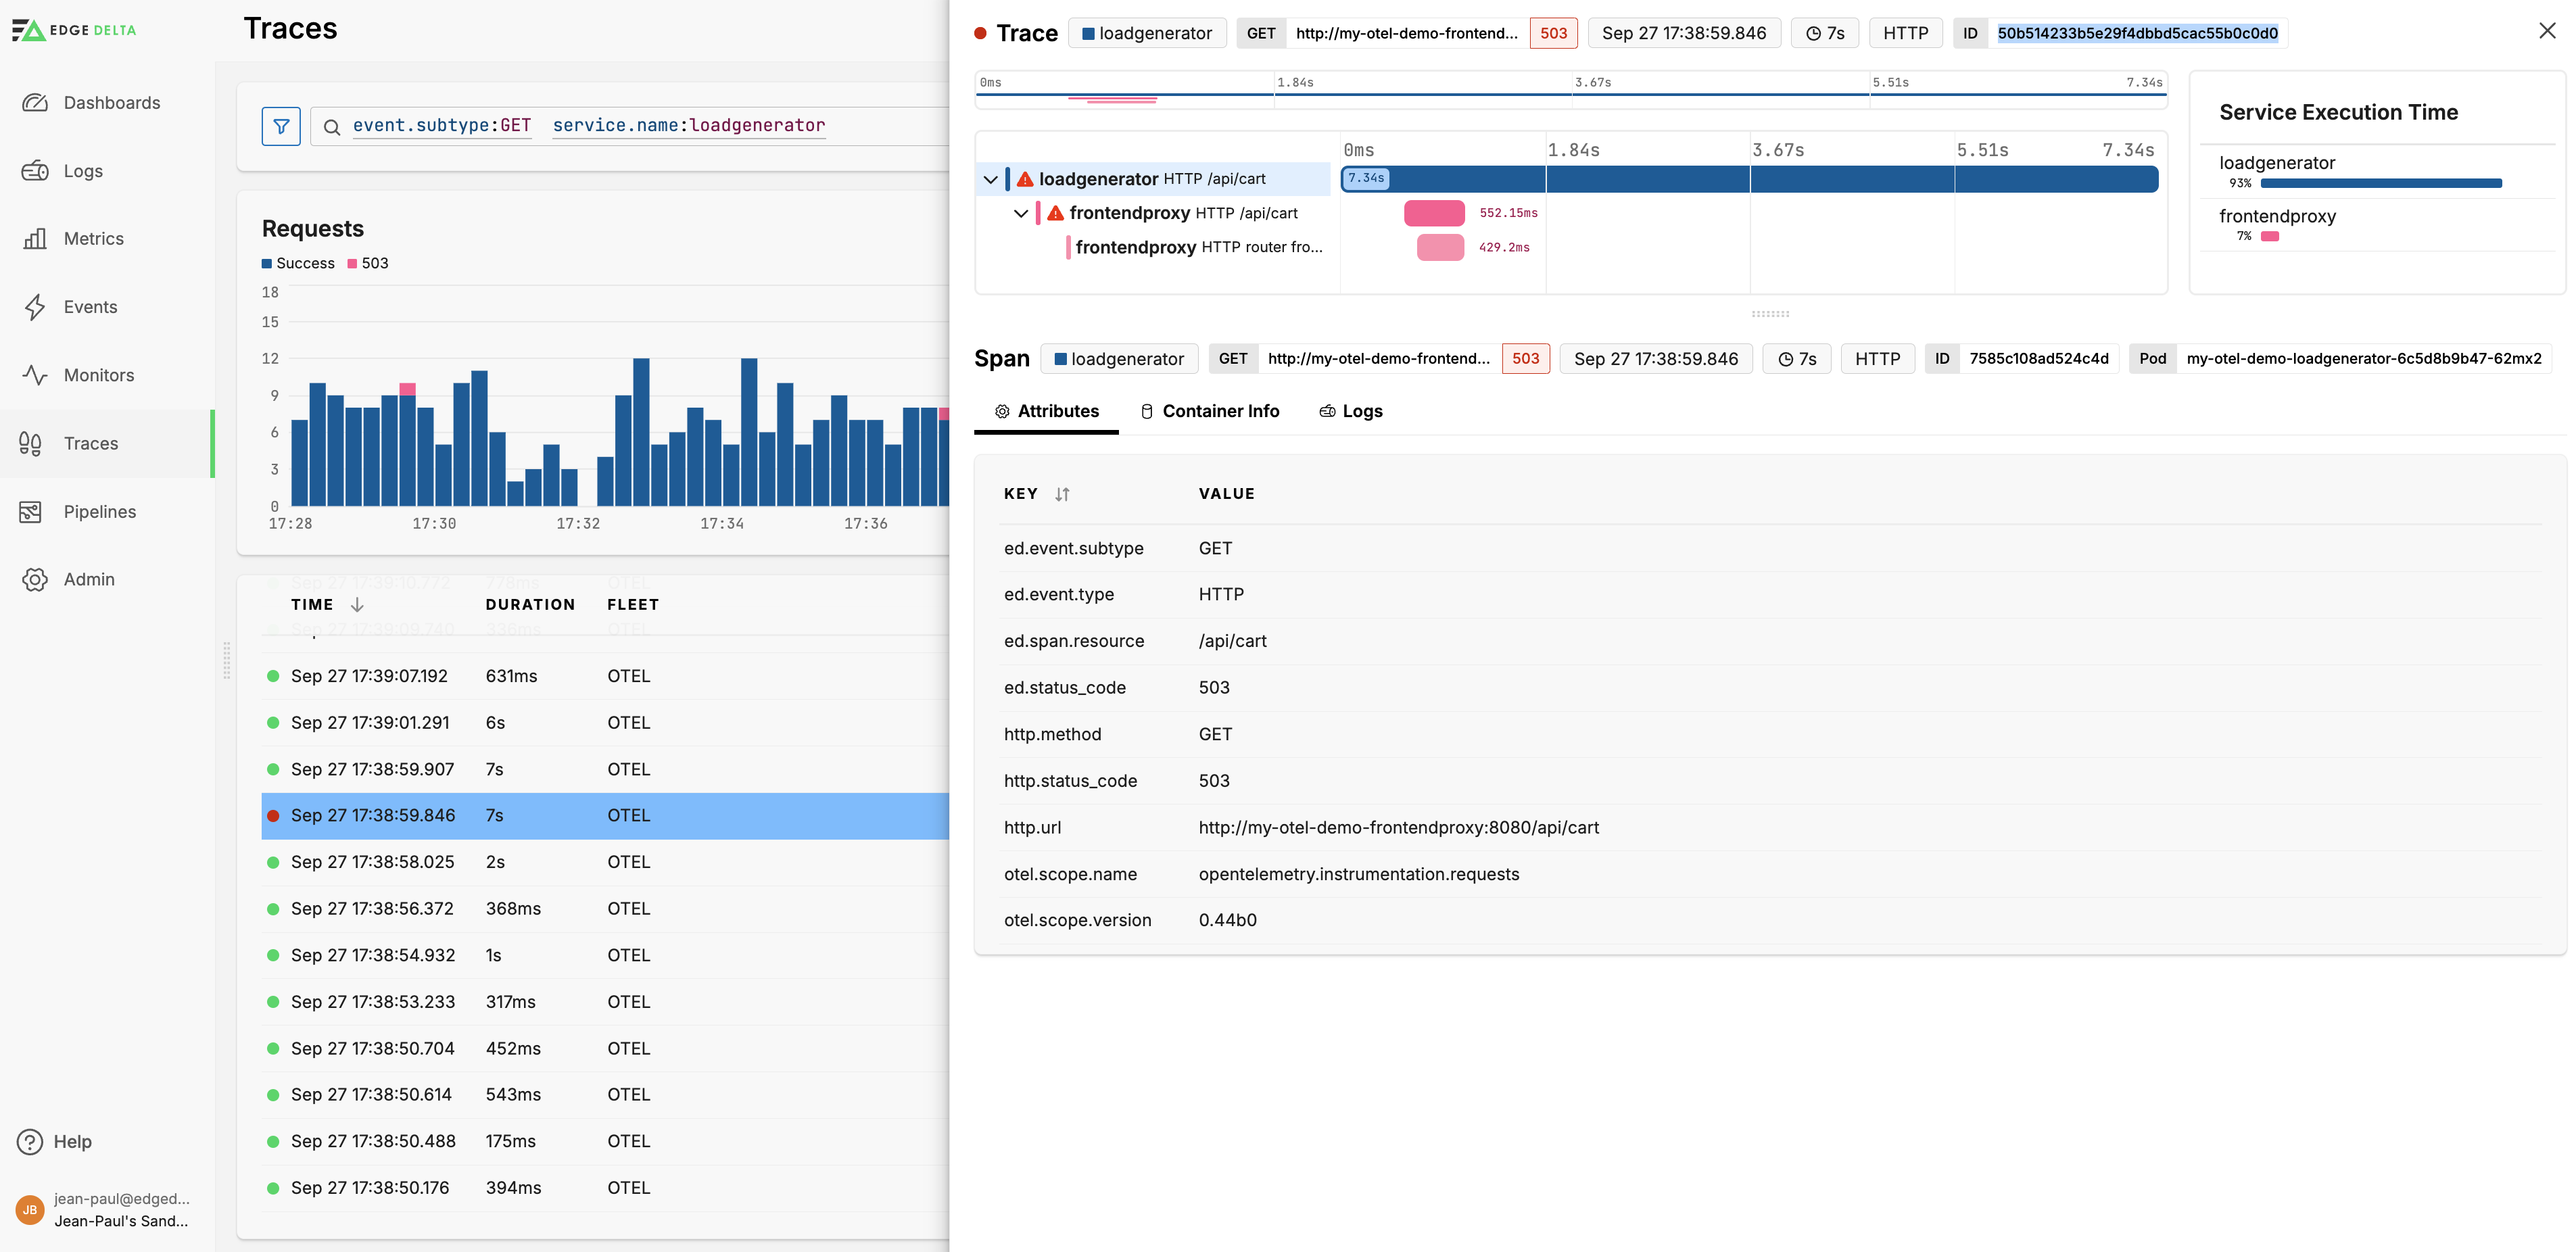
Click a trace in the table to view its details. This can be useful for debugging network or service-related issues within a distributed system.
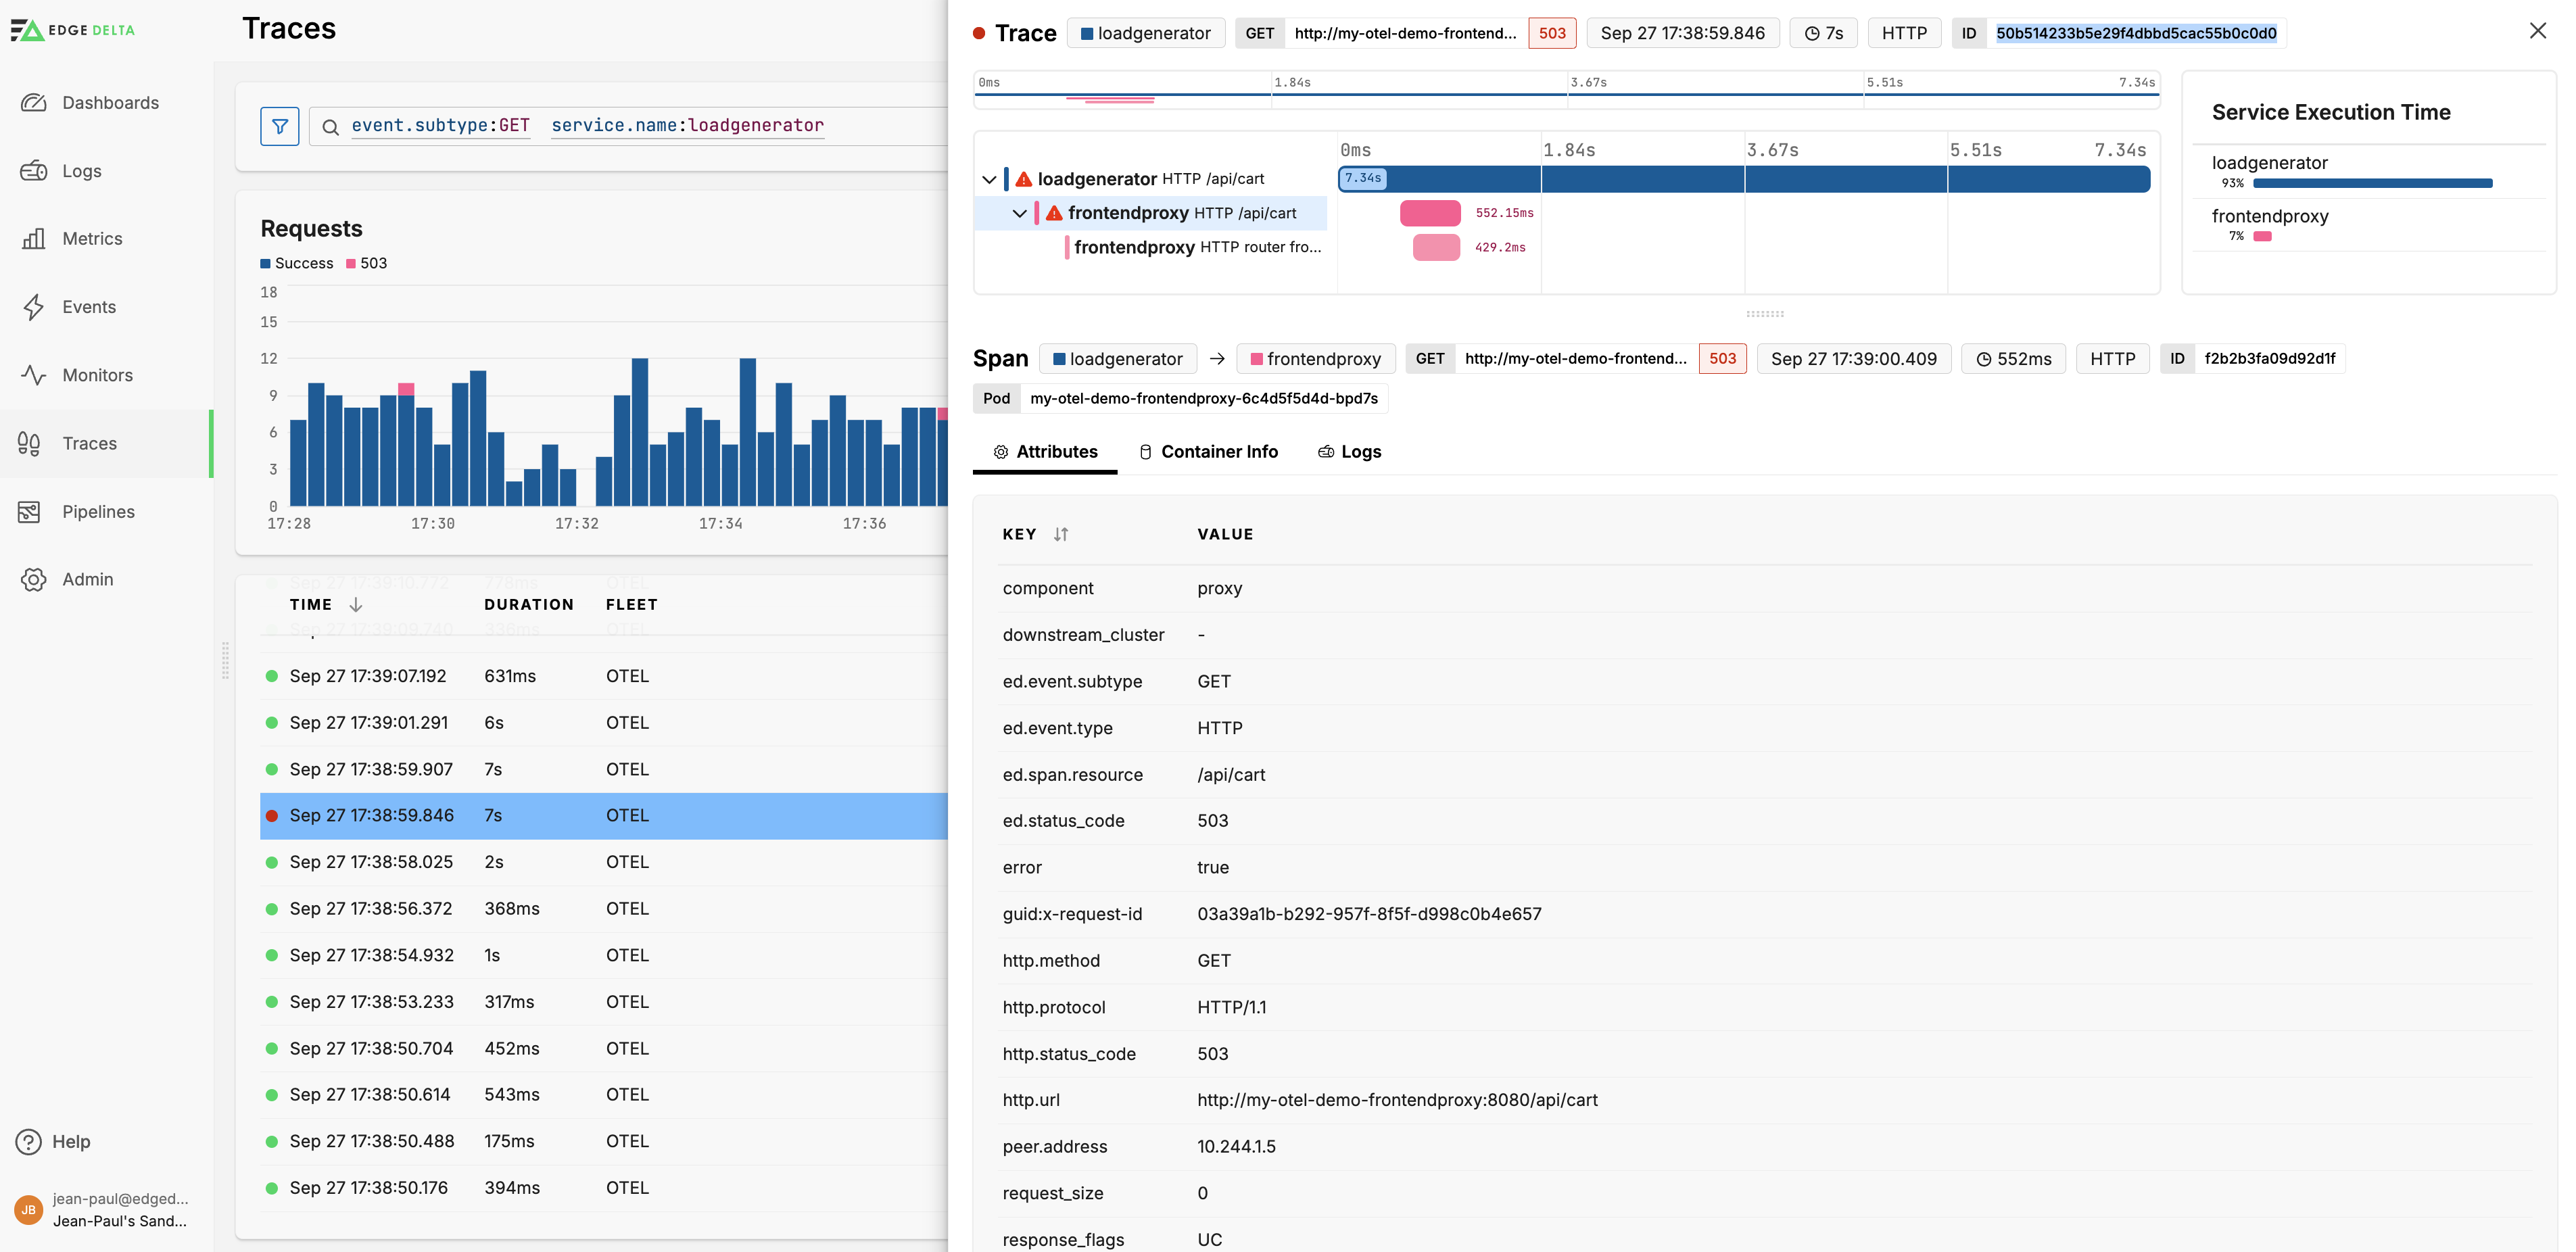
You can select each span to see its details:
View Logs
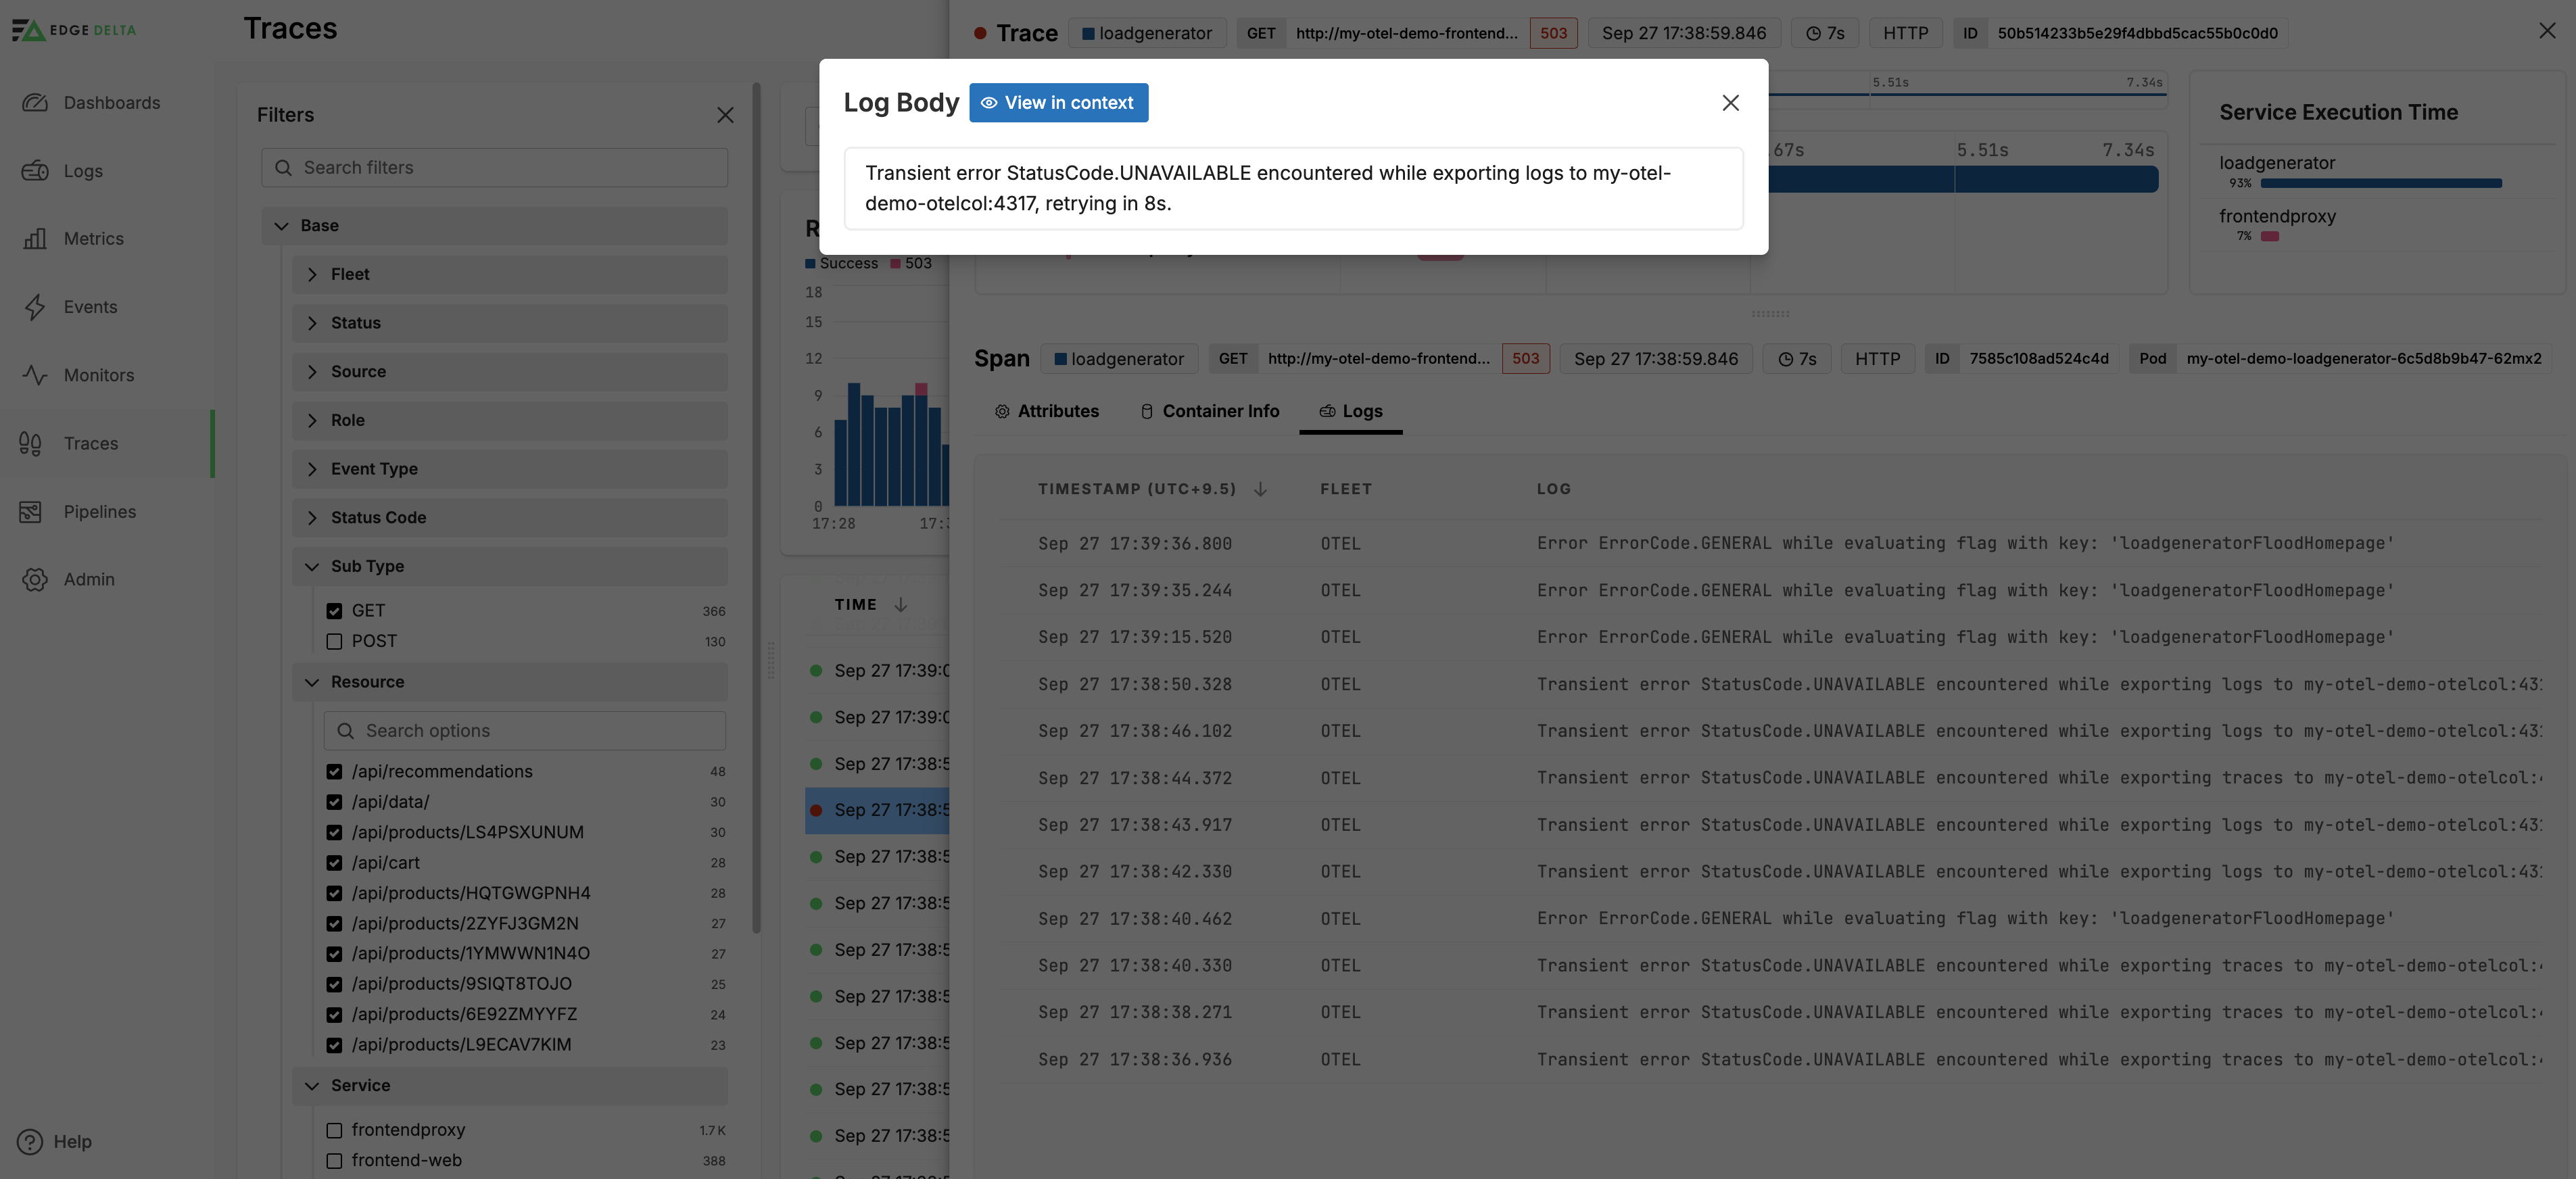
You can view logs with the same pod ID and a similar timestamp as the selected span. Click Logs:
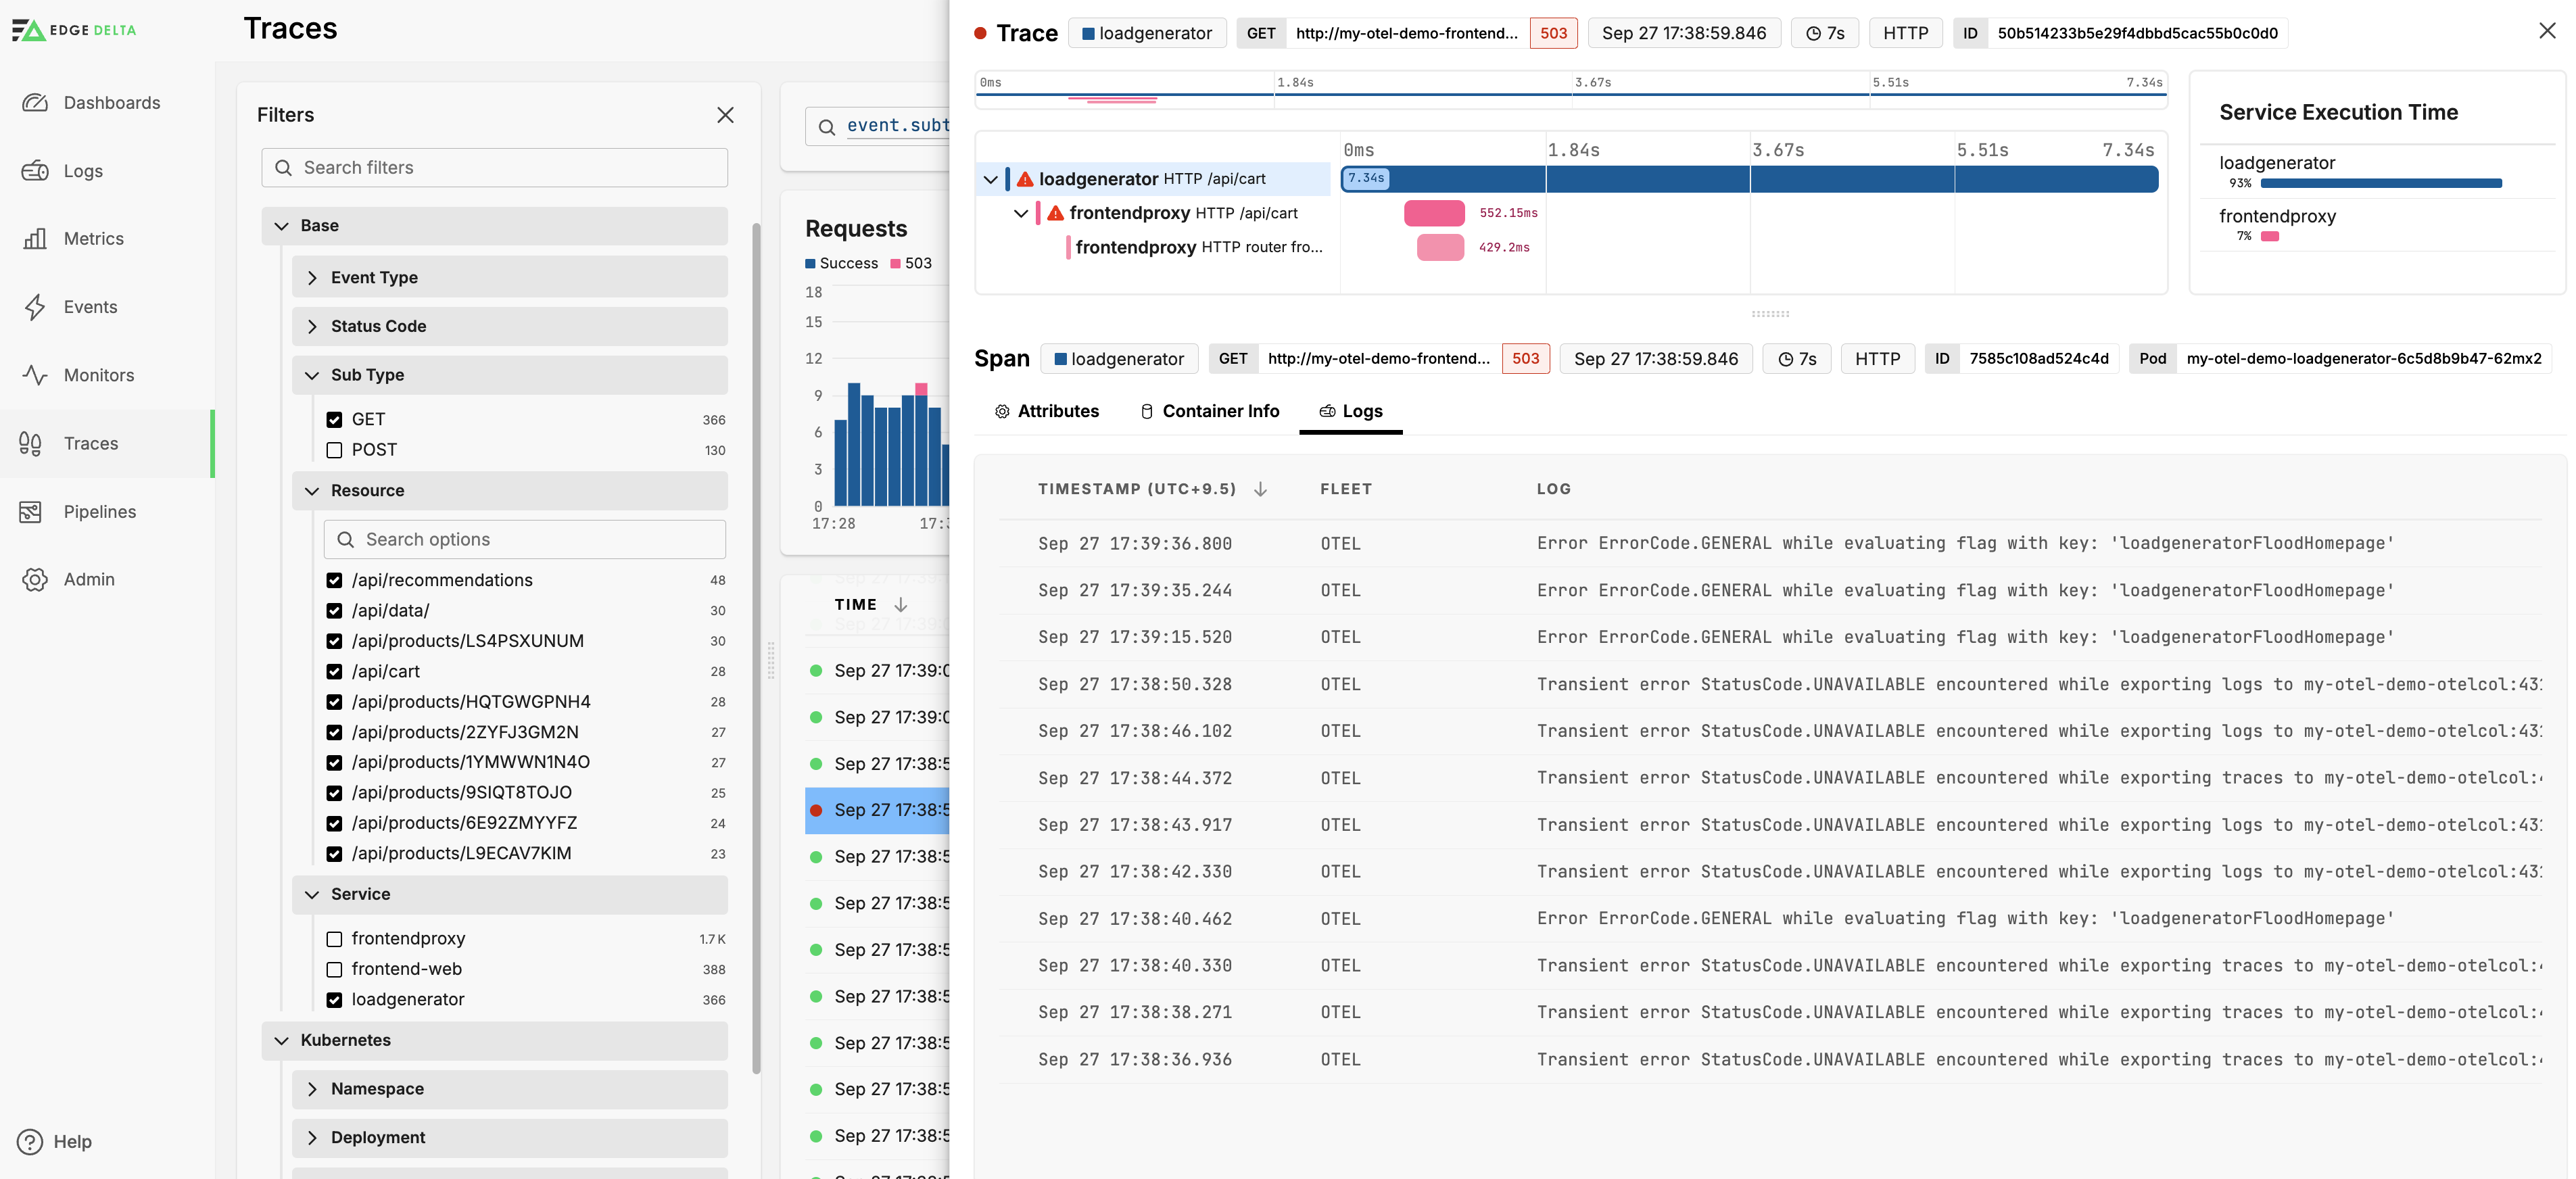
Click a log to view it, and click View in context to view it in the Log Explorer in a new window.
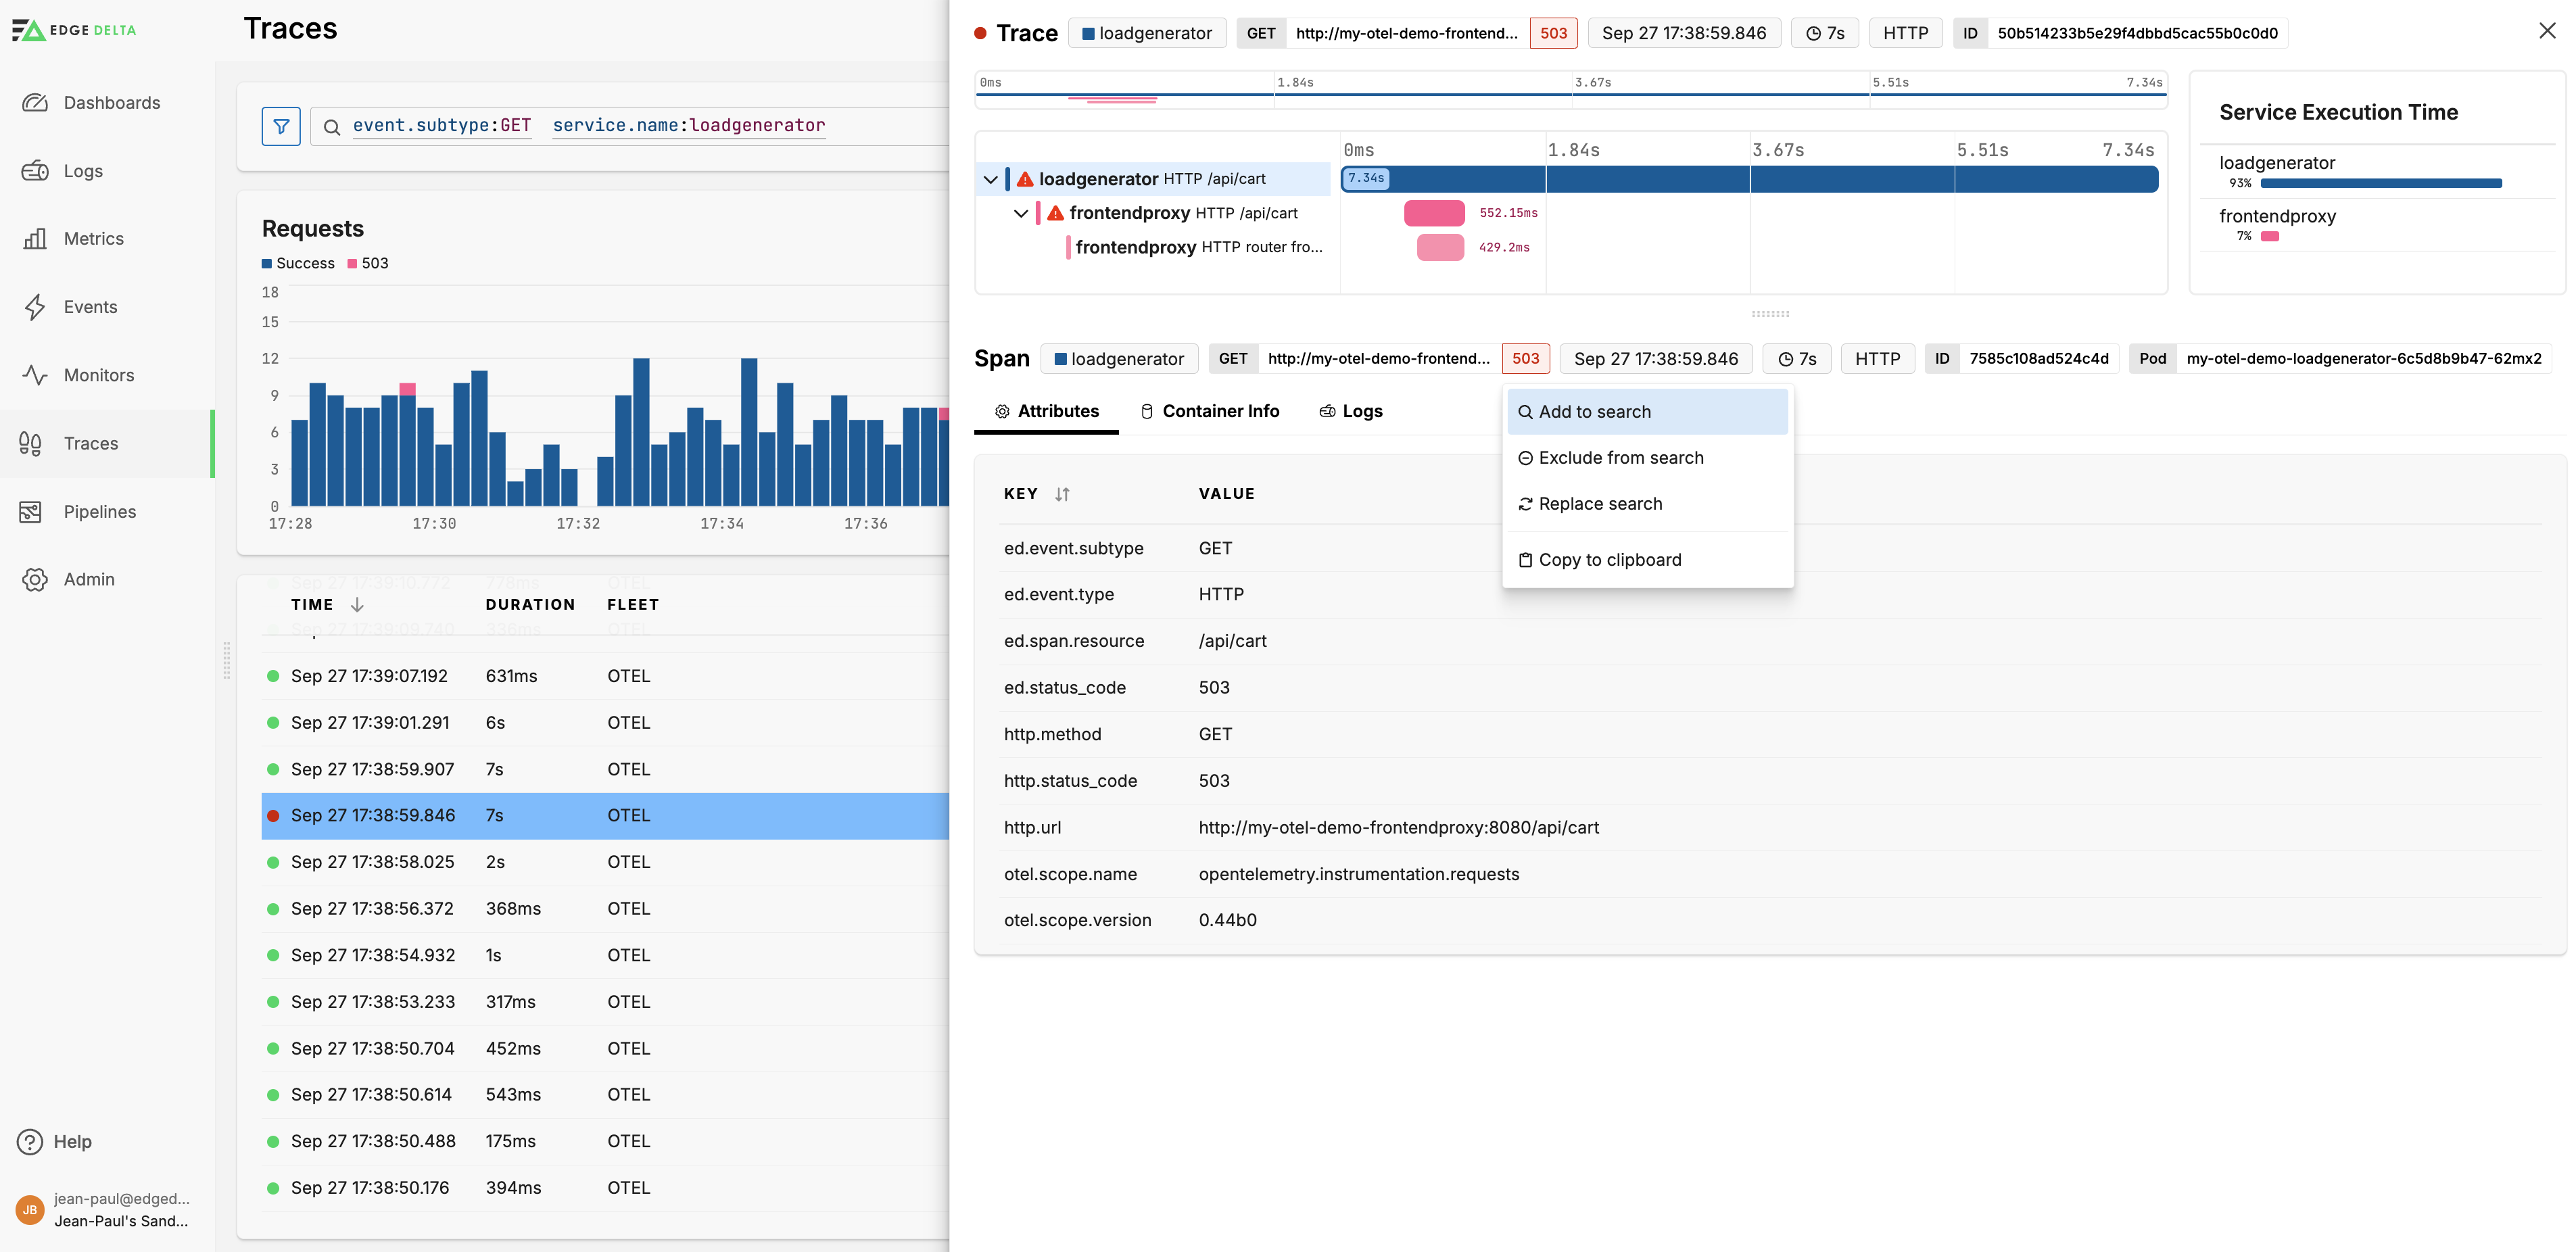
Add attributes to Search
You can select an attribute in the Details pane to add it to the search string, or exclude it from results. In addition you can copy the attribute to the clipboard to create a custom facet from it. See Add a Facet. For guidance on effectively using facets for search and performance optimization, see Effectively Using Facets.
Searching for Child Spans with Unknown Trace Type
When searching for child spans, you may encounter situations where spans are visible in the trace details but cannot be found using trace search queries. This typically occurs when the child span belongs to a trace with trace.type="Unknown".
Why this happens:
The Trace Explorer automatically filters out traces with trace.type="Unknown" from search results. This filter is applied implicitly (you can verify this by checking the network requests in your browser’s developer tools). Even when the “Include Child Spans” checkbox is enabled, child spans belonging to Unknown-type traces will not appear in search results or facets.
For comprehensive troubleshooting of trace-related issues, including gateway aggregation and performance problems, see Troubleshooting Traces.
Solution: To make child spans searchable, you need to ensure that the trace type is set to a recognized value rather than “Unknown”. There are two approaches:
Option 1: Set Trace Type Attributes in Application Code
Edge Delta infers the trace type by examining specific OpenTelemetry attributes. Add one or more of the following attributes when creating spans in your application code:
HTTP Traces:
const span = tracer.startSpan('operationName', {
  attributes: {
    'http.flavor': '1.1',        // HTTP protocol version
    'http.method': 'GET',        // HTTP method
    'http.host': 'example.com',  // Target host
    // You don't need all attributes, just one or more
  }
});
gRPC Traces:
attributes: {
  'rpc.system': 'grpc'
}
Database Traces:
attributes: {
  'db.system': 'postgresql'  // or 'mysql', 'redis', etc.
}
Messaging Traces:
attributes: {
  'messaging.system': 'kafka'  // or 'rabbitmq', 'sqs', etc.
}
Option 2: Use Pipeline Transformations
If you cannot modify your application code, you can use a multiprocessor in your pipeline to set the trace type based on other attributes:
processors:
  - name: set-trace-type
    type: multiprocessor
    config:
      queries:
        - query: |
            set(attributes["http.flavor"], "1.1")
            where attributes["ed.trace.type"] == "Unknown"
            and attributes["otel.scope.name"] == "my-custom-scope"
This approach allows you to be specific about which Unknown traces to reclassify, avoiding unnecessary changes to all traces.
Recognized Trace Type Attributes:
Edge Delta recognizes the following attributes for automatic trace type inference:
| Trace Type | Required Attributes (any one or more) |
|---|---|
| HTTP | http.protocol, http.flavor, http.method, http.host, http.url, http.status_code, http.response.status_code |
| gRPC | rpc.system |
| Database | db.system |
| Messaging | messaging.system |
Traces without any of these attributes will be classified as “Unknown” and will be filtered from search results.
Note: For additional troubleshooting scenarios including gateway pipeline aggregation, tail sampling, and performance optimization, see Troubleshooting Traces.
Diagnose Traces
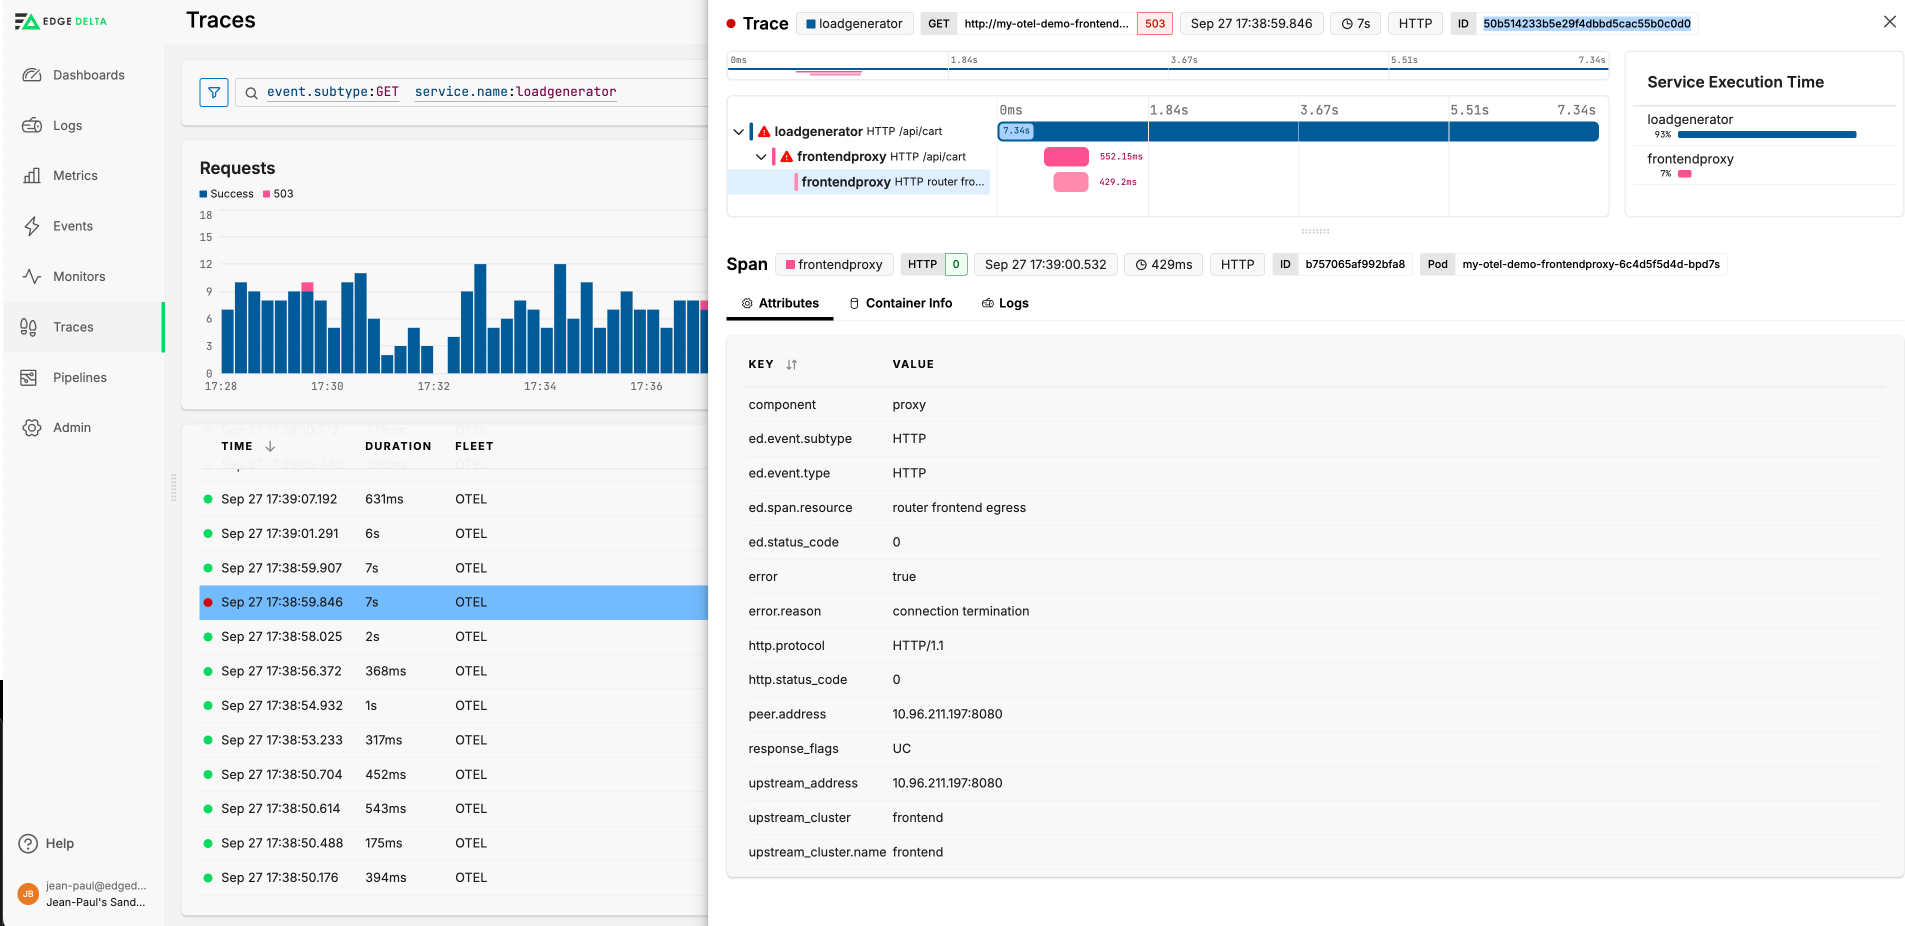
Use the Trace Explorer to uncover issues. In this example, the router frontend egress span encountered an error with a reason connection termination and the HTTP status code as 0, indicating that the outbound request failed due to connection issues.

The ingress span also indicates an error with an HTTP status code 503 (Service Unavailable). This span has response flags UC, suggesting that there was an upstream connection termination.
The total duration of the request in the loadgenerator component is significantly longer than the durations of the ingress and router frontend egress spans in the frontendproxy component. This suggests that the request was either queued or retried due to the connection issues.
Next steps could be to:
- Use the Metrics Explorer:
- Look into network performance metrics such as latency, packet loss, and throughput around the time of the issue.
- Check service-level metrics for the frontend proxy, including request rates, error rates, and response times.
- Monitor CPU, memory, and other resource utilization metrics for the frontend proxy and back end services.
- Check Events:
- Review any deployment or configuration change events around the time of the incident.
- Check for scaling events that might have occurred around the time of the failure.
- Check Logs:
- Investigate frontend proxy logs to look for error messages or warnings around the time of the connection termination.
- Investigate logs from the back end services that were involved in the trace.
- Check any network-related logs (firewalls, load balancers, etc.) to determine if there were any network anomalies or disruptions.