Log to Metric Examples
9 minute read
Overview
The Log to Metric Node node transforms log data into quantifiable metrics. This is useful for monitoring, alerting, and reporting purposes. See Create Metrics from Logs for an overview.
This page illustrates how to generate different types of metrics using the Log to Metrics node.
Example Configurations
Occurrence Count
A simple count of occurrences of logs that match the pattern, for example a metric called timeout.count to count logs containing connection timeout
. The count stat is enabled by entering count
and pressing Enter. In the test pane, on the Processor tab, you can drop in sample logs and view the output metric items.
YAML Version:
nodes:
- name: occurrence_count
type: log_to_metric
pattern: (?i)connection timeout
interval: 5s
skip_empty_intervals: false
only_report_nonzeros: false
metric_name: connection_timeout
enabled_stats:
- count
Input logs:
2021-09-10 12:05:00 ERROR node7 experienced a connection timeout
2021-09-10 12:06:00 WARN connection timeout while trying to reach the database node7
2021-09-10 12:07:00 INFO node7 attempting to reconnect after a connection timeout
2021-09-10 12:08:00 ERROR node7 - connection timeout during data synchronization
2021-09-10 12:09:00 DEBUG Checked connection status to node7, no timeout detected
Out of these sample logs, logs 1, 2, 3 and 4 contain the phrase “connection timeout” and are counted by the occurrence count node for a value of 4.
Output in Test Pane:
{
"_type": "metric"
"gauge": {
"value": 4
}
"kind": "gauge"
"name": "connection_timeout.count"
"resource": { • • • }
"start_timestamp": 1708445624790
"timestamp": 1708445629790
"unit": "1"
"_stat_type": "count"
}
Output in Metric Explorer:
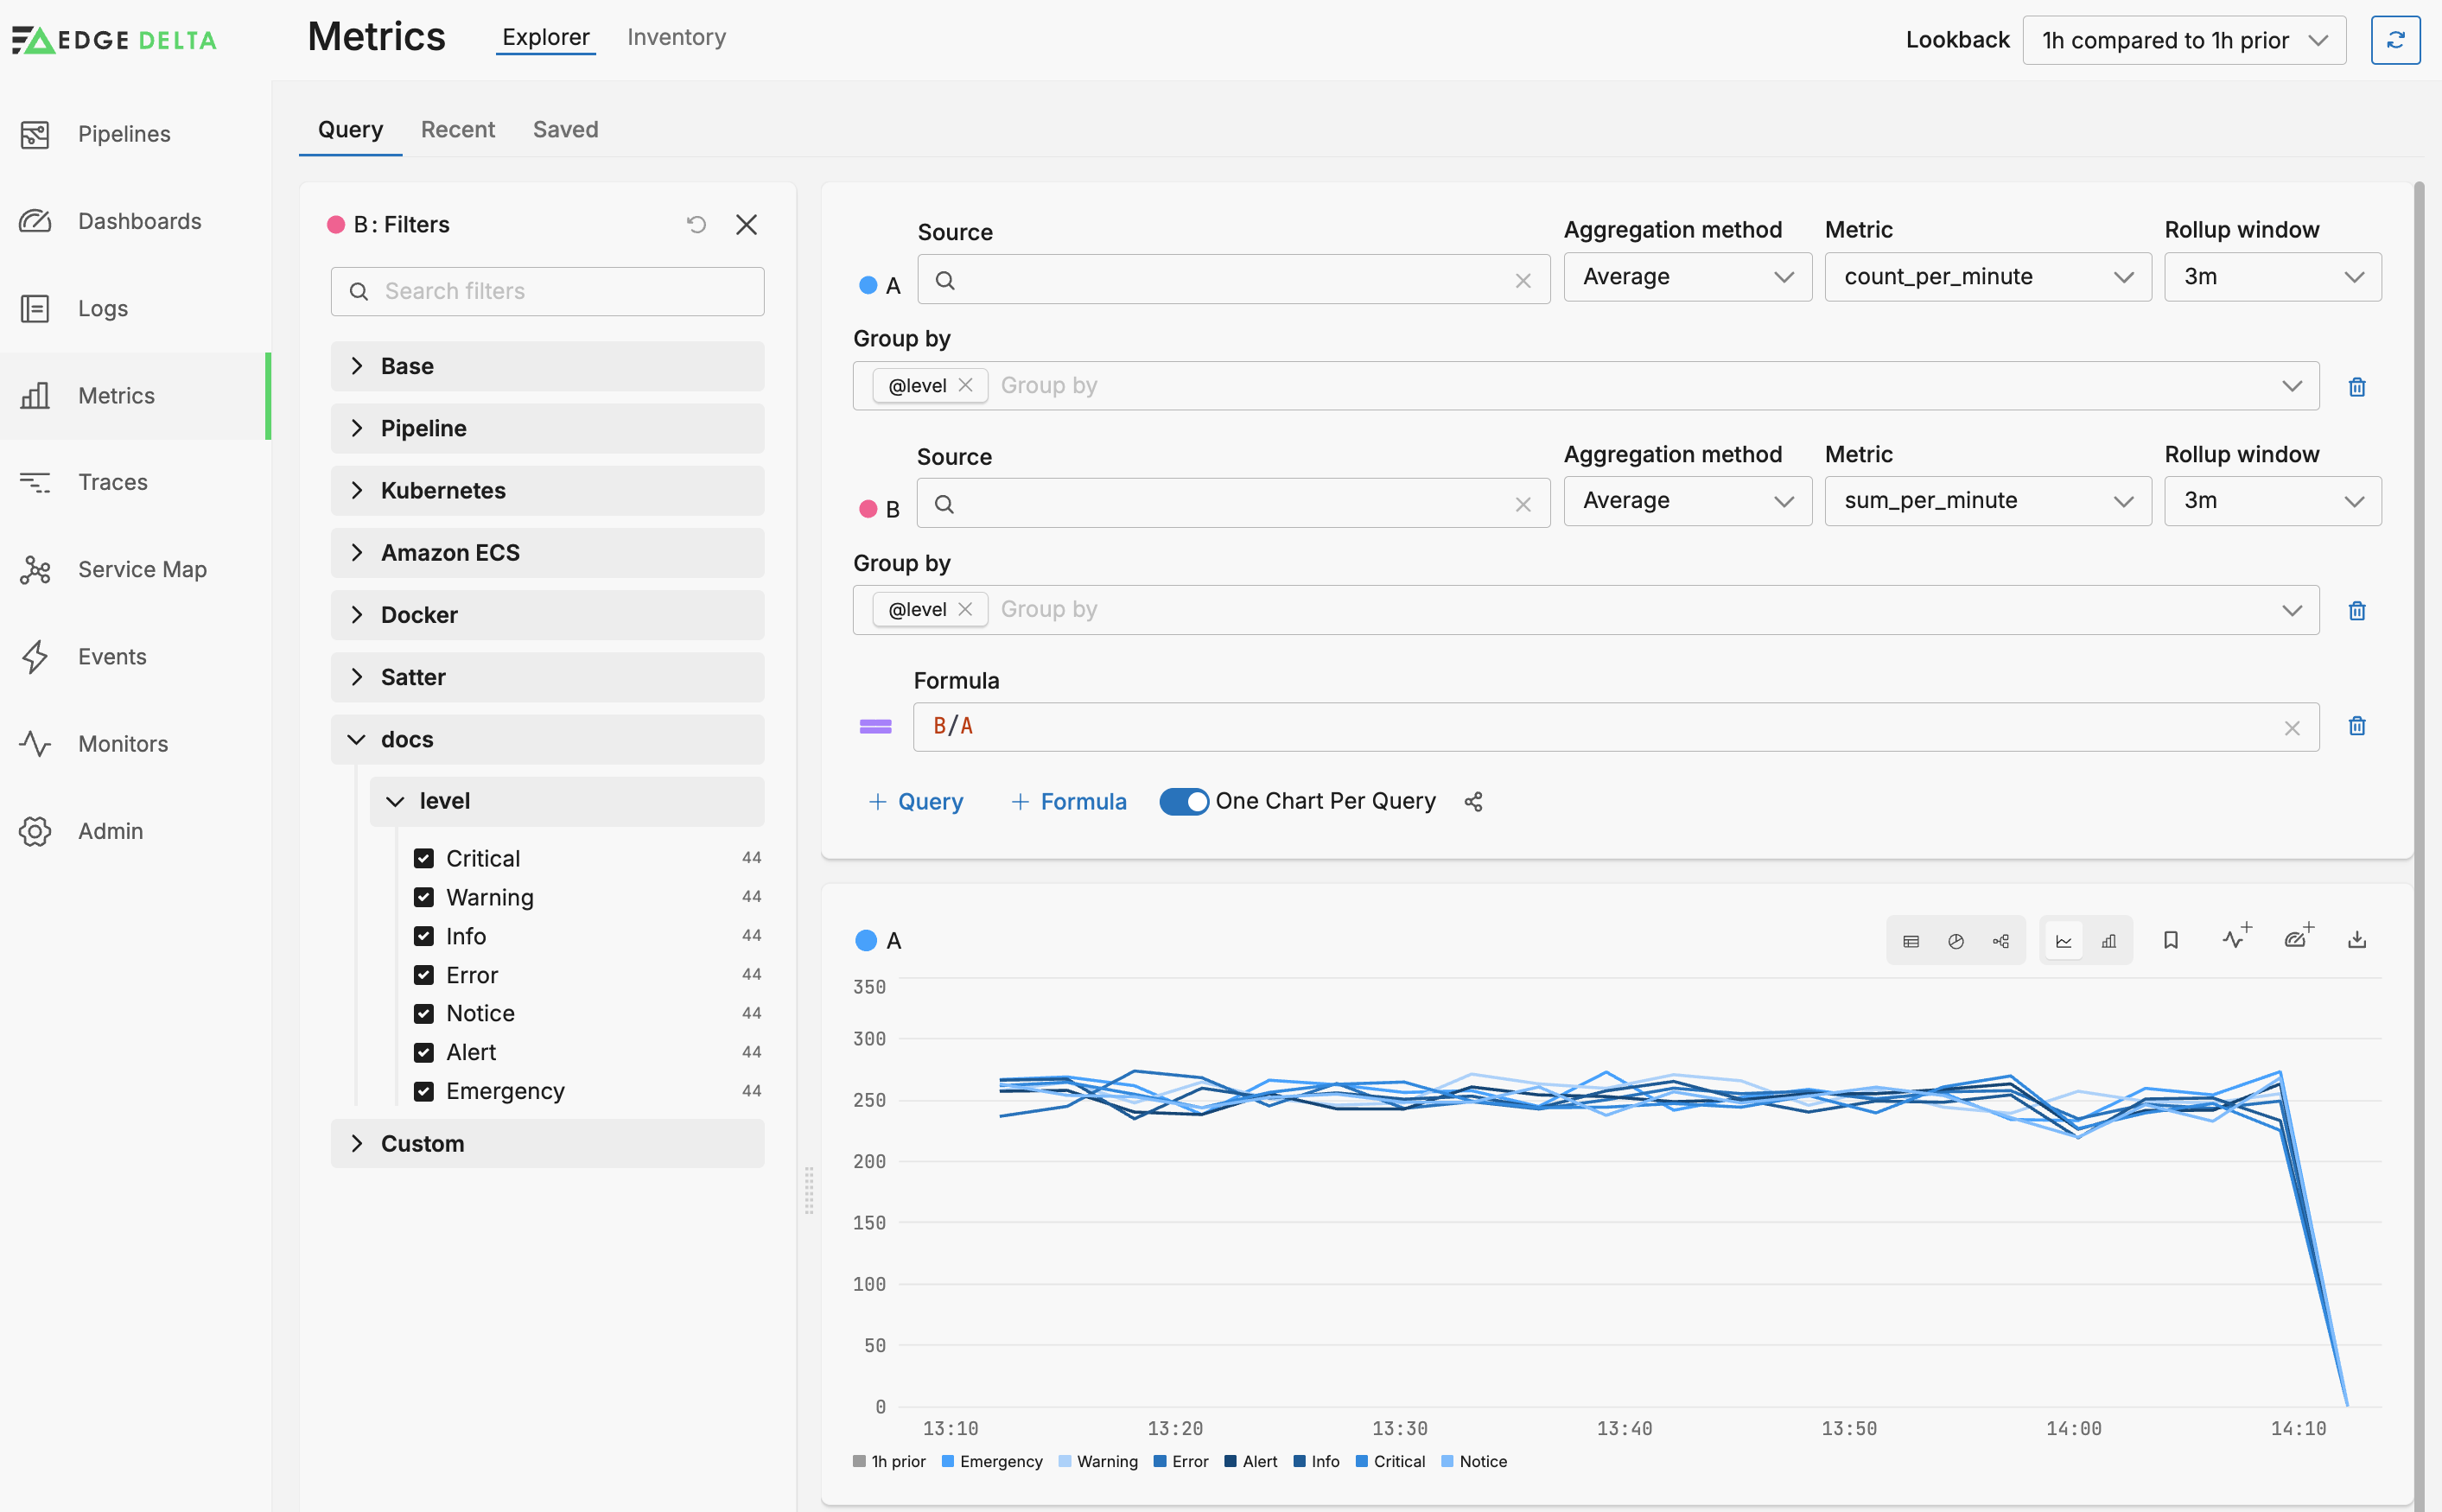
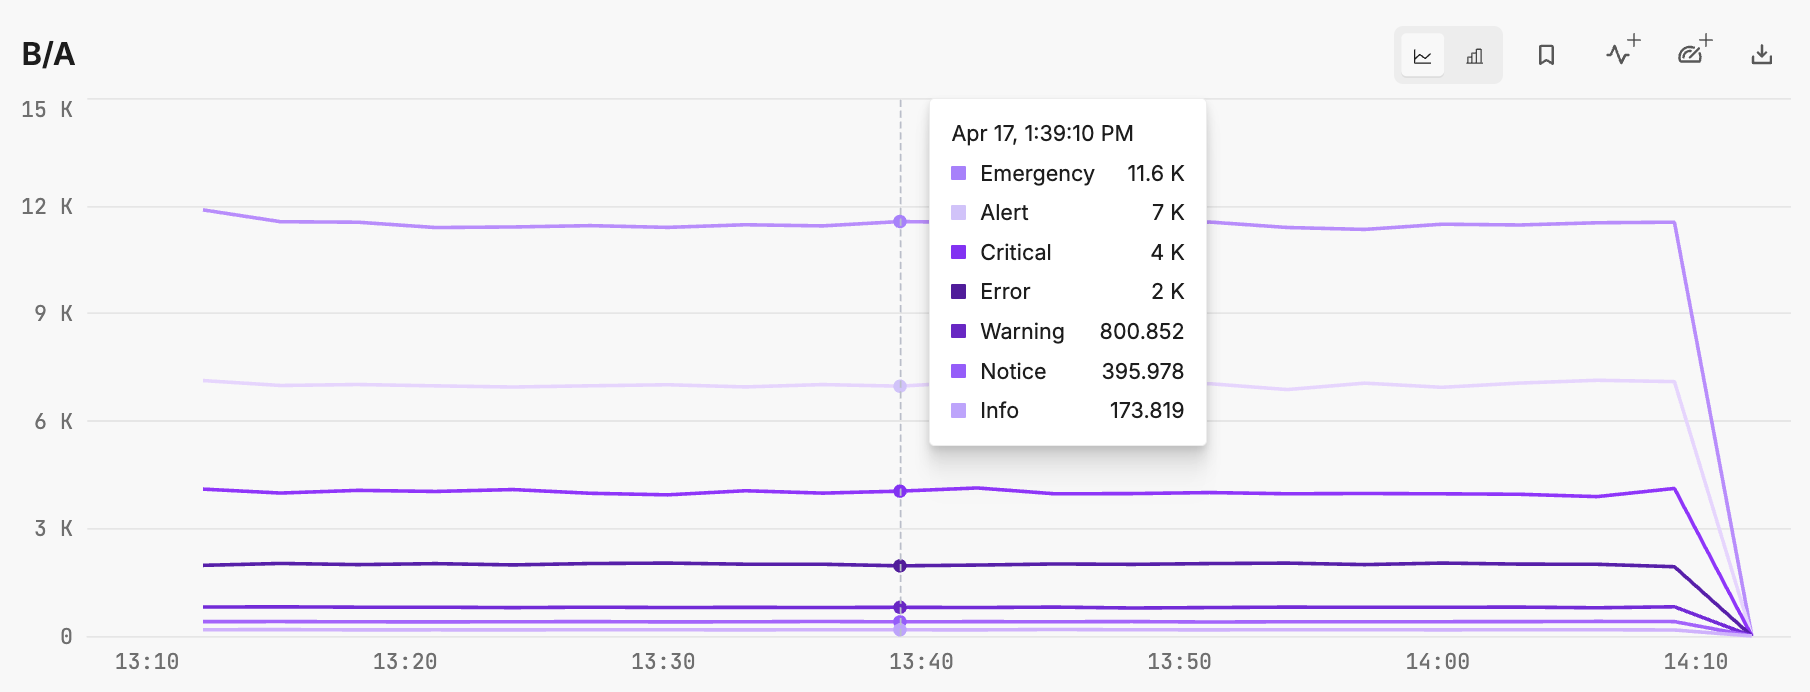
You can select the connection_timeout
metric in the Metrics Explorer.
Numeric Capture
This example matches any part of a log line that contains Response Time:
followed by one or more digits (\d+)
, and ends with ms
. It captures the numeric value representing the response time in milliseconds. The numeric values captured are turned into metrics with the base name response
. In the test pane, on the Processor tab, you can drop in sample logs and view the output metric items.
Numeric captures must use a named capture group with a corresponding numeric dimension.
YAML Version:
nodes:
- name: numeric_capture
type: log_to_metric
pattern: 'Response Time: (?P<response>\d+)ms'
interval: 1m0s
skip_empty_intervals: false
only_report_nonzeros: false
enabled_stats:
- min
- max
- avg
dimension_groups:
- numeric_dimension: response
Input logs:
WARN Slow response detected, Response Time: 300ms
DEBUG Request finished, Response Time: 150ms
ERROR Service timeout, Response Time: 500ms
INFO Processed request with Response Time: 100ms
Output in Node Test Pane:
This is one of the output metrics in the node test pane. Note the metric name: numeric_capture_response.avg
.
{
"_type": "metric"
"gauge": {
"value": 262.5
}
"kind": "gauge"
"name": "numeric_capture_response.avg"
"resource": { • • • }
"start_timestamp": 1708445617679
"timestamp": 1708445677679
"unit": "1"
"_stat_type": "avg"
}
Output in Metric Explorer:
You can select the metric name numeric_capture_response.avg
in the Metric Explorer.
Dimension Counter
If named captures in the regex pattern are dimensions, and dimension groups are given, then dimension occurrence stats are generated.
YAML Version:
nodes:
- name: dimension_counter
type: log_to_metric
pattern: HTTP/1.1" (?P<status_code>\d{3})
interval: 1m0s
skip_empty_intervals: false
only_report_nonzeros: false
metric_name: dimension_counter
enabled_stats:
- count
dimension_groups:
- dimensions:
- status_code
Input logs:
192.168.1.1 - - [12/Apr/2023:15:31:23 +0000] "GET /index.html HTTP/1.1" 200 4523
192.168.1.2 - - [12/Apr/2023:15:32:41 +0000] "POST /login HTTP/1.1" 401 1293
192.168.1.3 - - [12/Apr/2023:15:33:09 +0000] "GET /does-not-exist HTTP/1.1" 404 523
192.168.1.4 - - [12/Apr/2023:15:34:46 +0000] "GET /server-error HTTP/1.1" 500 642
192.168.1.1 - - [12/Apr/2023:15:35:22 +0000] "GET /contact HTTP/1.1" 200 2312
Output This is one of the output metrics in the node test pane.
{
"_type": "metric"
"attributes": {
"status_code": "500"
}
"gauge": {
"value": 1
}
"kind": "gauge"
"name": "dimension_counter.count"
"resource": {
"ed.conf.id": "87654321-1321-69874-9456-s5123456h7"
"ed.org.id": "12345678-1s2d-6f5d4-9632-s5d3f6g9h7"
"ed.tag": "ed_parallel"
"host.ip": "10.0.0.1"
"host.name": "ED_TEST"
"src_type": ""
}
"start_timestamp": 1707743964047
"timestamp": 1707744024047
"unit": "1"
"_stat_type": "count"
}
View dimensions in the Metric Explorer
To view the metric with its dimensions in the Metrics Explorer:
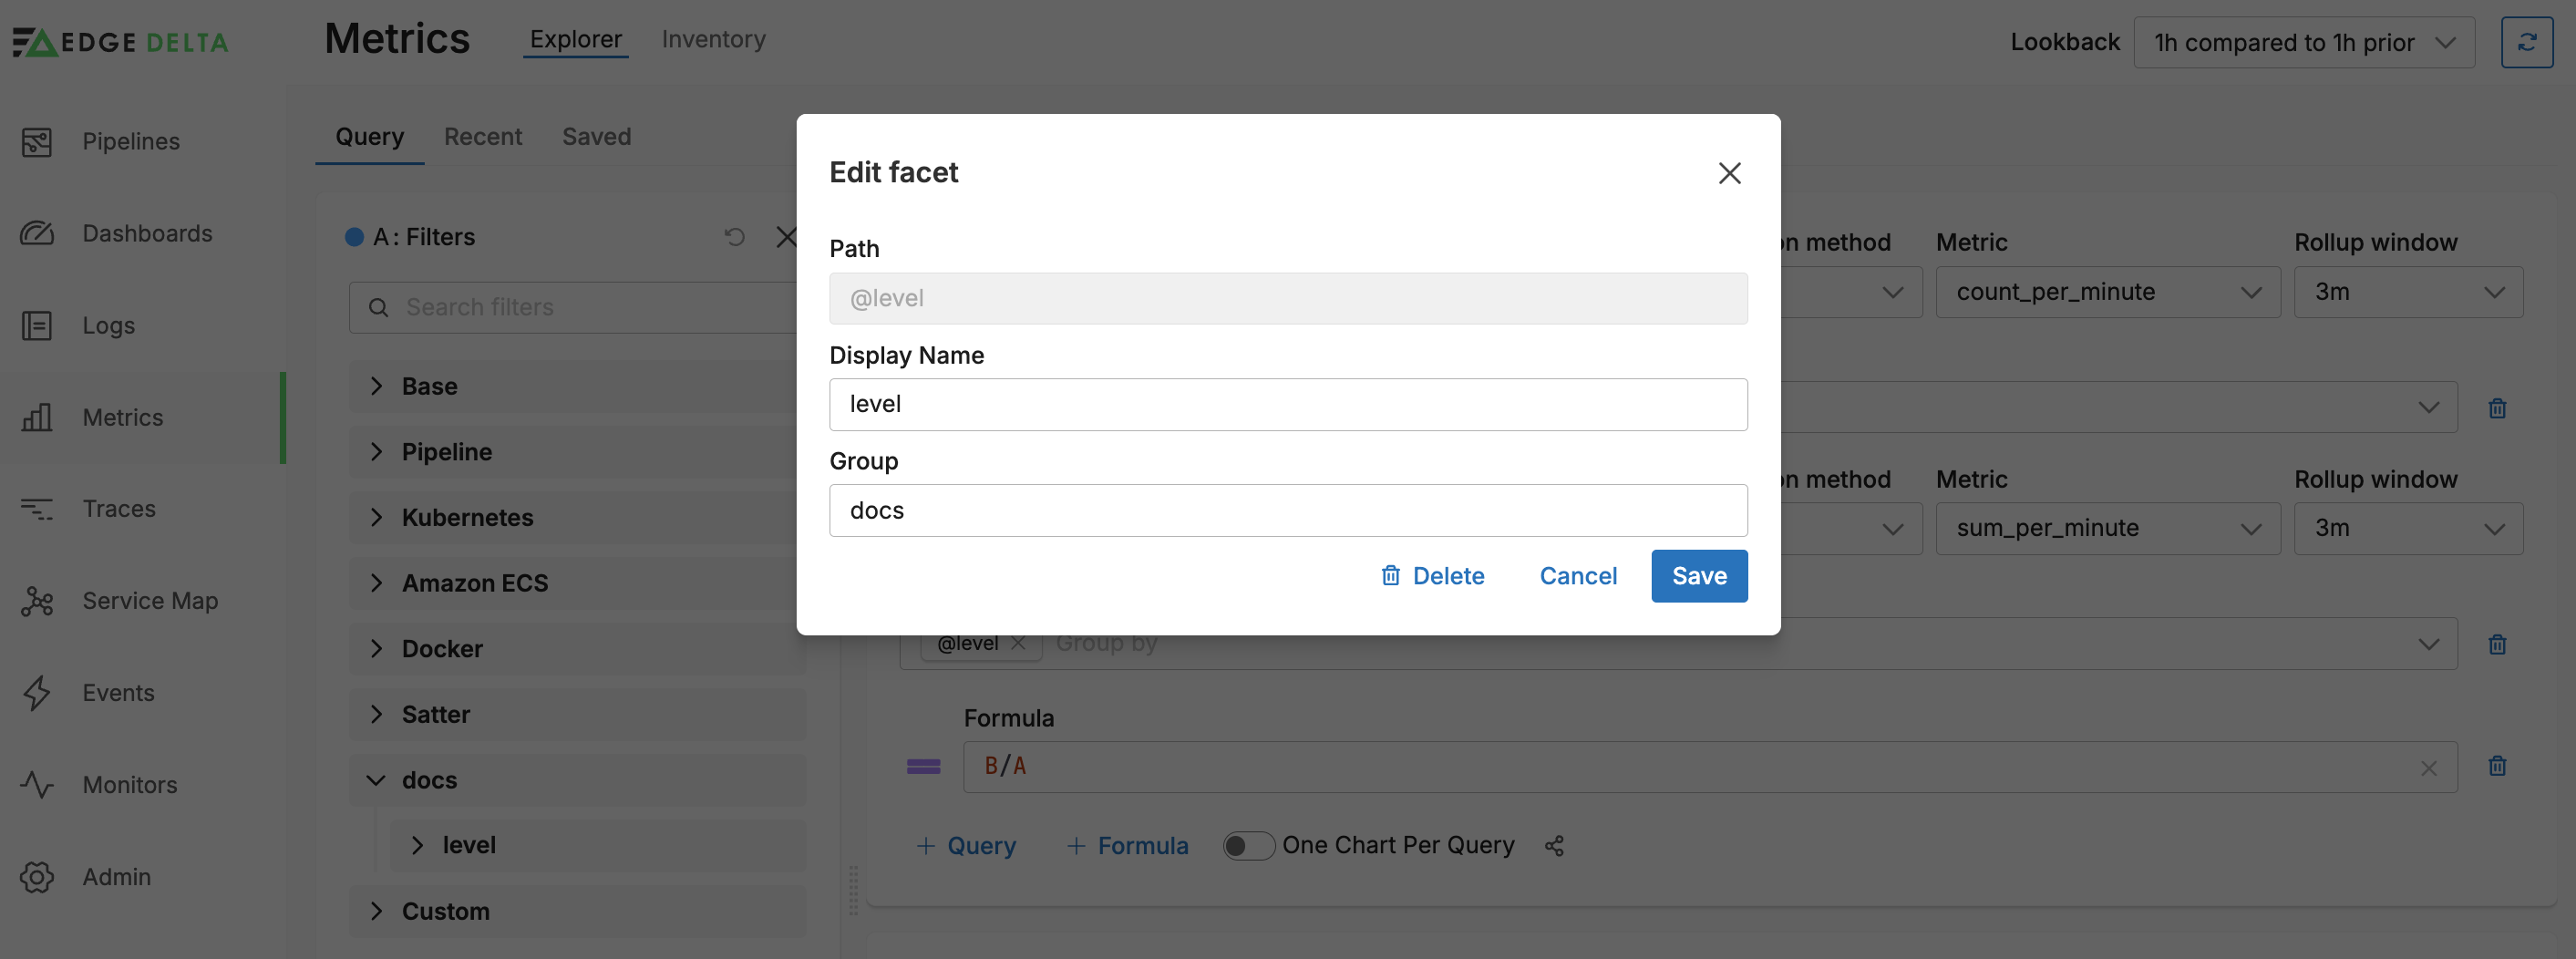
- Create a custom facet:
- Configure the custom facet using the CSL for the attribute:
@status_code
. In this example it is set in the Custom group.
- Enter the metric name in the search bar, in this example,
dimension_counter.count
:
- Select Group By @status_code.
Dimension Numeric Capture
If both dimension and numeric captures are defined in the regex pattern and also in one of the dimension groups, then numeric stats per dimension and per numeric value are generated.
Example 1
This configuration extracts the HTTP method (e.g., GET, PUT, POST) and the associated latency every minute. It reports the average latency, classified by the method. This could be useful for monitoring and alerting on the performance characteristics of different types of HTTP requests being processed by a system.
YAML Version:
nodes:
- name: latency_per_method
type: log_to_metric
pattern: method:(?P<method>\w+).+latency:(?P<latency>\d+)ms
interval: 1m0s
skip_empty_intervals: false
only_report_nonzeros: false
metric_name: method
enabled_stats:
- avg
dimension_groups:
- dimensions:
- method
numeric_dimension: latency
- pattern: This is a regular expression used to match and capture specific parts of the log data. In this case, the pattern is looking for the string “method:” followed by one or more word characters (\w+), which are captured as the group named method, and the string “latency:” followed by one or more digits (\d+), which are captured as the group named latency. The ms at the end indicates that the latency is measured in milliseconds and it closes the pattern.
- interval: This indicates the frequency at which metrics are gathered from the logs. Here, it’s set to one minute.
- skip_empty_intervals: When set to false, this means that the system will report intervals even if no matching log entries are found. If this were true, intervals with no data would be skipped.
- only_report_nonzeros: When set to false, the system will report metrics even if they are zero. If this were true, it would only report if values were above zero.
- metric_name: This is the base name for the metrics generated from this configuration.
- enabled_stats: This is a list of statistical functions to run on the numeric data extracted from the logs. In this case, only the average
avg
is being calculated. - dimension_groups:
- dimensions: These are the attributes that will be used to categorize the metric data. Here, the dimension is based on the
method
captured by the regex pattern. - numeric_dimension: This is the numeric value that will be tracked across dimensions. In this configuration, the numeric capture for
latency
is being used.
- dimensions: These are the attributes that will be used to categorize the metric data. Here, the dimension is based on the
Input logs:
Suppose following logs are fed into the pipeline:
2024-05-07T14:41:38.597Z FATAL middleware/authz.go:383 node10 request failed spec:{uri:/v1/orgs/365399e9-c2b2-48bd-85a4-355b9465ee34/confs/- method:PUT user:user340 ip:192.168.1.54 platform:web} latency:748ms
2024-05-07T14:42:08.282Z FATAL middleware/authz.go:383 node10 request failed spec:{uri:/v1/orgs/7bcbf017-6cc9-4473-bbd0-93ccd7881bb9/confs/- method:GET user:user151 ip:192.168.1.250 platform:web} latency:1908ms
2024-05-07T14:42:11.078Z WARN middleware/authz.go:383 node10 request failed spec:{uri:/v1/orgs/5a28fc07-88cd-4bb5-a3e5-0e3b00cb7a39/confs/- method:POST user:user907 ip:192.168.1.248 platform:web} latency:232ms
2024-05-07T14:42:24.537Z DEBUG middleware/authz.go:383 node10 request successful spec:{uri:/v1/orgs/0847b316-a525-4766-9dba-25ea69825e57/confs/- method:GET user:user304 ip:192.168.1.207 platform:mobile_app} latency:371ms
Output
This is one of the output metrics in the node test pane.
{
"_type": "metric"
"attributes": {
"method": "PUT"
}
"gauge": {
"value": 748
}
"kind": "gauge"
"name": "method_latency.avg"
"resource": { • • • }
"start_timestamp": 1715093736814
"timestamp": 1715093796814
"unit": "1"
"_stat_type": "avg"
}
View dimensions in the Metric Explorer
To view the metric with its dimensions in the Metrics Explorer:
- Create a custom facet:
- Configure the custom facet using the CSL for the attribute:
@method
. In this example it is set in the Custom group.
- Enter the metric name in the search bar, in this example,
method_latency.avg
:
- Select Group By @method.
Field Path Capture
The log to metric node can be configured to extract metrics from dimensions that you specify with a field path. When you generate metrics from dimensions you use a catch-all pattern .*
. This evaluates all logs for the dimension (a field) and generates metrics based on that field’s parameters.
For example, you can generate a count of the severity field as a dimension with a catch all pattern: .*
. .
pattern: .*
...
dimension_groups:
- field_dimensions:
- item["severity_text"]
This will create metrics that count each severity level your logs generate for the interval.
Note: You can specify a capture group dimension and field path dimensions, but you can only specify one numeric dimension: either using a capture group or by using the
field_numeric_dimension
.
Example
In this example a catch-all pattern is used and a dimension field is defined with a CEL macro pointing to a JSON item in the body. For each dimension within that single dimension group, a numeric dimension is captured.
YAML Version:
- name: field_path_dimensions
type: log_to_metric
pattern: .*
interval: 1m0s
skip_empty_intervals: false
only_report_nonzeros: false
dimension_groups:
- field_dimensions:
- json(item["body"]).service
field_numeric_dimension: json(item["body"]).details.response_time_ms
Input logs:
Suppose following logs are fed into the pipeline:
{"timestamp": "2024-12-27T14:53:41Z", "level": "info", "service": "webserver_node18", "details": {"status_code": 200, "response_time_ms": 150, "user": {"id": "U12345", "name": "Raptor5166"}, "session": {"id": "S98765", "cart_items": 3}}}
{"timestamp": "2024-12-27T14:54:15Z", "level": "error", "service": "database_node18", "details": {"status_code": 500, "query_time_ms": 3000, "user": {"id": "Q54321", "name": "dbsys"}, "error": {"code": "DB_TIMEOUT", "message": "Query execution timed out"}}}
{"timestamp": "2024-12-27T14:55:05Z", "level": "info", "service": "authentication_node18", "details": {"status_code": 200, "auth_time_ms": 50, "user": {"id": "U67890", "name": "Condor4"}, "auth": {"method": "OAuth2"}}}
{"timestamp": "2024-12-27T14:56:30Z", "level": "warn", "service": "webserver_node18", "details": {"status_code": 404, "response_time_ms": 25, "user": {"id": "U33456", "name": "owl_a1"}, "request": {"method": "GET", "resource": "/missing-page"}}}
Output
One of the metrics outputs, visible in the node test pane, would be as follows:
{
"_type": "metric"
"attributes": {
"dg_0_dim_0": "webserver_node18"
}
"gauge": {
"value": 87.5
}
"kind": "gauge"
"name": "field_path_dimensions_dg_0_num_dim.avg"
"resource": { • • • }
"start_timestamp": 1708422058420
"timestamp": 1708422118420
"unit": "1"
"_stat_type": "avg"
}
Note: A name for the
json(item["body"]).service
field was not specified in the Golang regex pattern using a named capture group so a default field name is generated. Similarly. a name for the metric was not specified in the configuration so a default name was generated.
View dimensions in the Metric Explorer
To view the metric with its dimensions in the Metrics Explorer:
- Create a custom facet:
- Configure the custom facet using the CSL for the attribute:
@dg_0_dim_0
. In this example it is set in the Custom group and you can give it a friendly name.
- Enter the metric name in the search bar, in this example,
field_path_dimensions_dg_0_num_dim.avg
.
- Select Group By Custom | Service Name.
View dimensions in Grafana
Metrics can be viewed using a third party metrics integration. For example, consider the preceding Dimension Counter example. To output to Grafana, you configure a Prometheus Exporter destination node with a label configured to pull its value from the status_code
attribute, using the attribute’s field path:
nodes:
- name: prometheus_exporter_output
type: prometheus_exporter_output
port: 8087
labels:
- name: platform_label
path: item["attributes"]["status_code"]
The Prometheus Exporter destination creates a metric as follows:
edgedelta_dimension_counter_count{container="edgedelta-agent", endpoint="prom", instance="172.18.0.2:8087", job="edgedelta-metrics", namespace="edgedelta", pod="edgedelta-8pgqc", service="edgedelta-metrics", status_code_label="401"}
Note the addition of the final field called status_code_label
that contains the status_code
attribute’s value.
The output in Grafana can then be viewed with these queries:
edgedelta_dimension_counter_count{status_code_label="200"}
edgedelta_dimension_counter_count{status_code_label="401"}
and so forth for 404, 500 and 200.