Metrics Inventory
3 minute read
Overview
The Metric Inventory enables you to take stock of your metric traffic volume across all pipelines and optimize your pipeline design accordingly. For example, you may discover a high volume metric that you are not very interested in using the Metric Inventory. You can easily remove that metric from your pipelines to reduce your environments processing and data handling overhead.
Inventory
Click the Metrics page and select the Inventory tab view the Metrics Inventory.
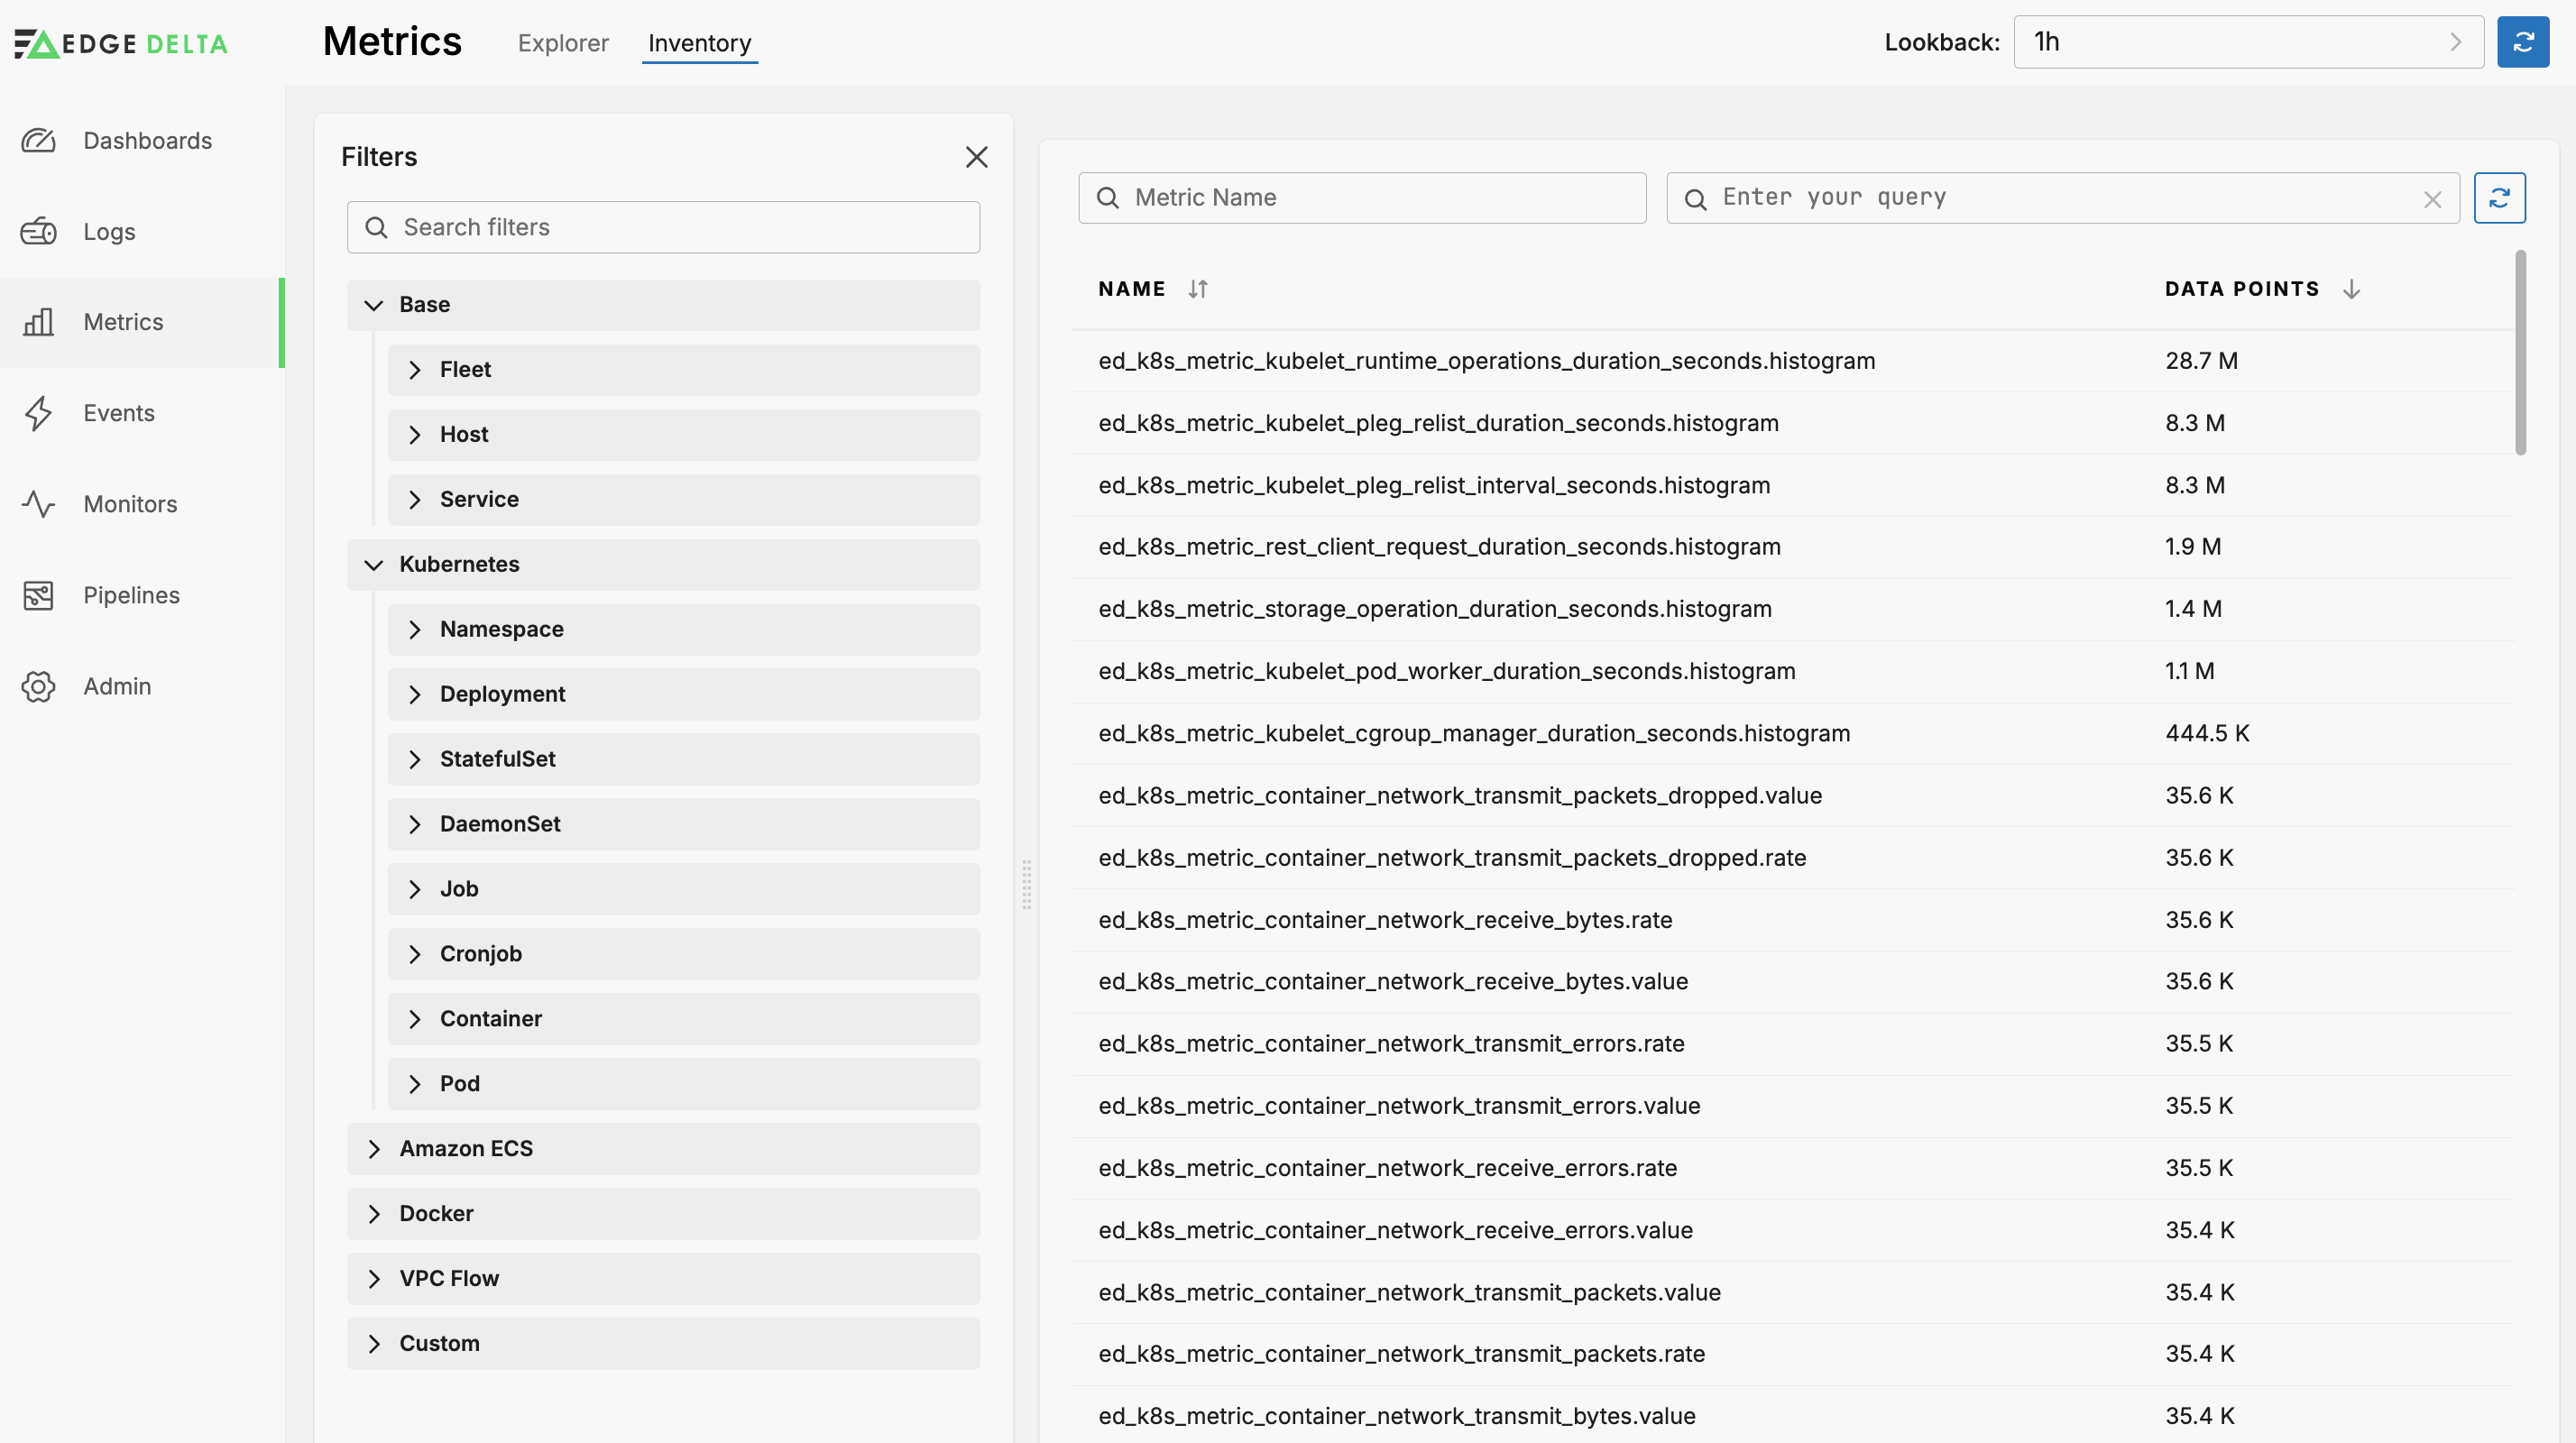
The Inventory lists all metrics handled by all your Edge Delta pipelines sorted in descending order by Data Points (the total of metric data items for the lookback period).
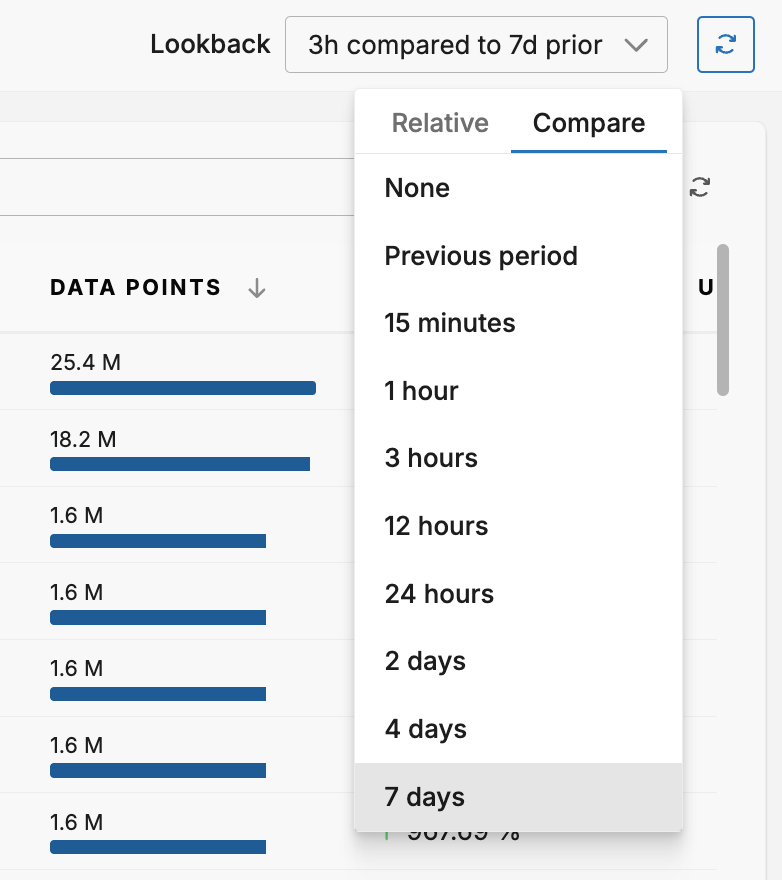
You can select the Lookback period and the comparison period. The comparison period takes the average of lookback intervals for the given period:
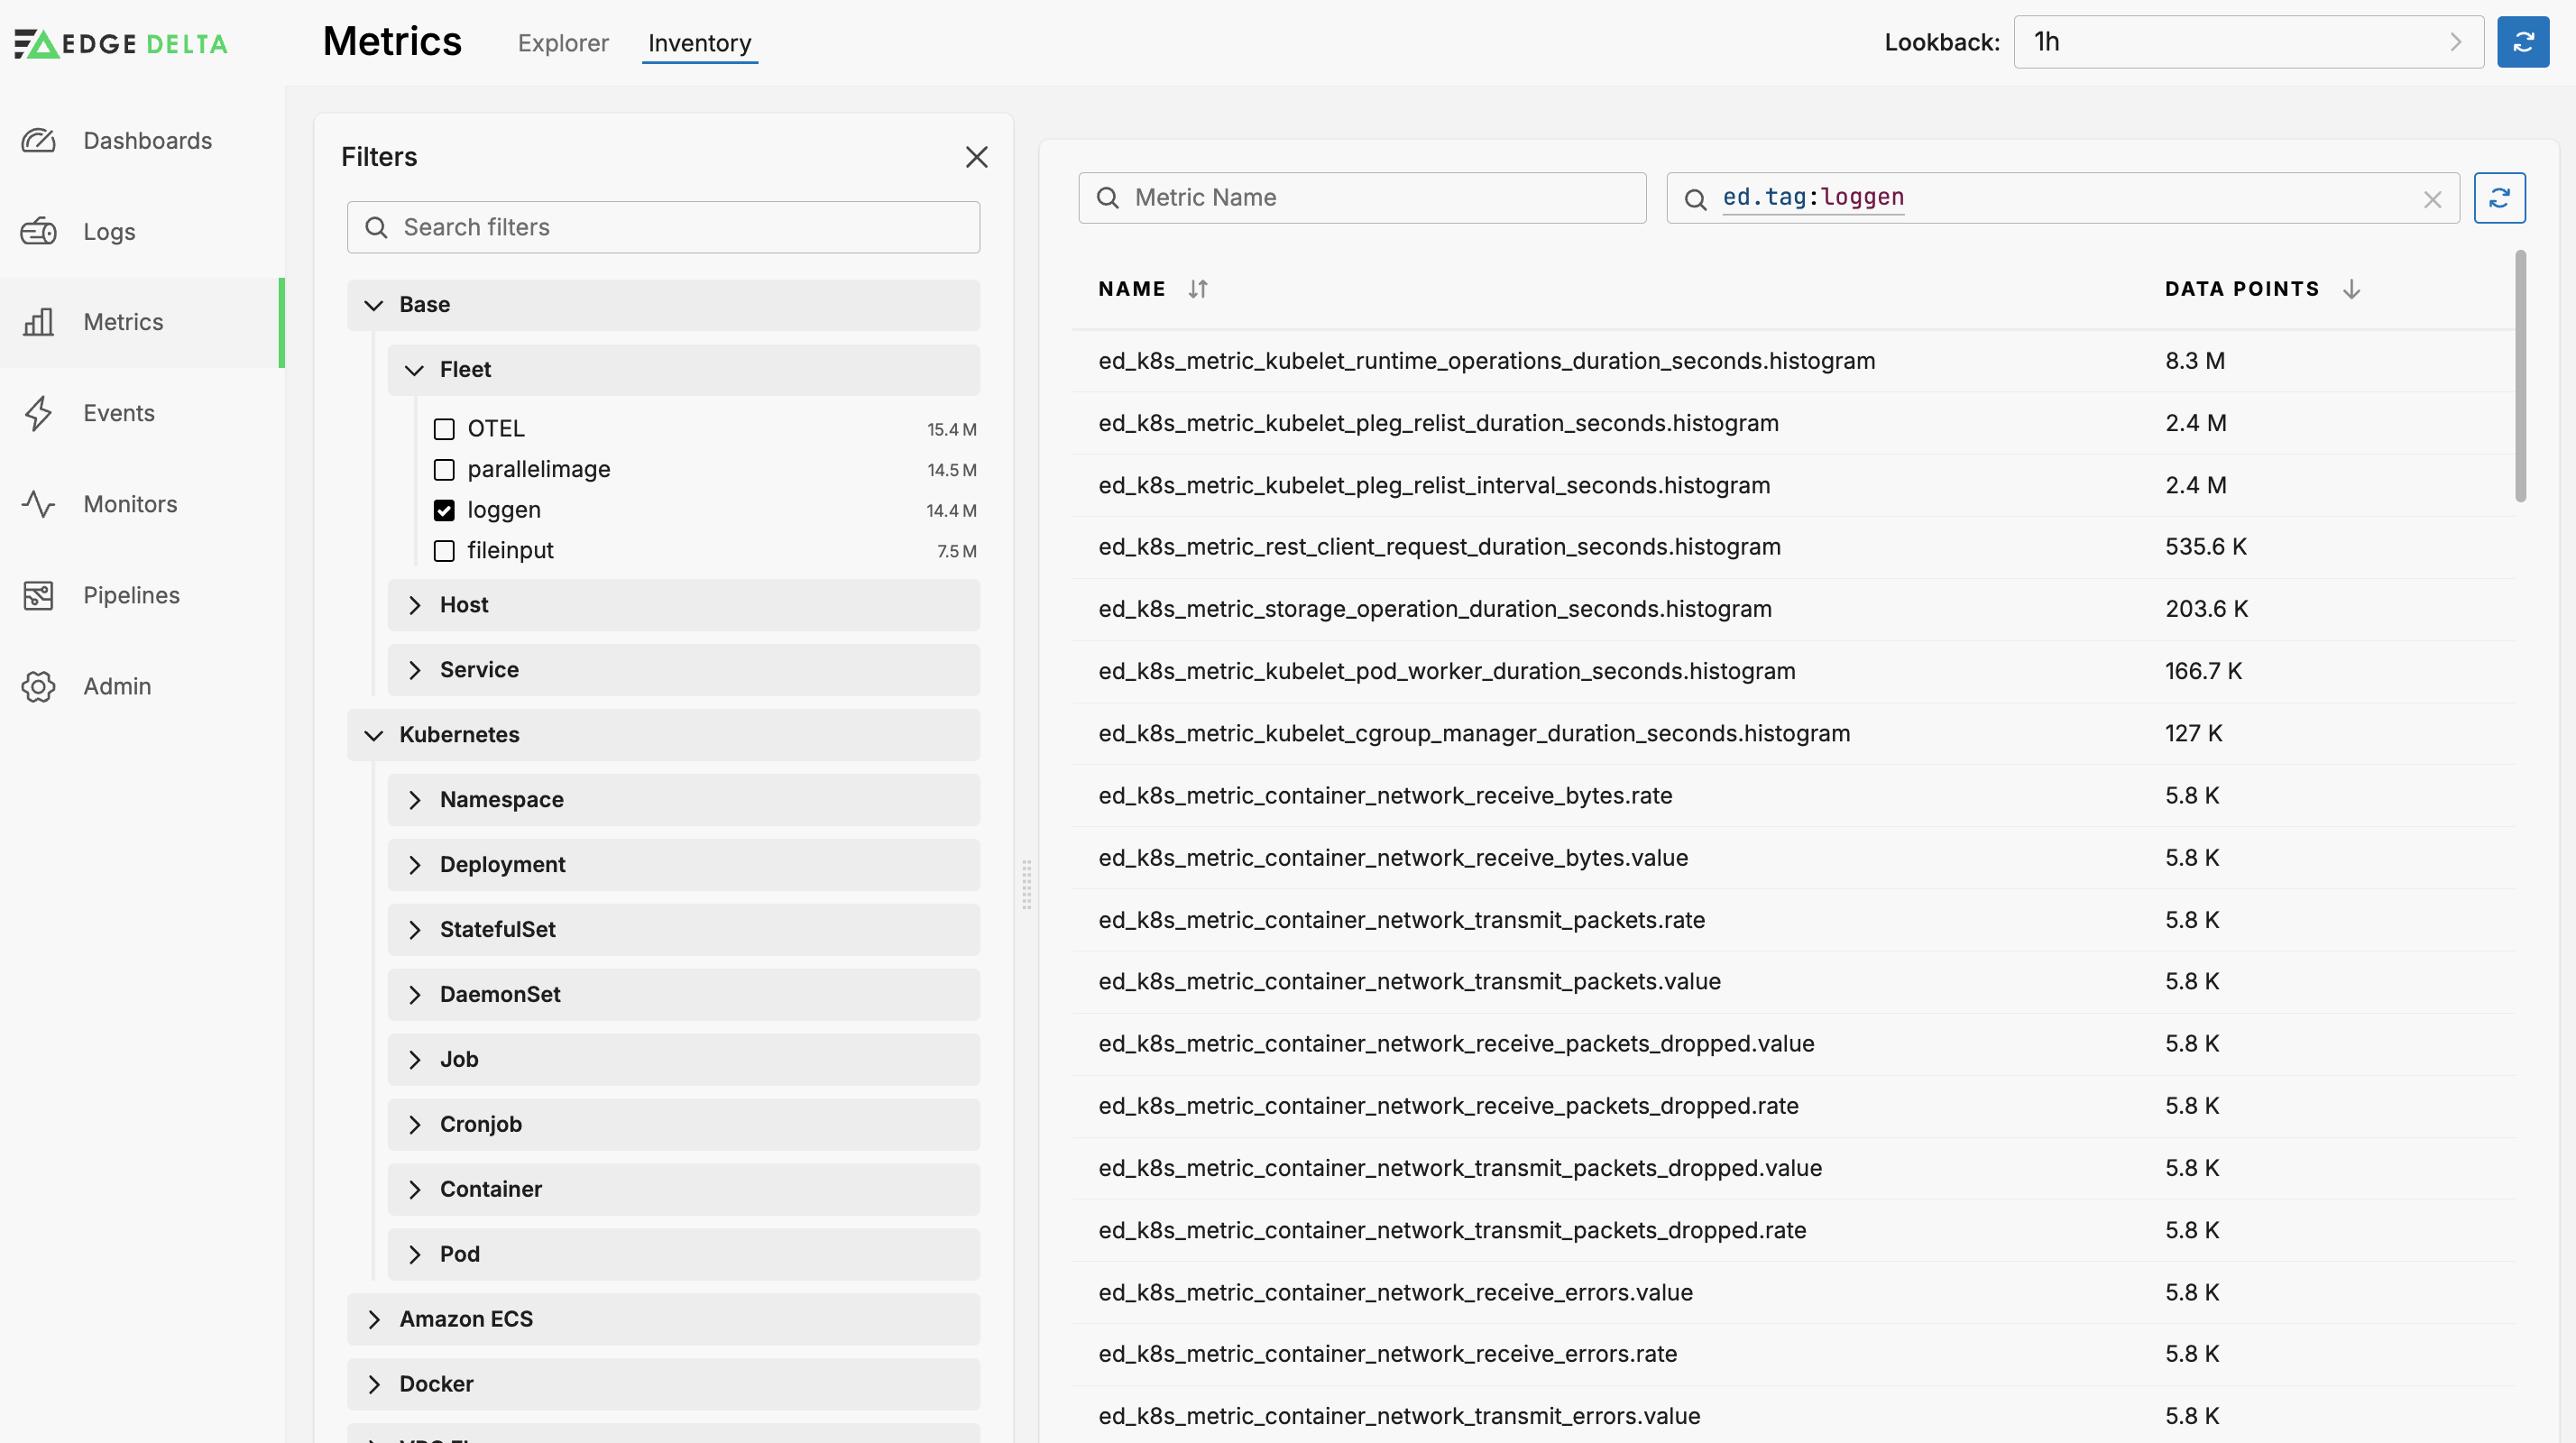
You can filter the list using the options in the Filter pane, including any custom facets you configured in the Metric Explorer, or you can enter a search query using CQL syntax. To learn about optimizing facet usage for better performance, see Effectively Using Facets.
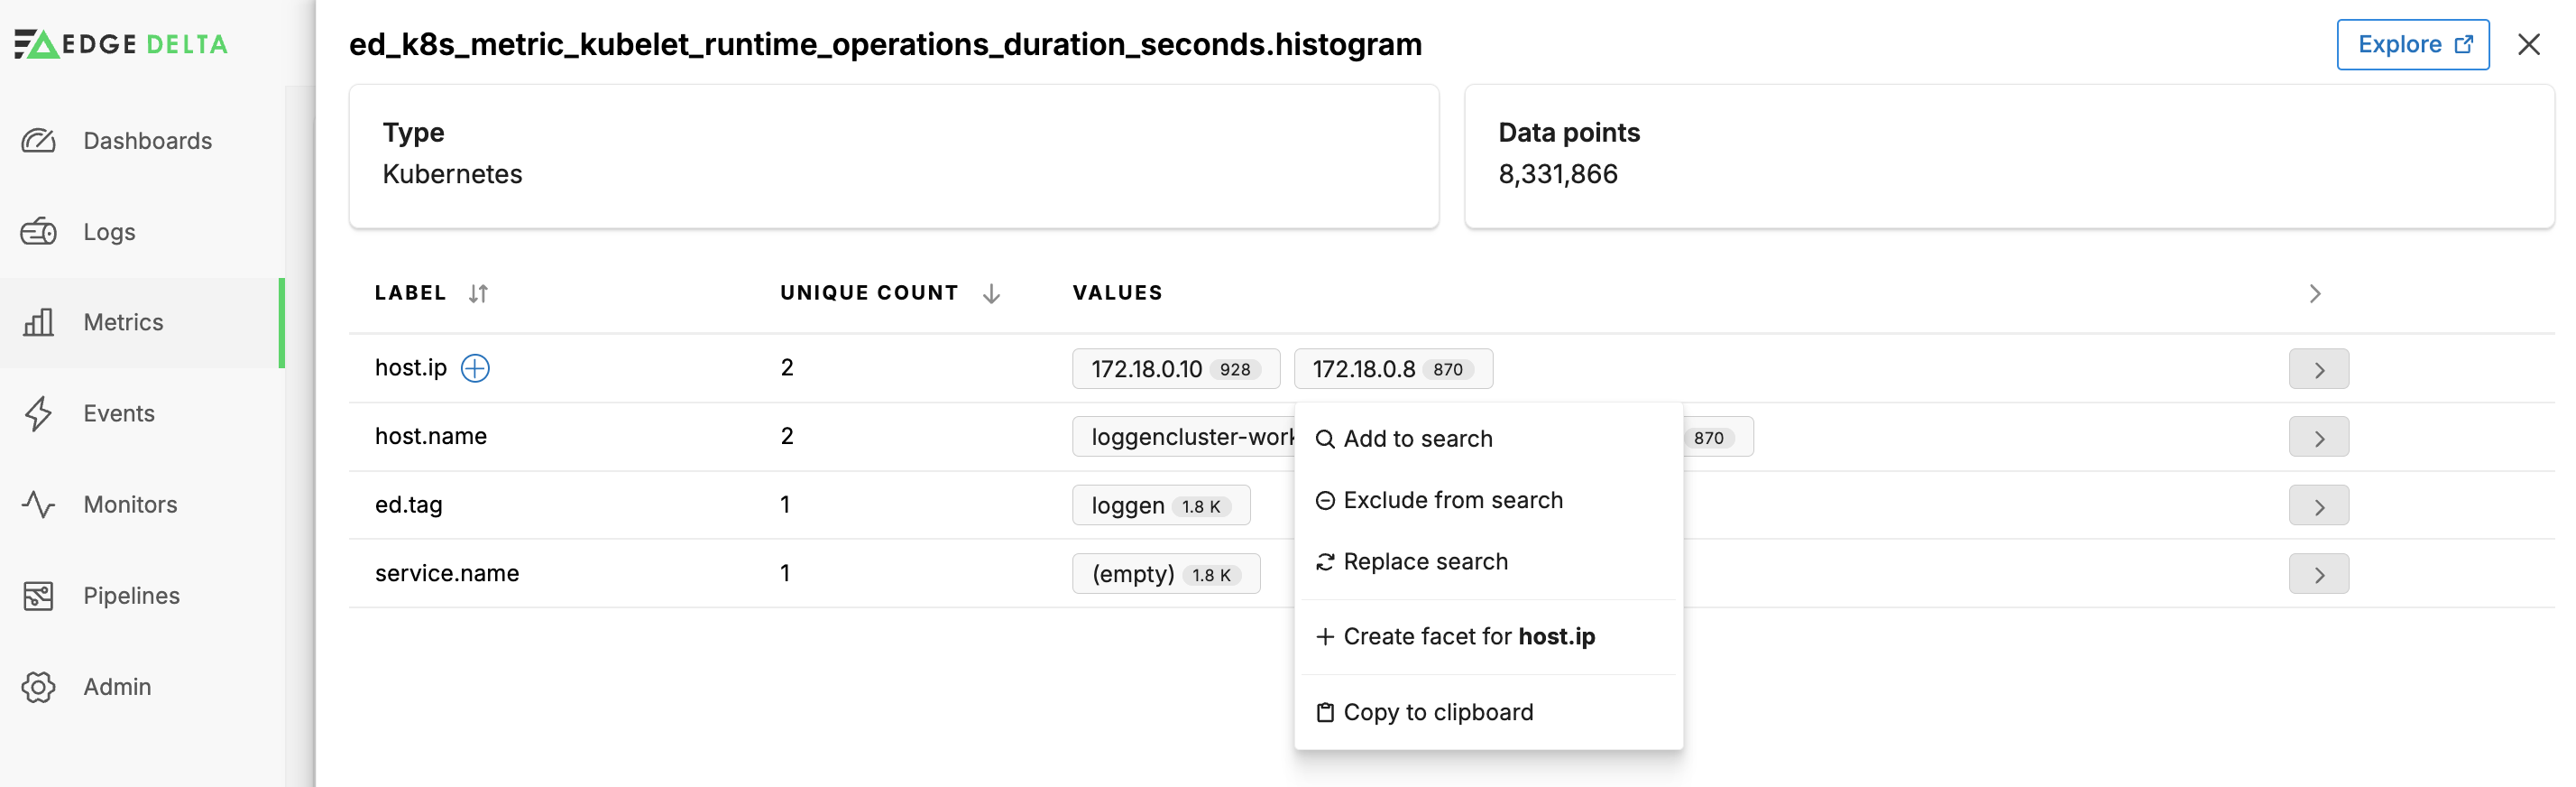
Click a metric to see its details. You can view the resources metadata.
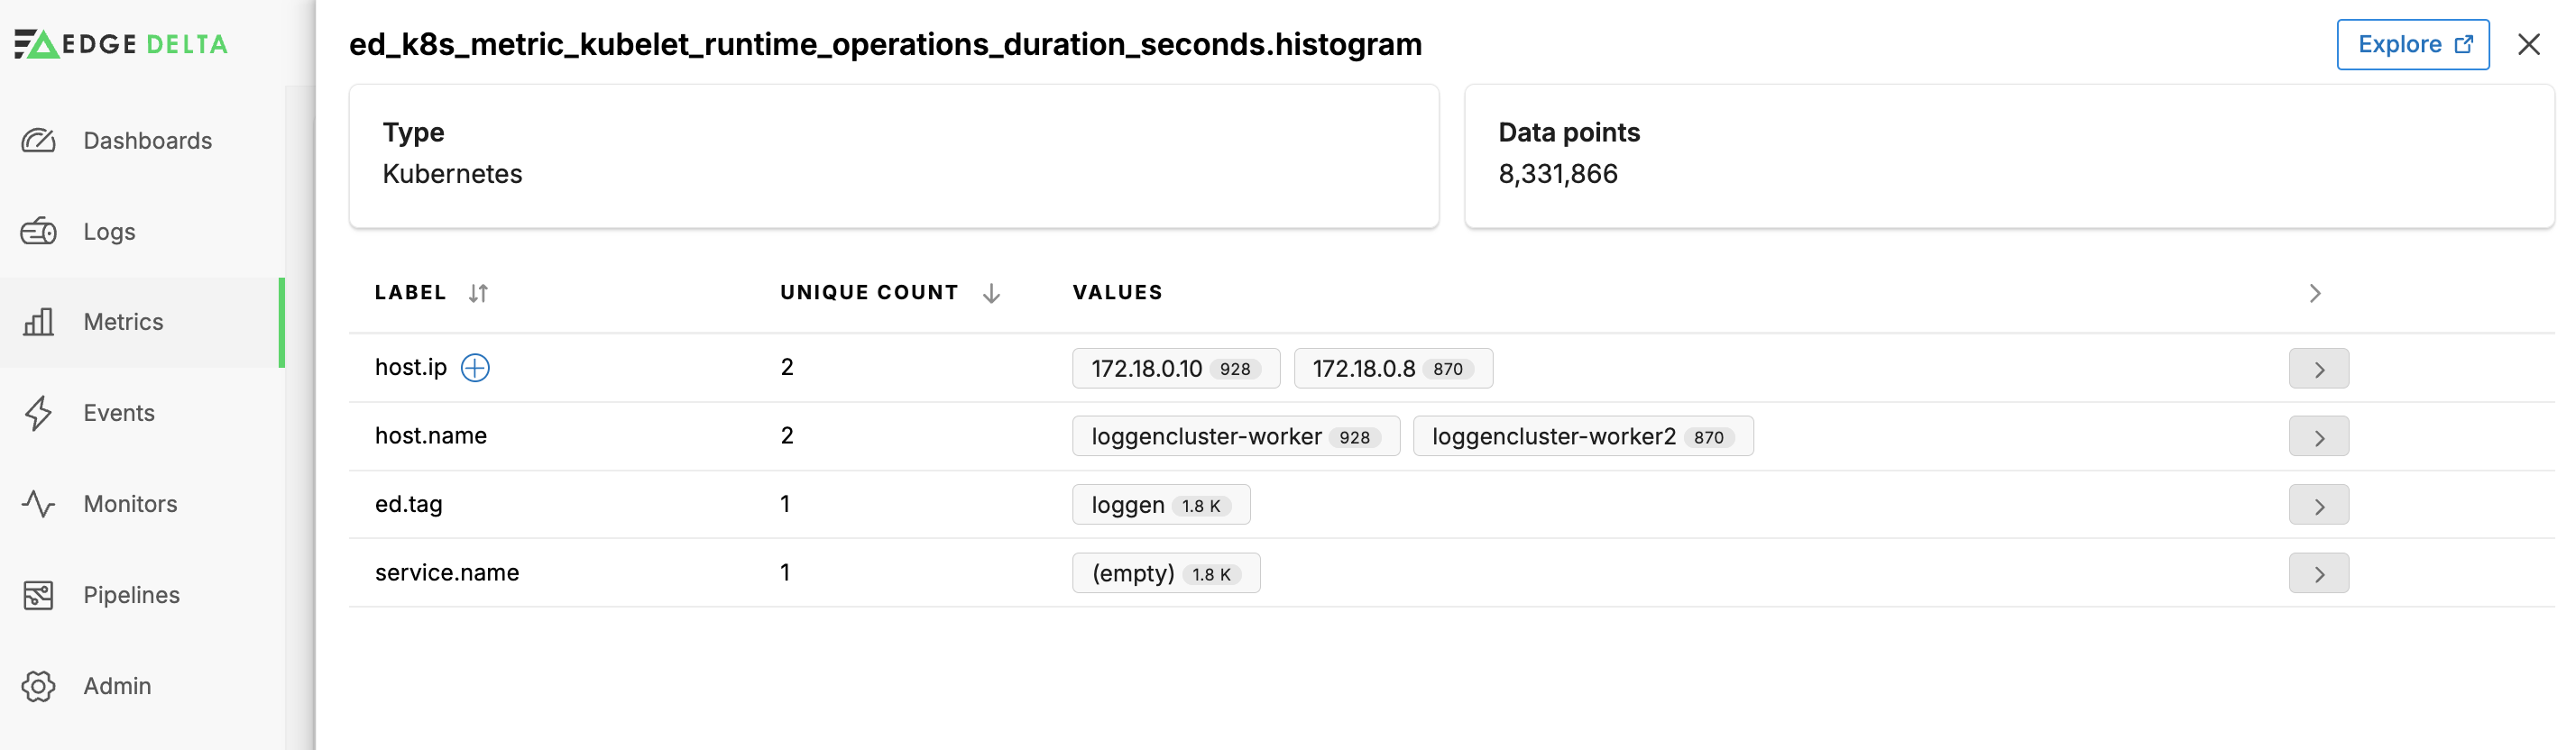
You can click a Facet Value or a Label’s + icon to add a custom facet for it.
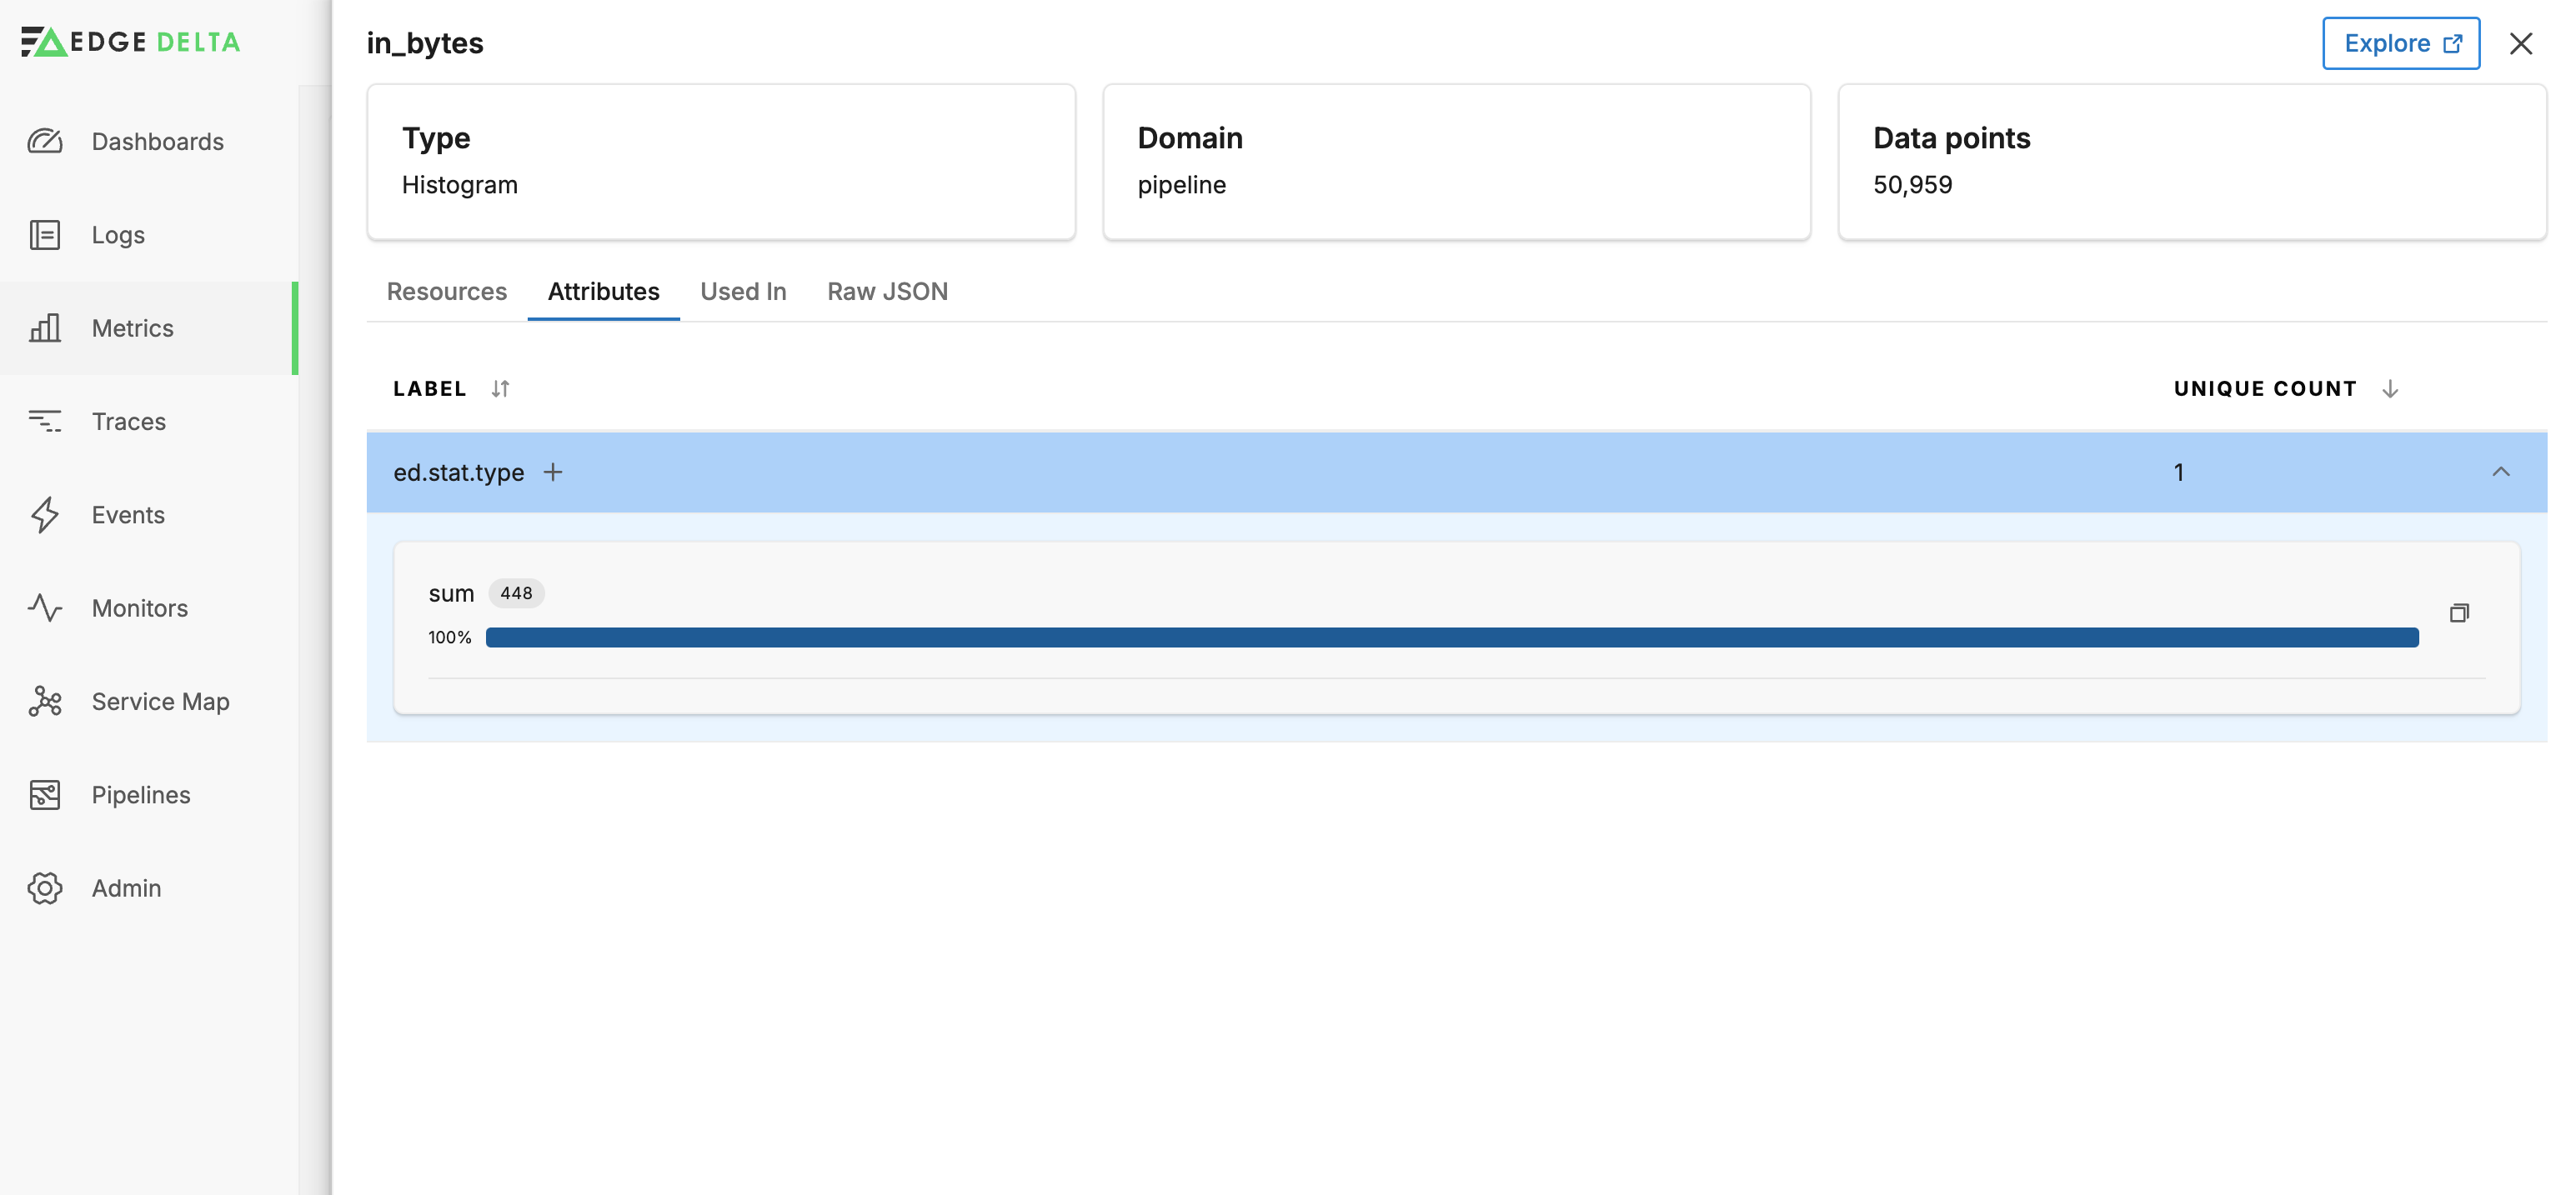
Click Attributes to explore the attribute metadata and create facets based off it.
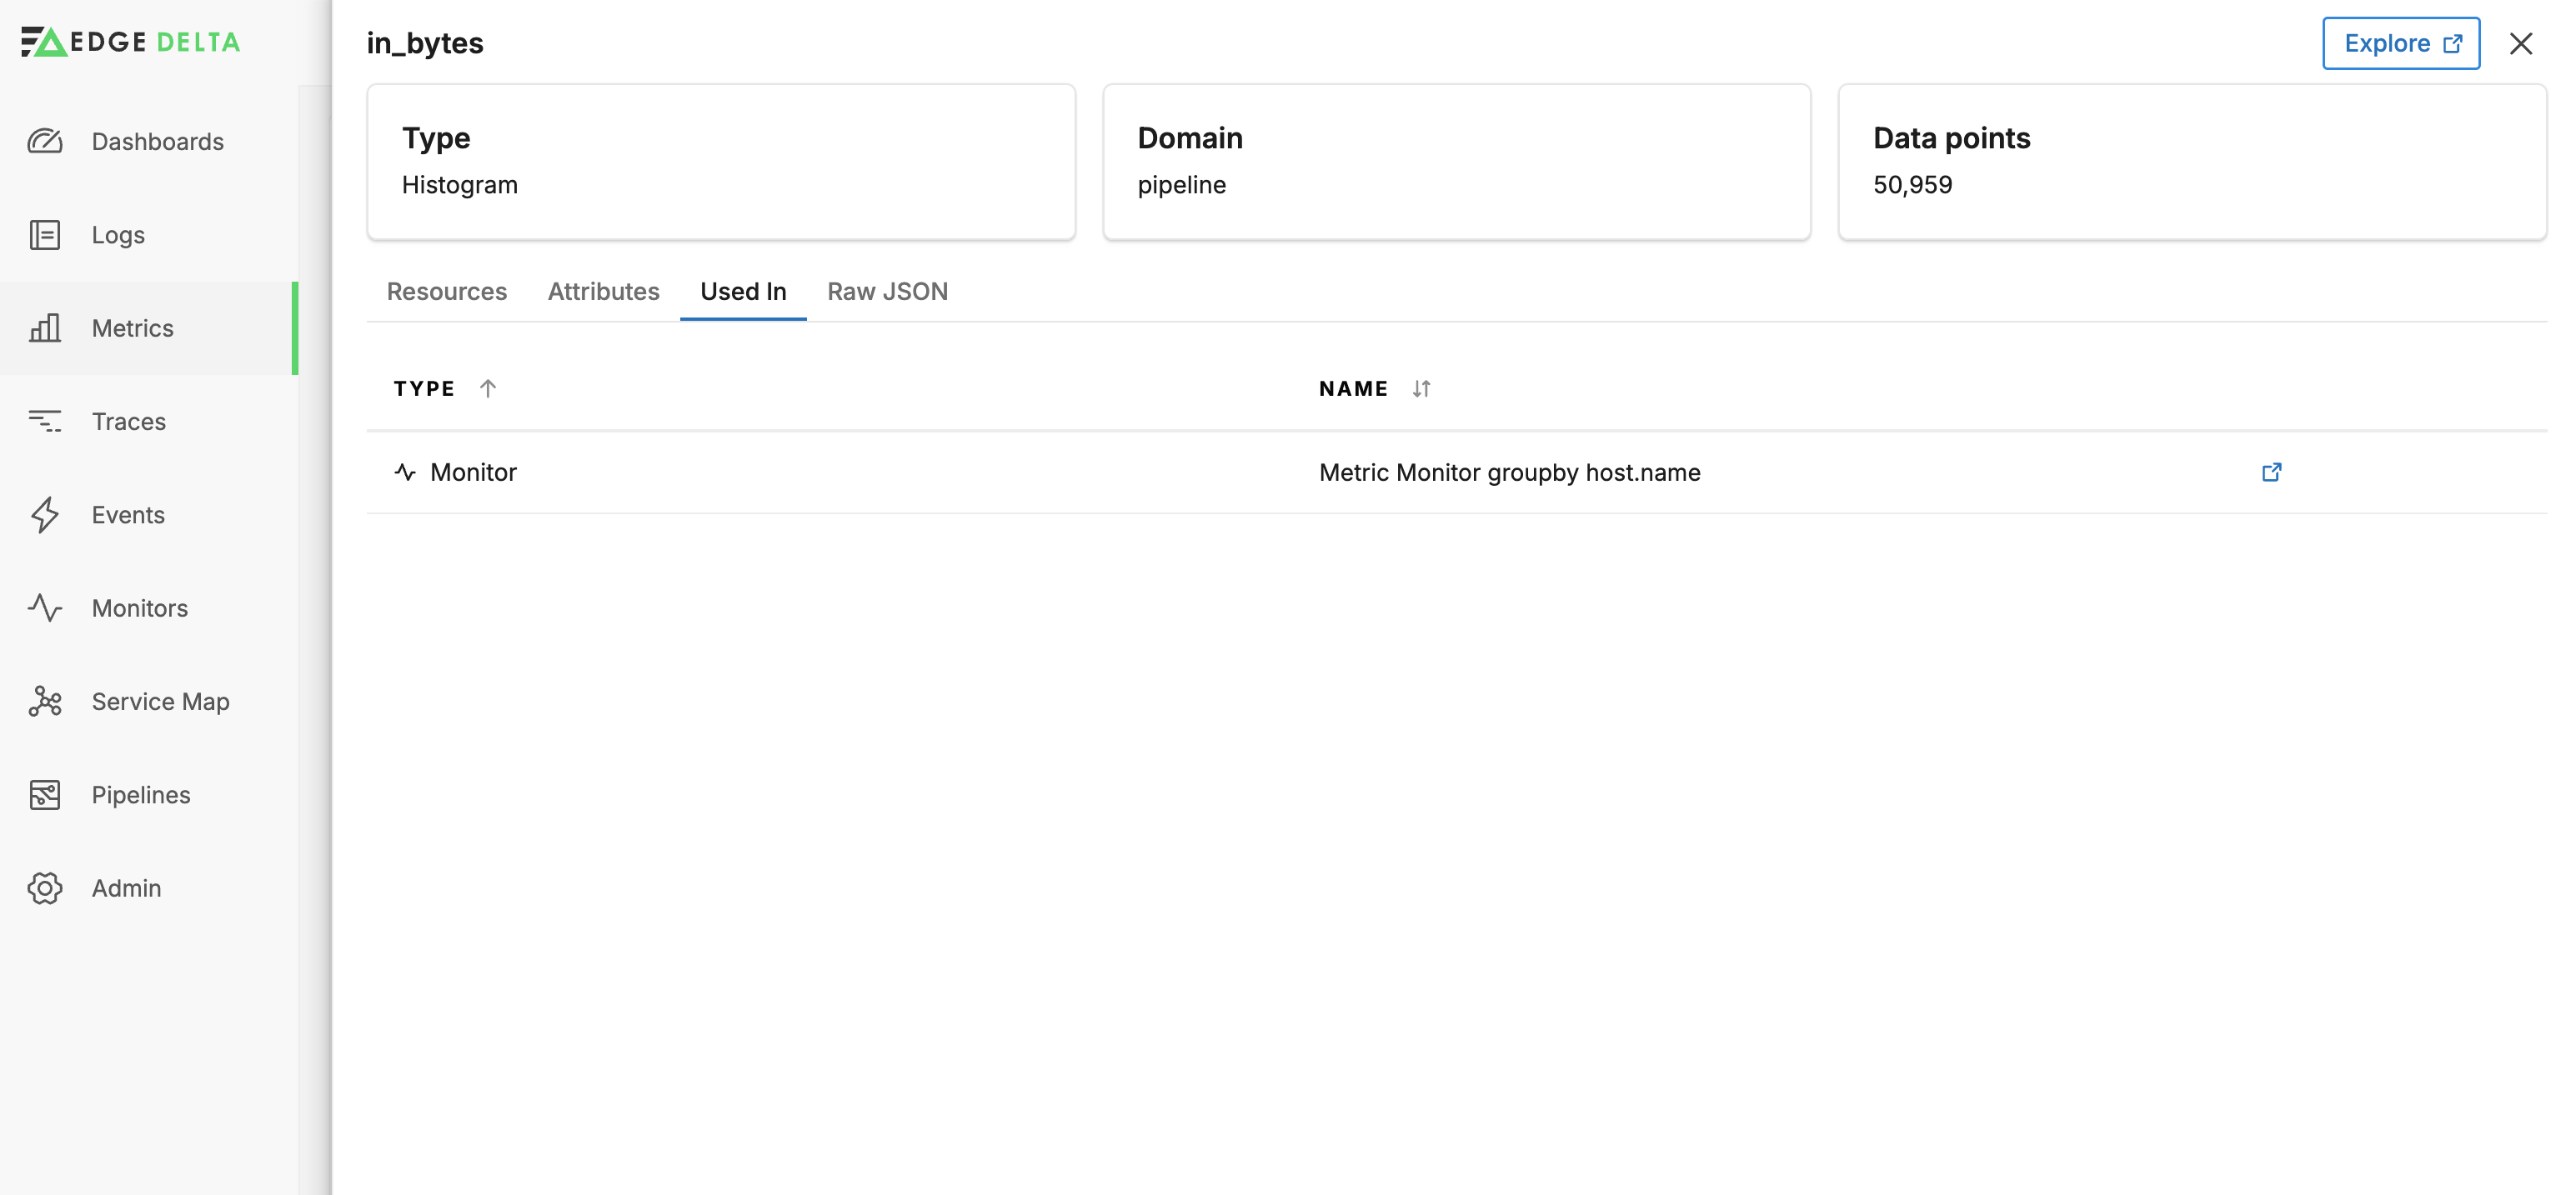
Click Used In to see where the metric is being queried. In this instance a monitor references it.
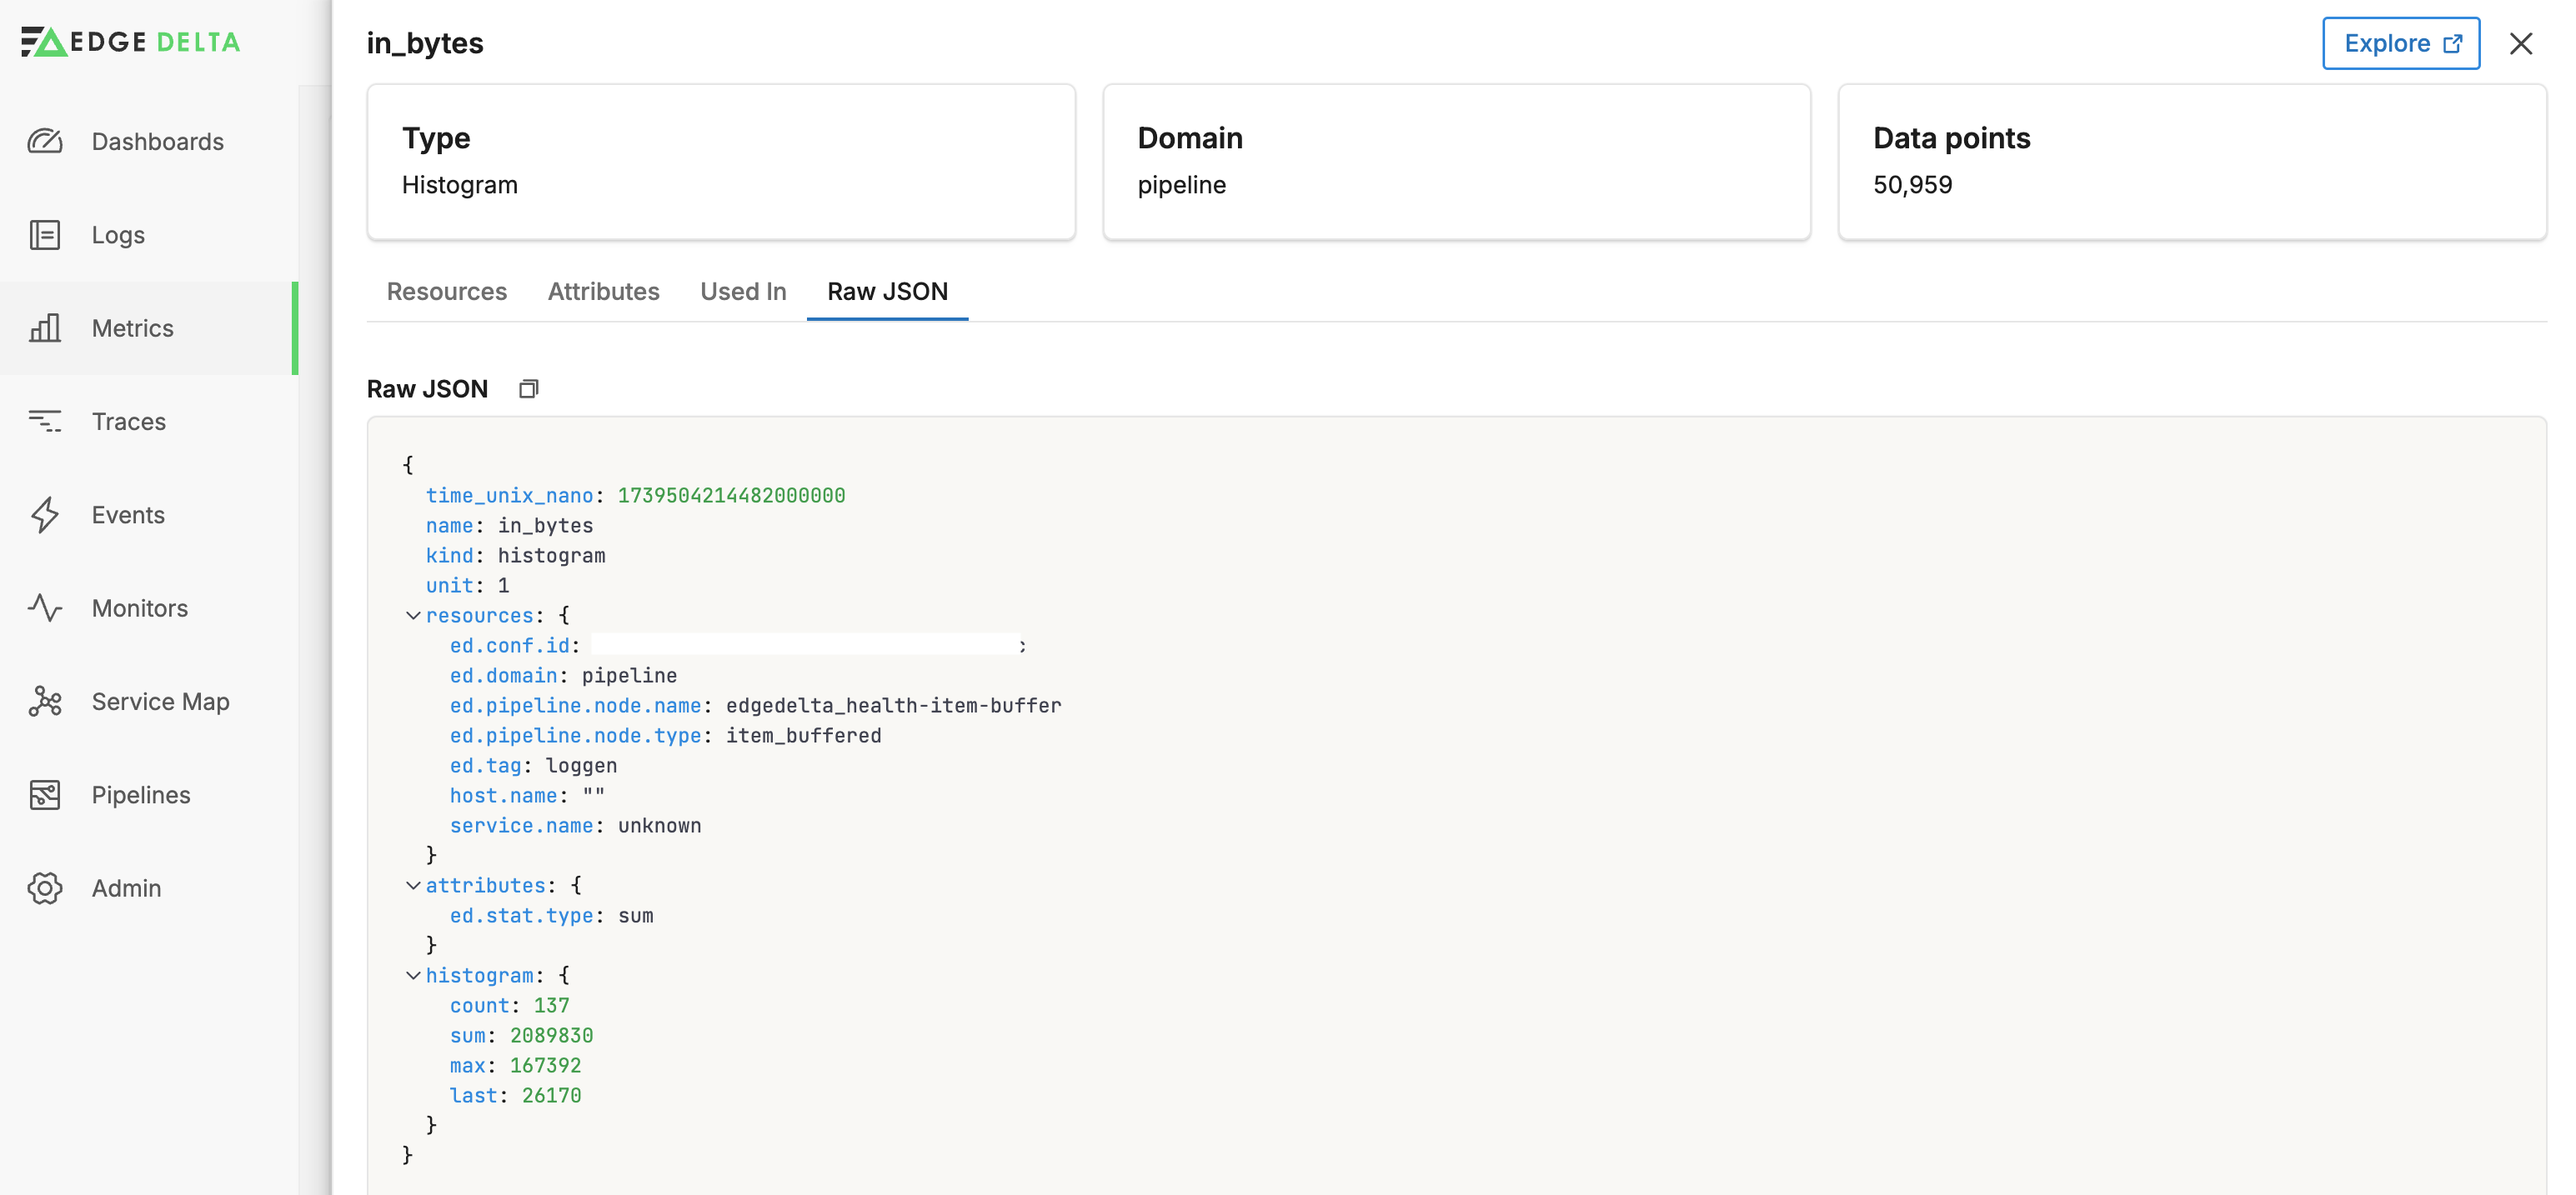
You can also view the entire metric item’s raw JSON:
Click Explore to open the current search query in the Metrics Explorer.
Analyze Metrics
You can use the DMAIC (Define, Measure, Analyze, Improve, Control) framework to analyze and optimize metrics (and your environments).
Define:
- Select Key Metrics: Determine which metrics are essential for your environment and workloads.
Measure:
- Aggregate Collected Data: Use Pipelines to consolidate metrics from various parts of your system to understand the overall performance picture.
- Use Dashboards: Implement dashboards to visualize metrics for easier analysis and real-time monitoring.
Analyze:
- Establish Baselines: Define normal ranges for your key performance indicators based on historical data.
- Monitor for Anomalies: Set up Monitor alerts for deviations from normal ranges to quickly identify potential issues in the environment.
- Analyze Usage Patterns: Study resource usage patterns to understand peak times, resource bottlenecks, and underutilized segments.
- Identify Bottlenecks: Focus on metrics that show latency, throttling, or errors.
Improve:
- Resource Optimization: Allocate resources appropriately based on the analyzed metrics.
Control:
- Regular Audits: Continually audit metrics to ensure configurations remain optimal as workloads and user demands change.
- Feedback Loops: Incorporate feedback from monitoring results into planning and executing further optimizations iteratively.
- Document Metrics and Changes: Maintain clear documentation of all monitored metrics, the reasons for choosing them, and any changes made as a result of optimizations.
Remove a Metric
Depending on the source of a metric, you remove it in one of multiple ways:
- Add an exclude parameter to the Kubernetes Metrics source node using the facet values you identified in the Inventory.
- Remove it with a Log to Metric node configuration.
- Configure the data source to not emit it.