Log Patterns
4 minute read
Overview
The Patterns tab on the Logs page displays log patterns detected by your pipelines. Edge Delta uses the Drain algorithm to group similar logs into patterns by replacing variable elements (timestamps, IDs, IP addresses) with wildcards while preserving the structural template.
The Patterns tab shows pattern counts, sentiment scores, and volume trends, helping you identify noisy or anomalous log patterns. You can act on patterns directly by creating pipeline processors, searching pattern logs in the archive, or creating monitors.
To open the Patterns tab, click Logs and select Patterns.
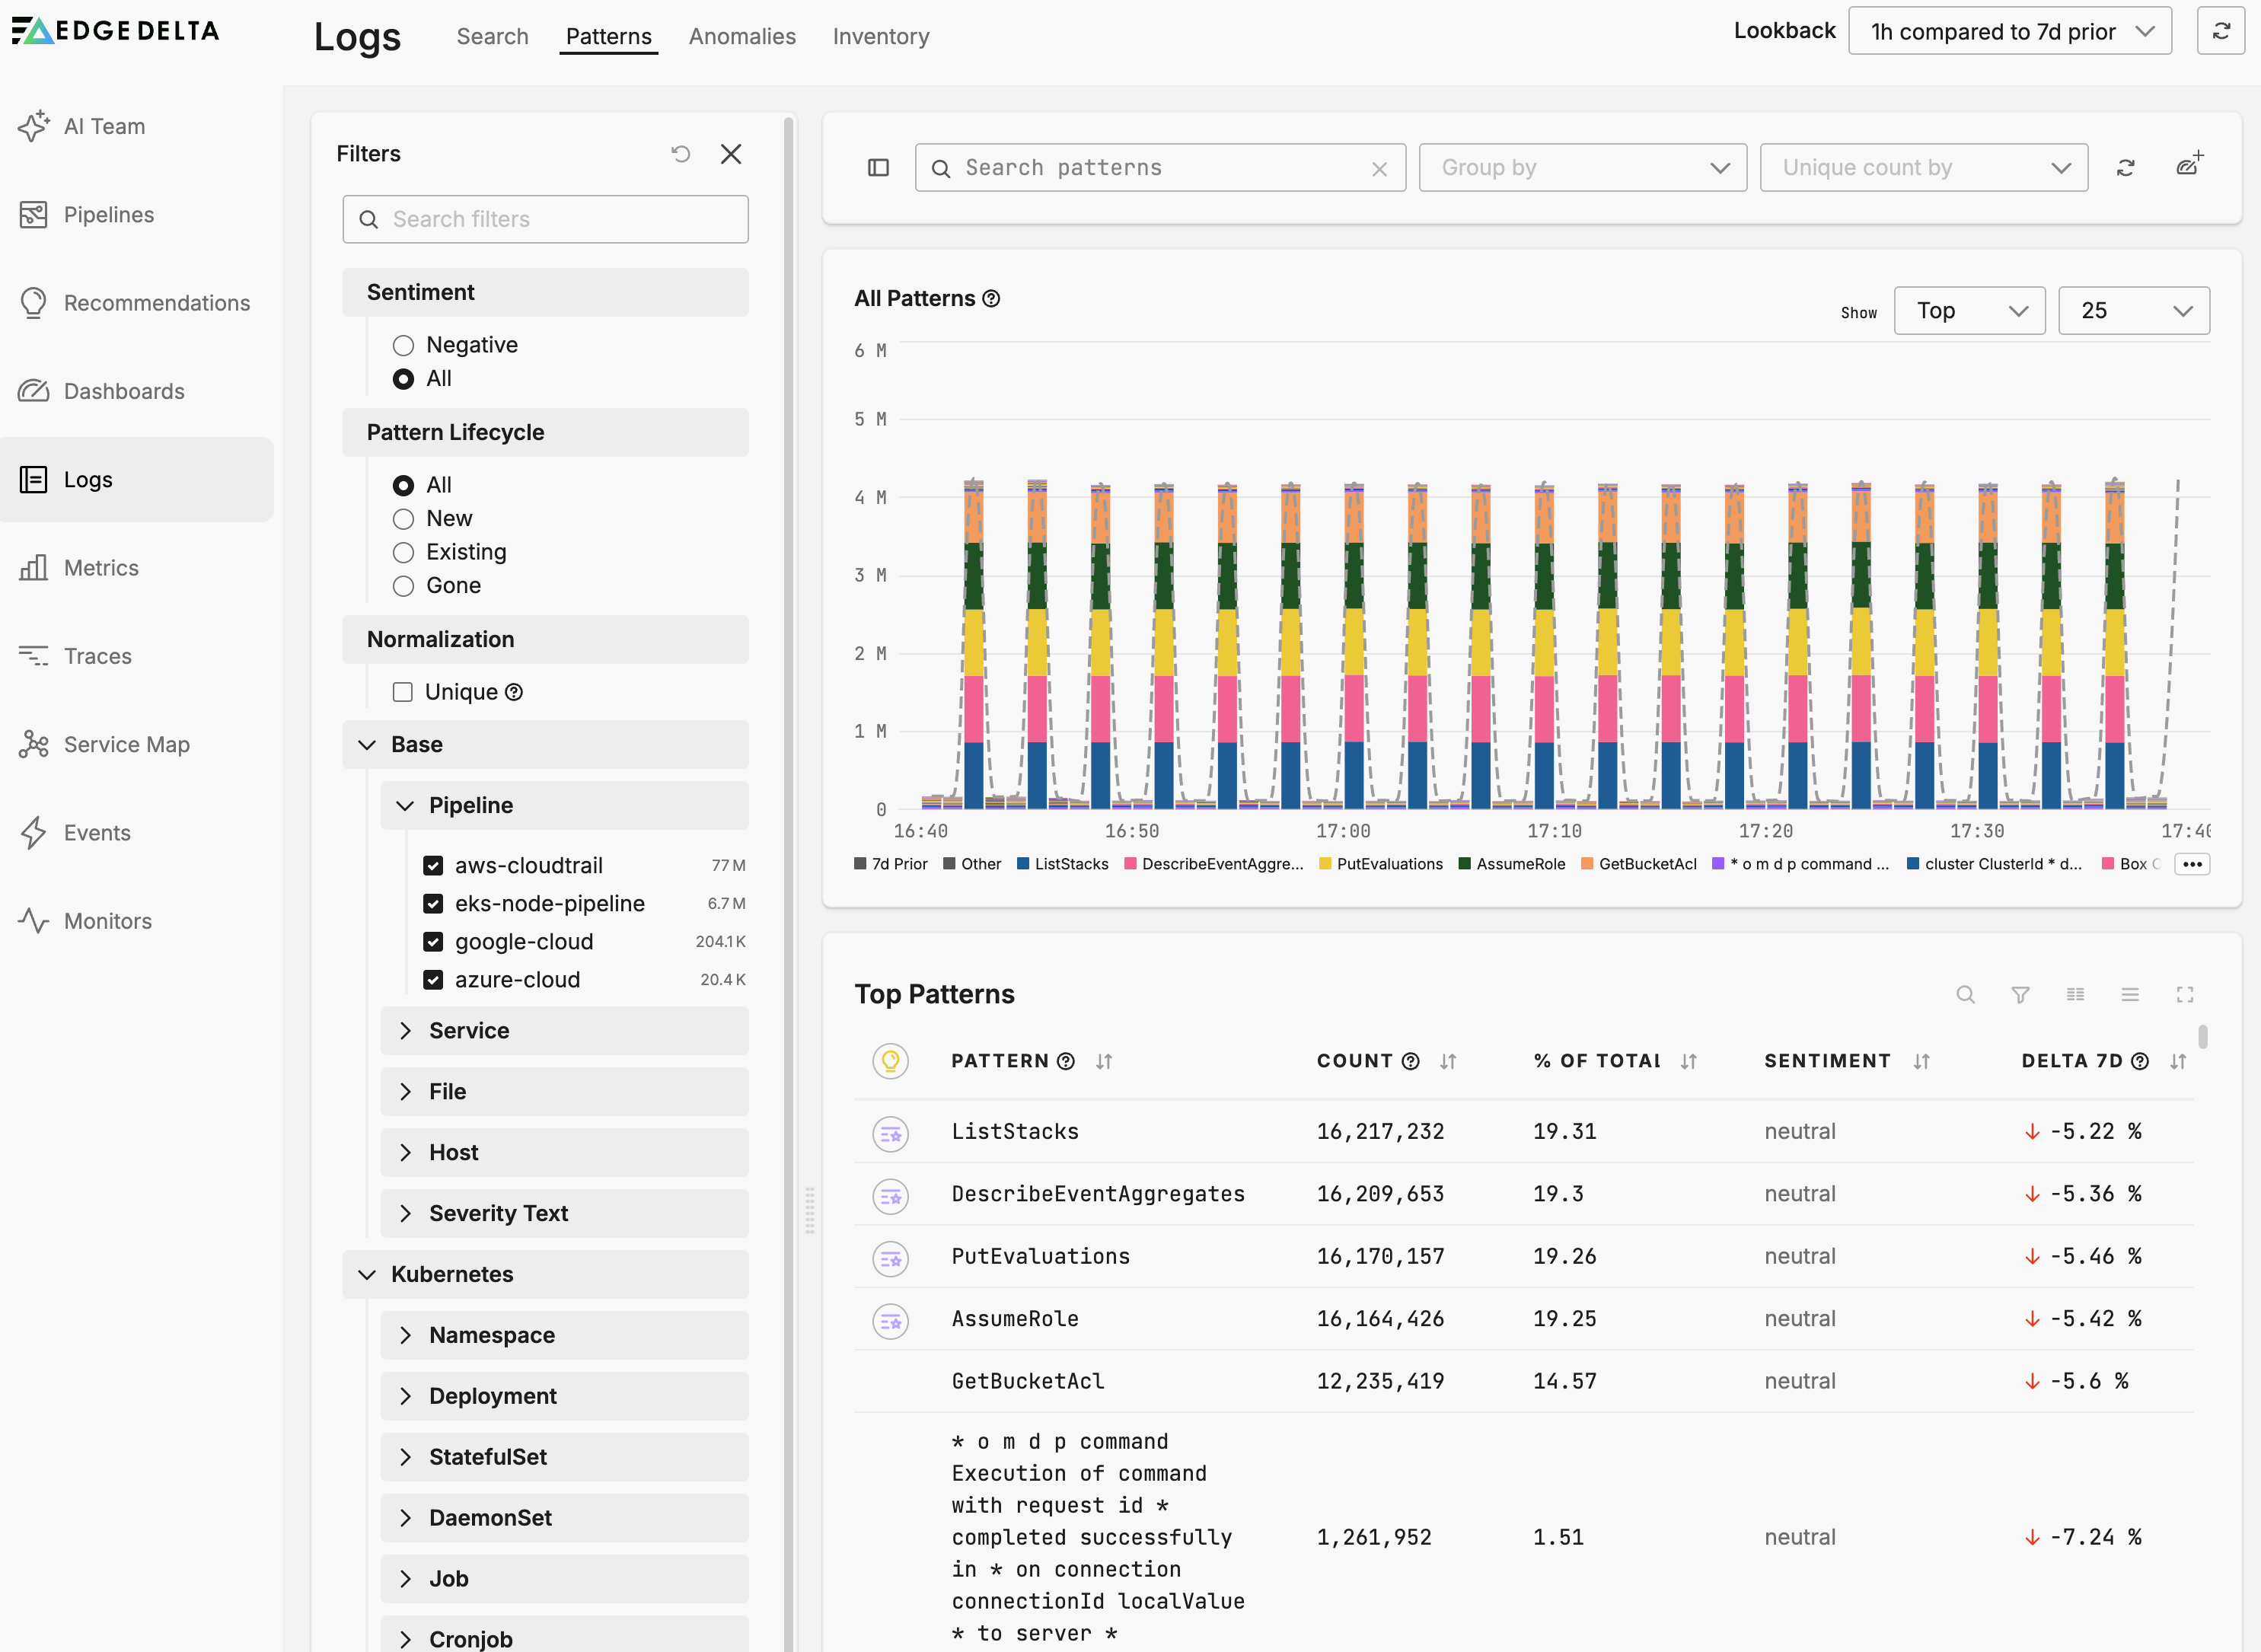
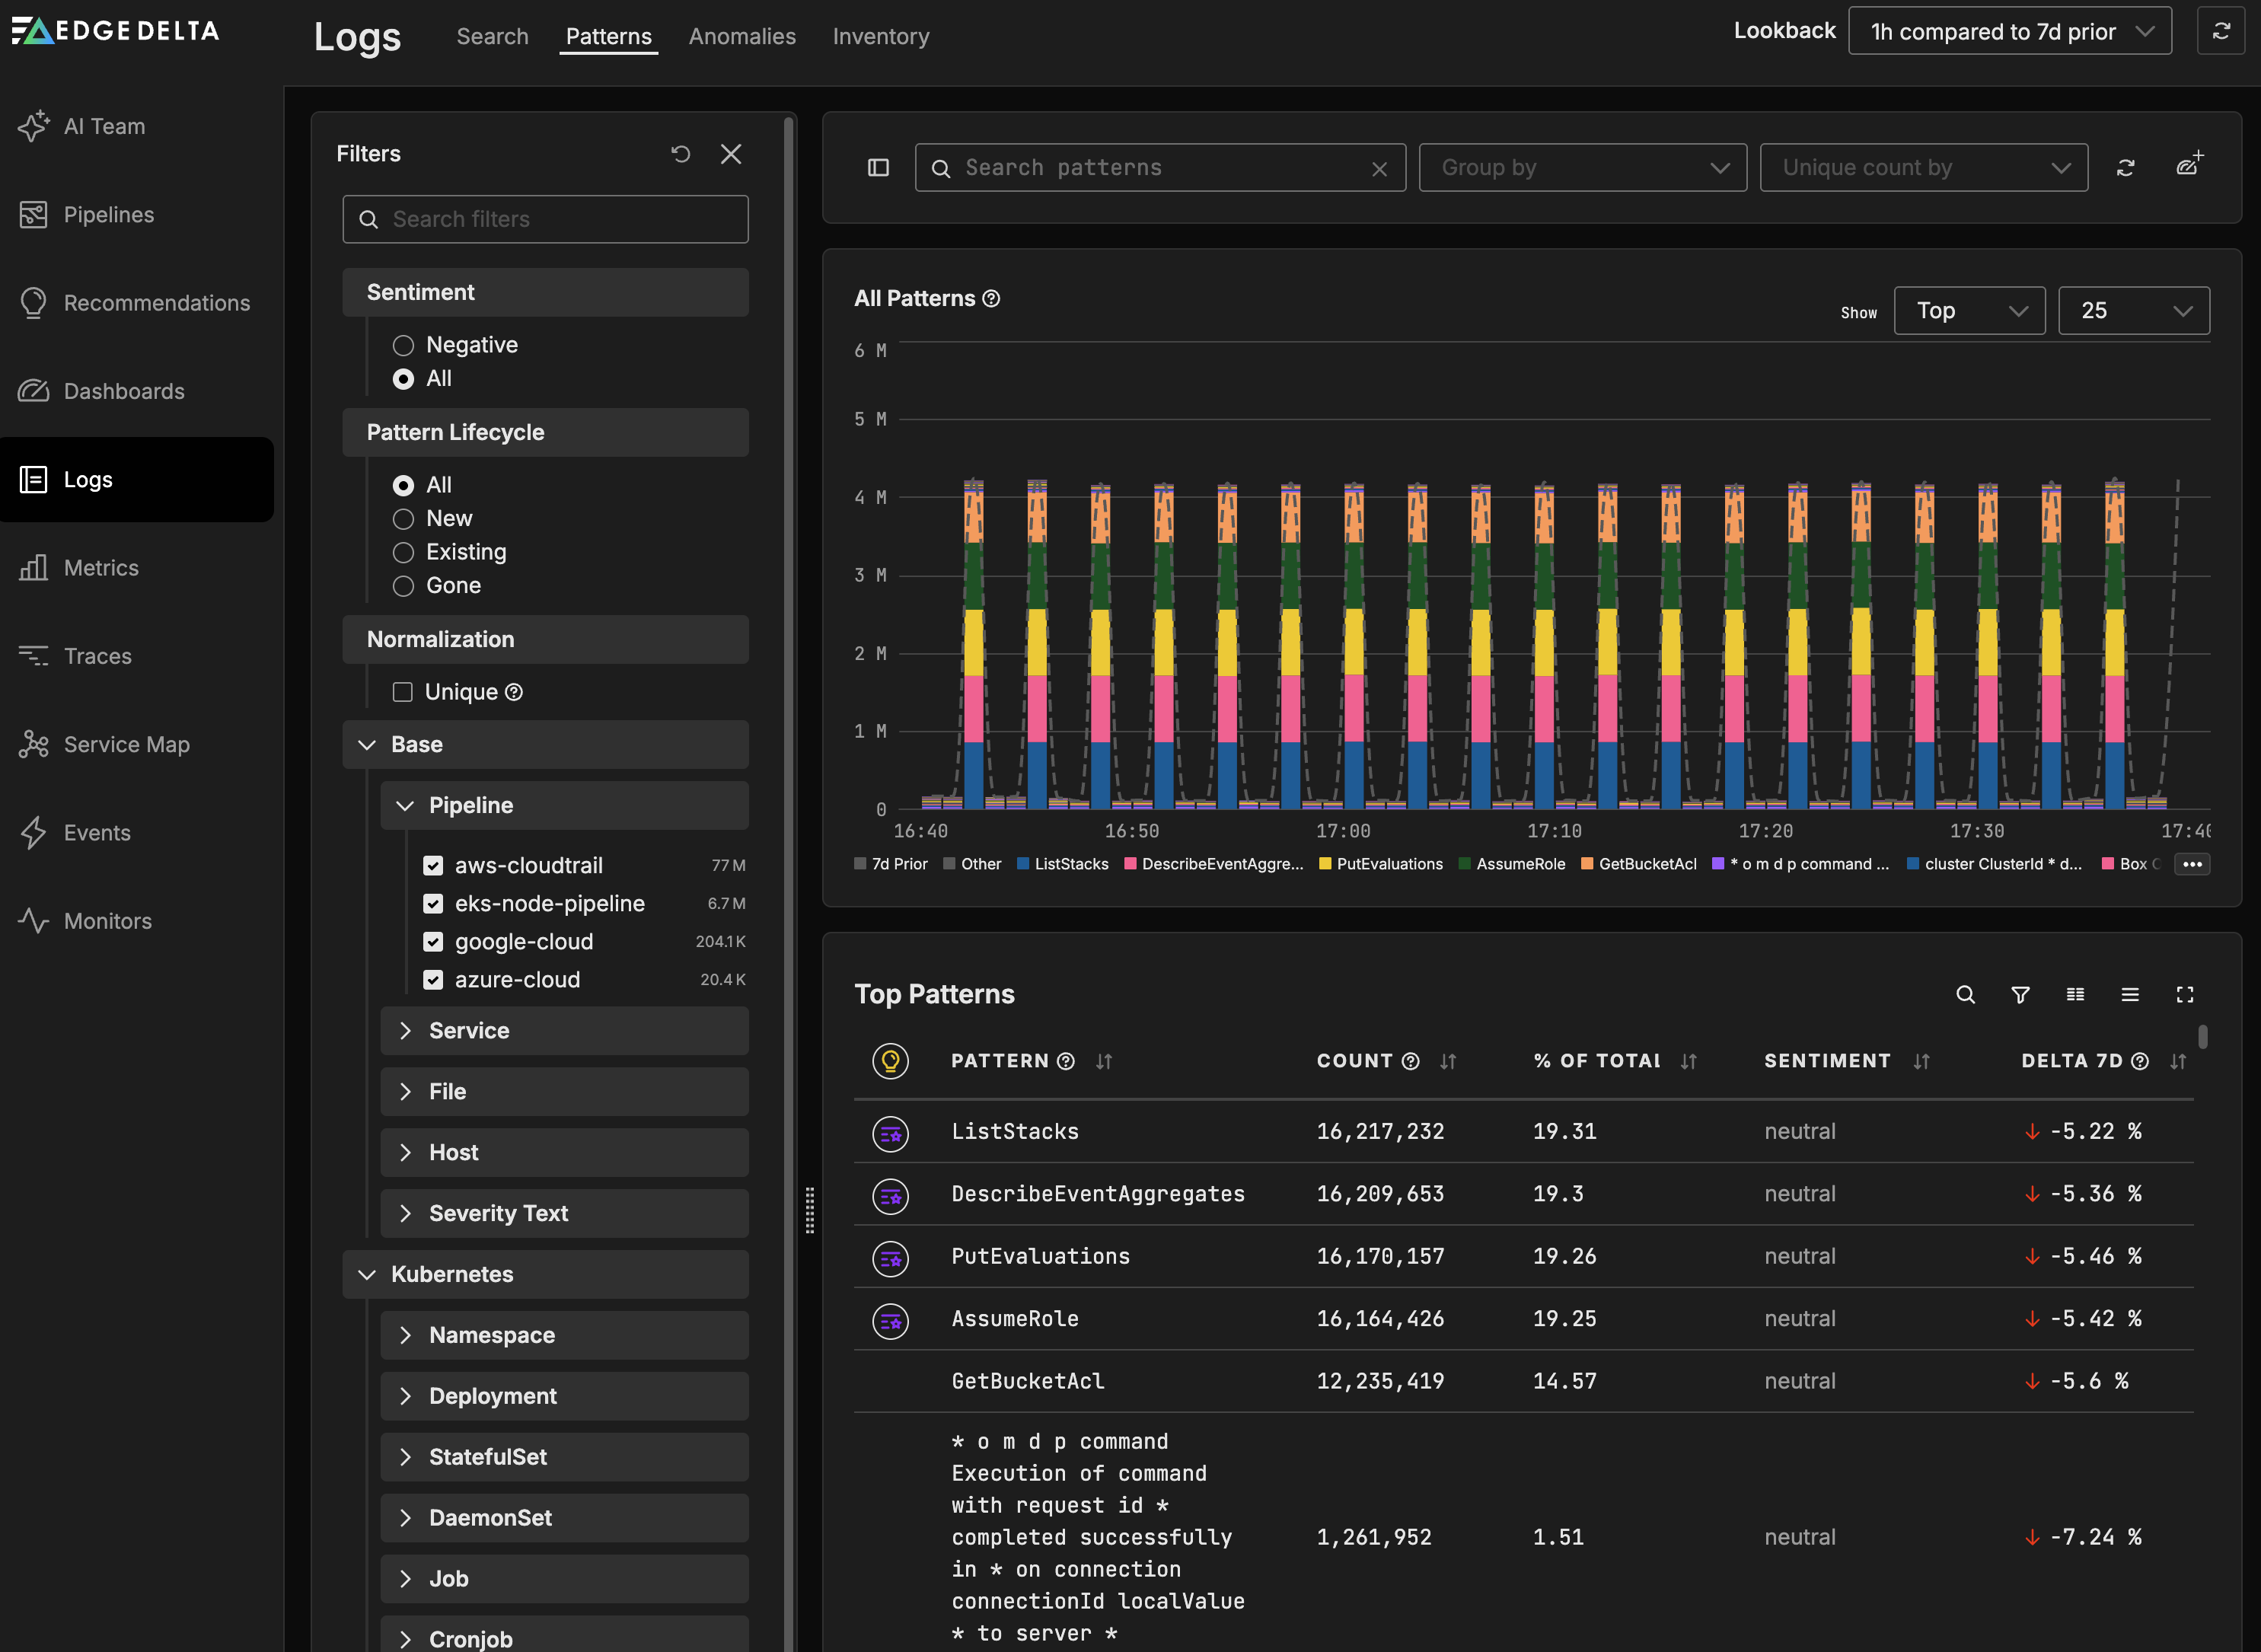
Patterns table
The patterns table lists detected patterns sorted by volume. Each row includes the following columns:
| Column | Description |
|---|---|
| Pattern | The detected log template with variable elements replaced by wildcards (*) |
| Count | The number of matching log entries within the selected lookback period |
| % Of Total | The pattern’s share of all detected patterns as a percentage |
| Sentiment | The sentiment classification: neutral or negative. Negative patterns contain terms like error, failed, or panic |
| Delta | The percentage change in pattern volume compared to the selected comparison period |
Note: The Delta column value depends on the comparison period selected in the lookback controls. See Compare to for details.
Pattern details
Click a pattern row to open the pattern details. The details view shows:
- Historical Pattern Count: A time-series chart of the pattern’s volume over the lookback period.
- Cluster Samples: Sample logs that match the pattern, showing the timestamp, host, and log body.
- Raw JSON: The raw JSON representation of sample logs.
From the pattern details, you can click Search in Archive to open the matching logs in Log Search.
Actions
Click the kebab menu (three dots) in the Actions column for a pattern to access available actions:
- Filter out: Opens the pipeline editor to create a processor that drops matching logs. See Pattern to Filter for details.
Some patterns also display a recommendation icon. Click it to view a suggested Filter or Sample Processor with a pre-populated configuration. See Use a recommendation for details.
Filters
Use the Filters pane to narrow the patterns displayed in the table and chart.
Sentiment
Filter patterns by sentiment classification:
- Negative: Patterns containing terms that indicate errors, failures, or degradation. Negative terms are configured in the Sentiment Patterns section of the Global Data Settings page.
- Neutral: Patterns that do not contain negative terms, or that contain both a negative and a neutralizing term (such as
debug).
Note: If a pattern contains both a negative term and a neutral term, the neutral term overrides the negative classification.
Pattern lifecycle
Filter patterns by their lifecycle state:
- New: Patterns that appeared for the first time during the current lookback period.
- Gone: Patterns that no longer appear compared to the previous lookback period.
- Existing: Patterns that were present in both the current and previous lookback periods.
Source filters
Filter by pipeline, service, host, Kubernetes namespace, and other source dimensions using the facet filters in the Filters pane. See Add Facets for details on creating custom facets.
View options
Group by
Group the chart by a facet to compare pattern volumes across dimensions. For example, group by service name to see which services produce the most patterns. The available dimensions depend on the facets configured in the Filters pane.
Unique count by
Select a dimension to view a count of unique values. For example, select a host dimension to see how many hosts generated logs matching the displayed patterns.
Compare to
Select a comparison period to populate the Delta column and add a comparison line to the chart:
- Previous Period: Compares to the immediately preceding lookback interval.
- 24h Prior: Adds a Delta 24h column showing the percentage change over the previous 24 hours.
- 7d Prior: Adds a Delta 7D column showing the percentage change over the previous 7 days.
Show
Control which patterns are displayed:
- Top: Display the most common patterns by volume (default).
- Volatile: Display patterns with high anomaly scores or newly detected patterns.
See also
- Anomaly Detection for details on how Edge Delta identifies and scores log patterns
- Pattern to Filter for creating pipeline processors from patterns
- Pattern Anomaly Monitor for alerting on pattern anomalies
- Log Search for querying individual logs
- Log Inventory for analyzing log volume distribution