Edge Delta Service Map
4 minute read
Overview
A service map is a visual representation of the services within your application architecture and how they interconnect. It provides an overview of the flow of requests between different services and any external dependencies.
Requirements
Note: Requires agent version 1.24.0 or higher.
In addition, your pipeline configurations must include the Kubernetes Kubernetes Service Map source node and that node must be connected to Edge Delta Destination node.
The service map uses the following metrics:
k8s.traffic.communication.latency.p95: Provides information about p95 latency.k8s.traffic.communication.count: Provides information about the total number of requests.
Service Map
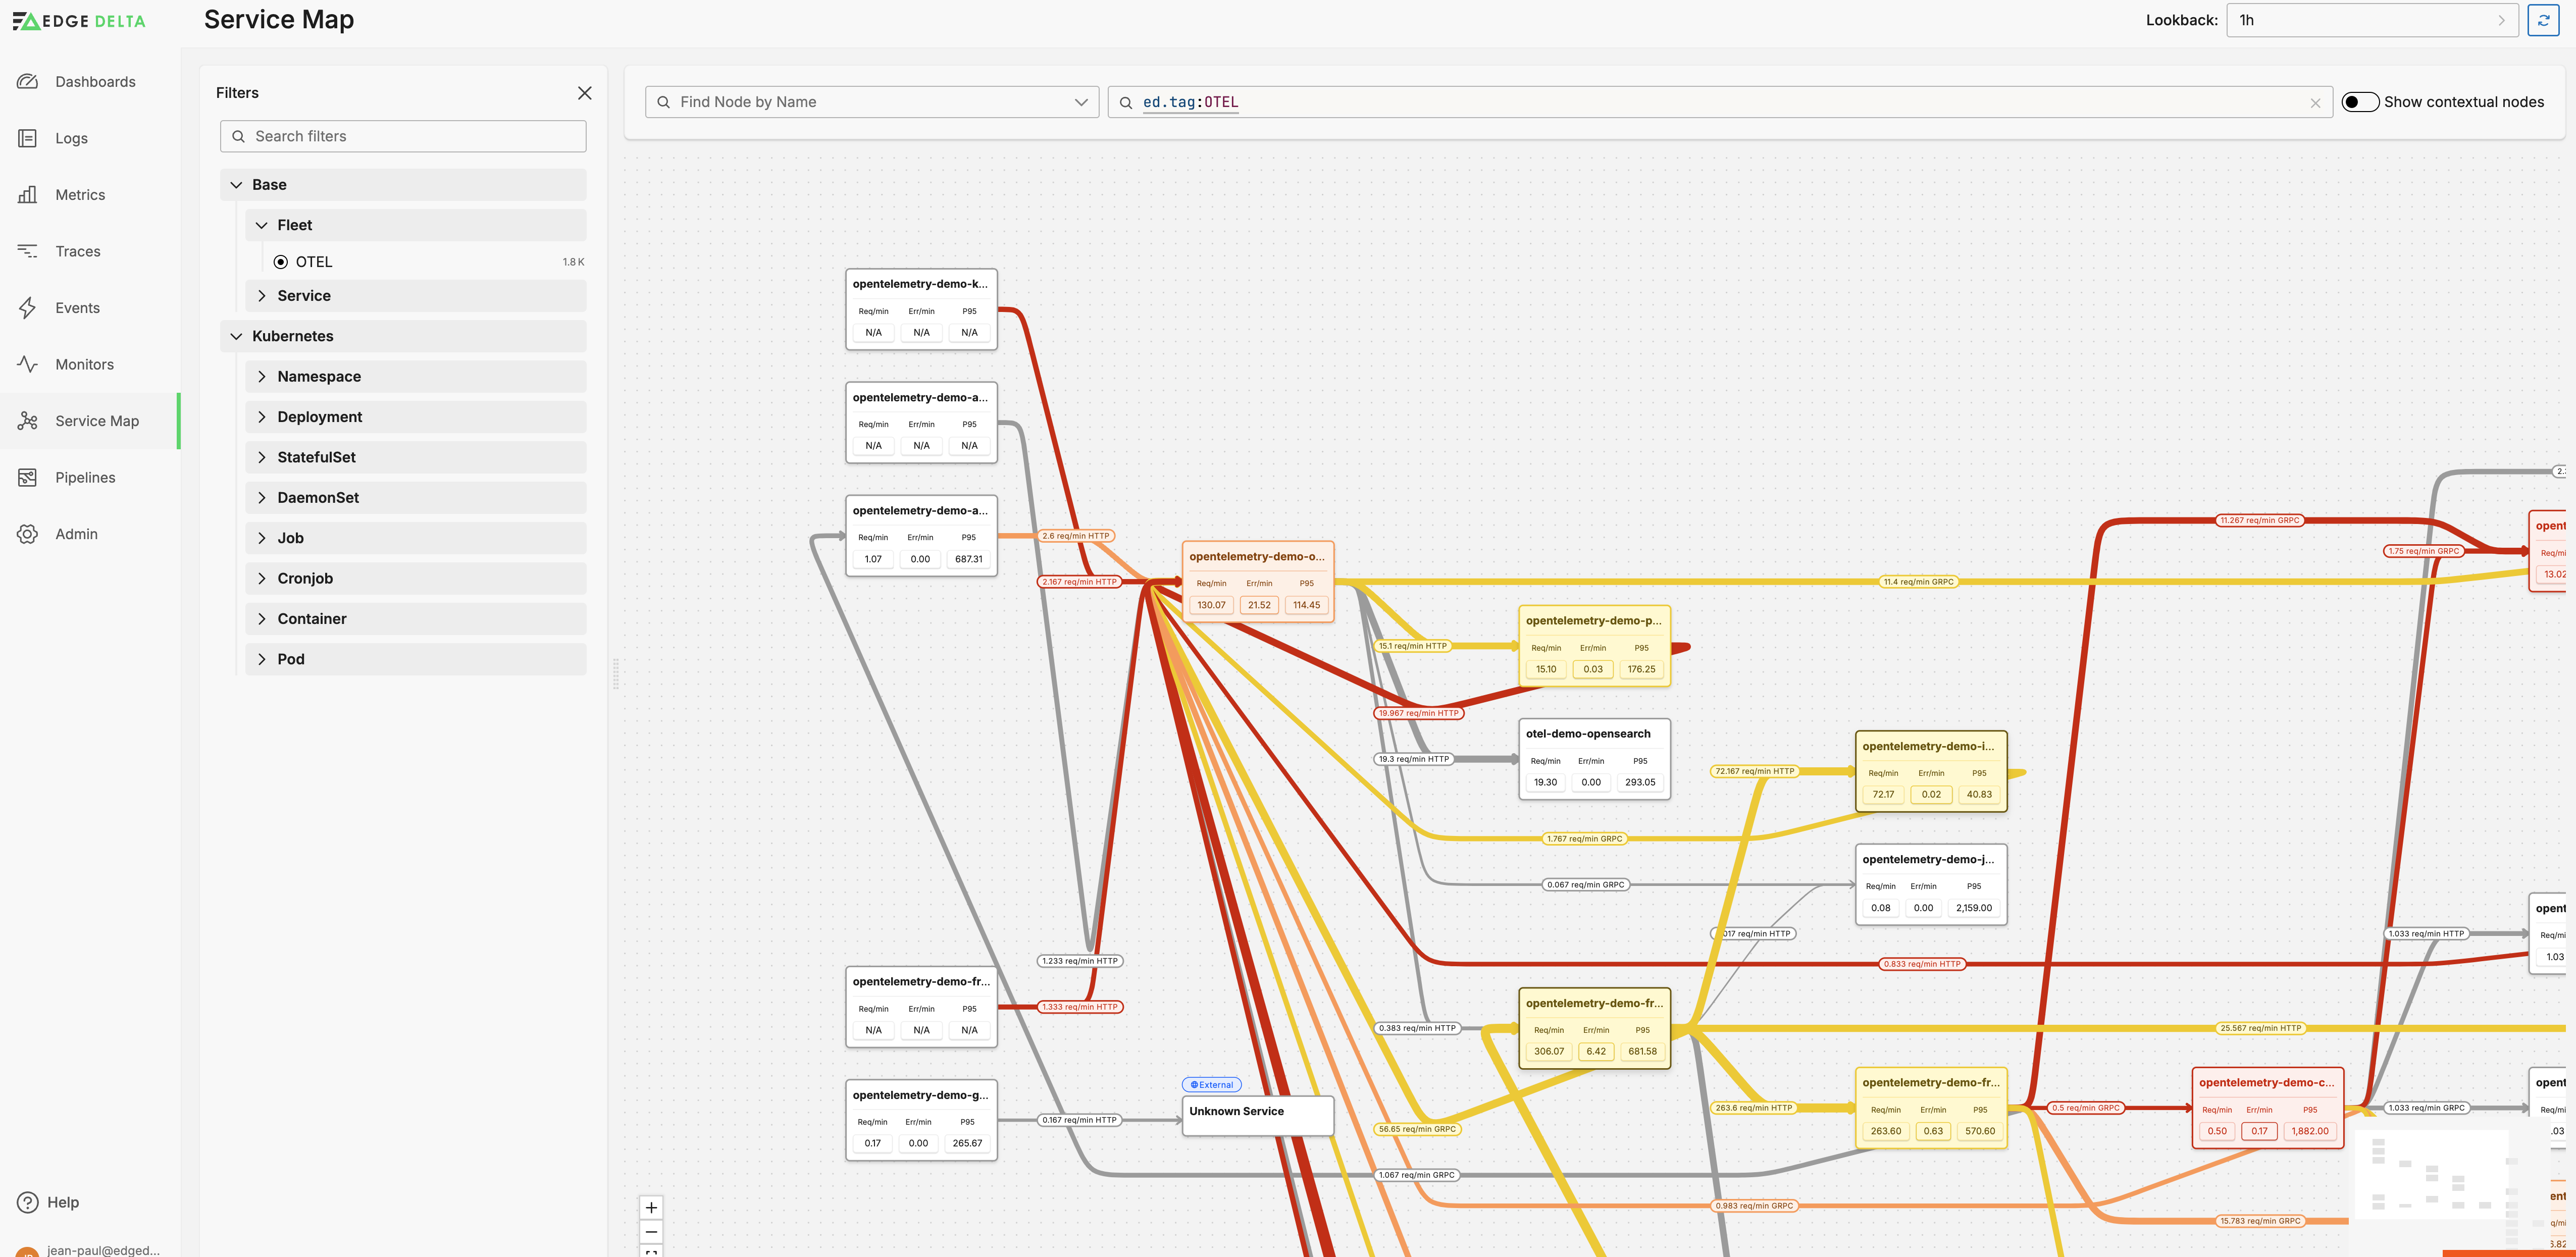
Click Service Map and select a pipeline. You can only view the service map for one pipeline at a time. You can filter the map using options in the Filter pane such as selecting a service or namespace, and you can change the lookback period.
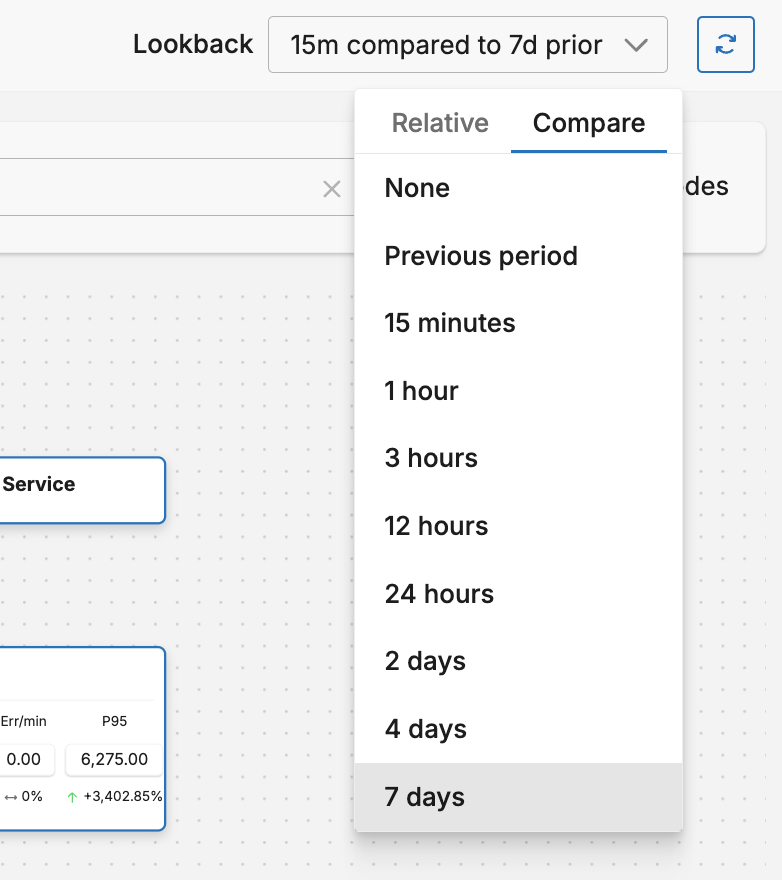
You can select the Lookback period and the comparison period. The comparison period takes the average of lookback intervals for the given period:
Services
The service map shows individual services and the connections between them. Each service displays requests per minute, errors per minute, and P95 latency (95th percentile latency measurement), providing insights into performance and reliability. The services are color-coded based on their error rate:
- Red: 20% or more
- Orange: 10% - 19%
- Yellow: 0% - 9%
Service Details
Hover over a service and click Isolate on to view only the selected service along with its directly connected upstream and downstream services.

Click the Details button on the service or double click the service to view a details pane with traces, the request graph, and the latency graph.
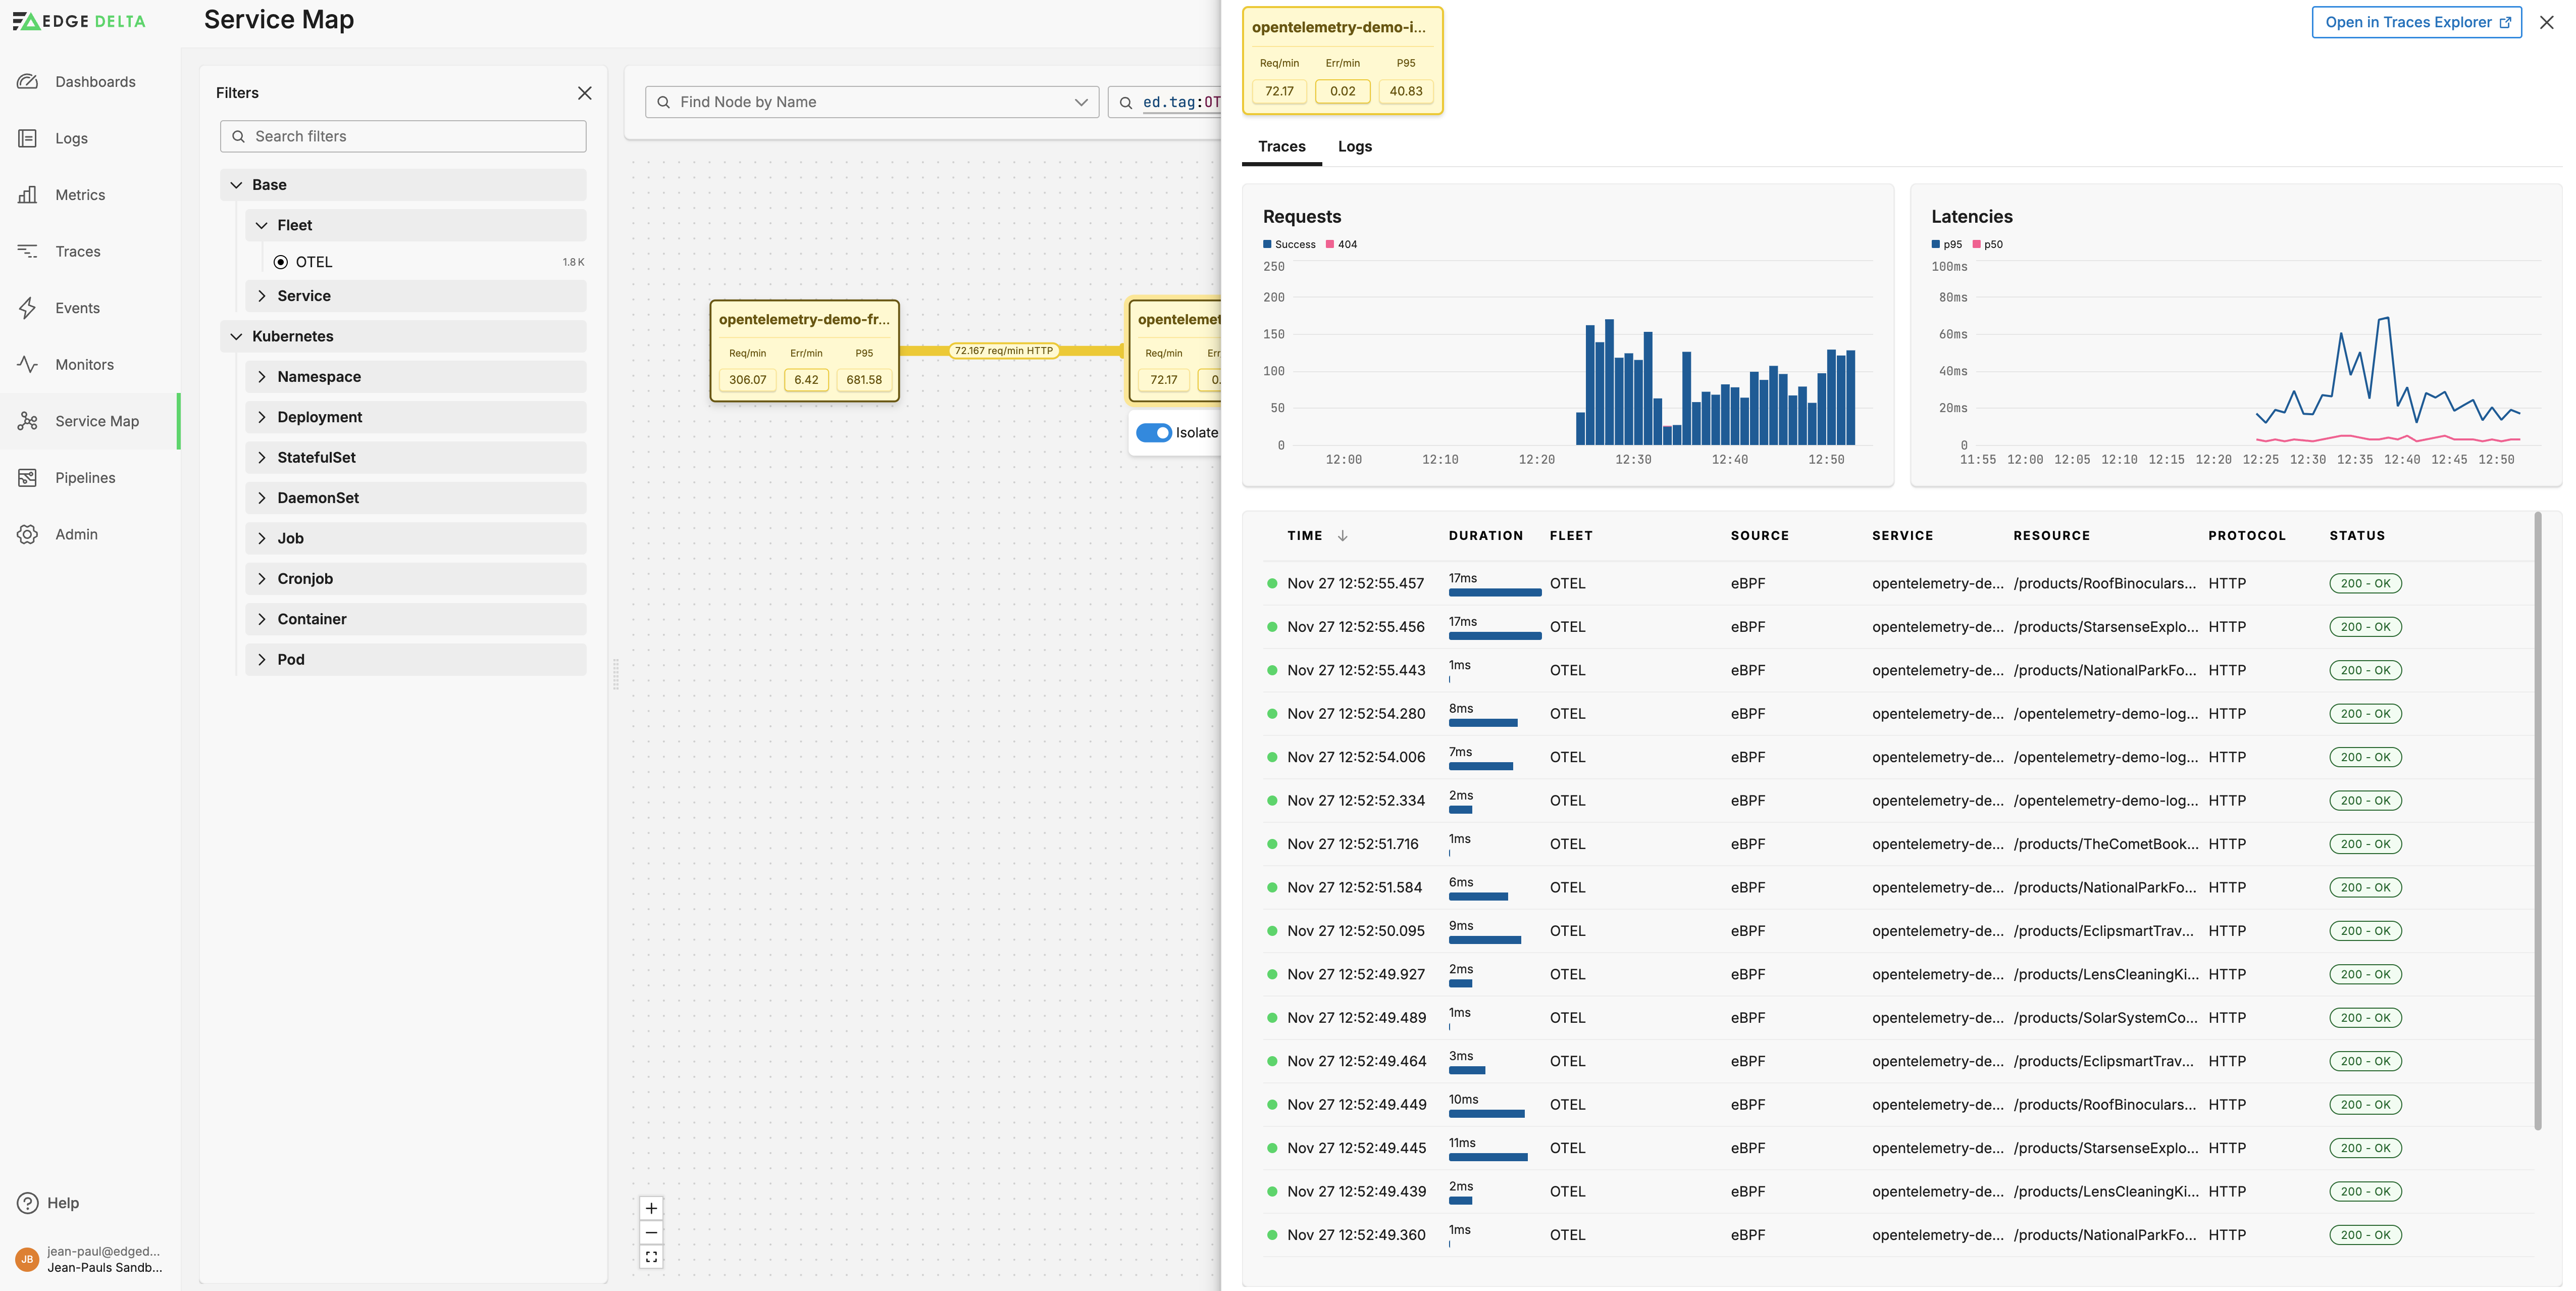
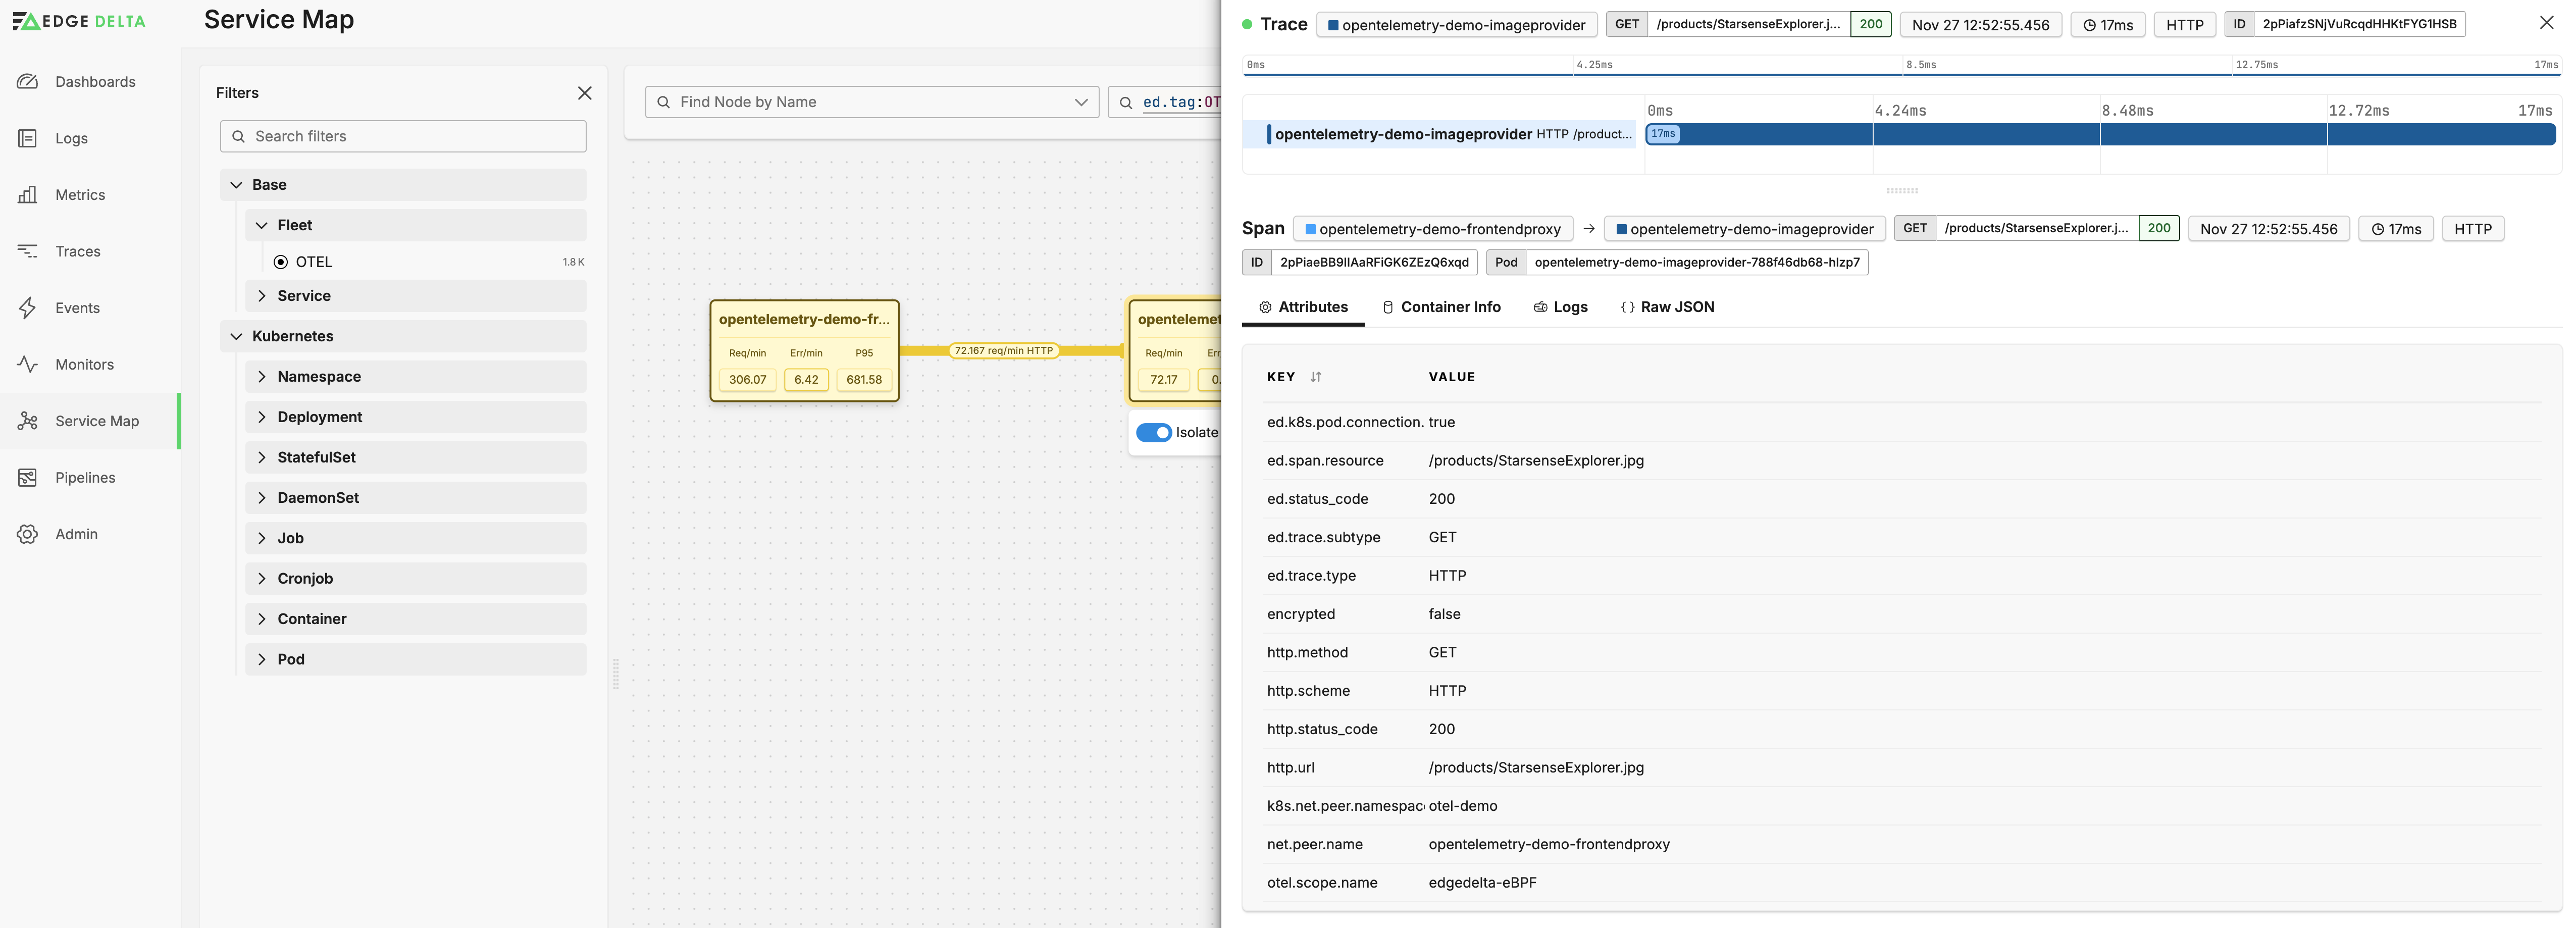
You can open the view in the Traces explorer or click a trace to view its details. This allows you to drill down into specific information for troubleshooting and analysis.
Back on the service details tab, click the Logs tab to view recent logs from the selected service.

Connections
The volume of traffic is indicated visually by the thickness of the connections between services. Each link is annotated with the request volume measured in requests per minute and the protocol.

Click a link to view its details.
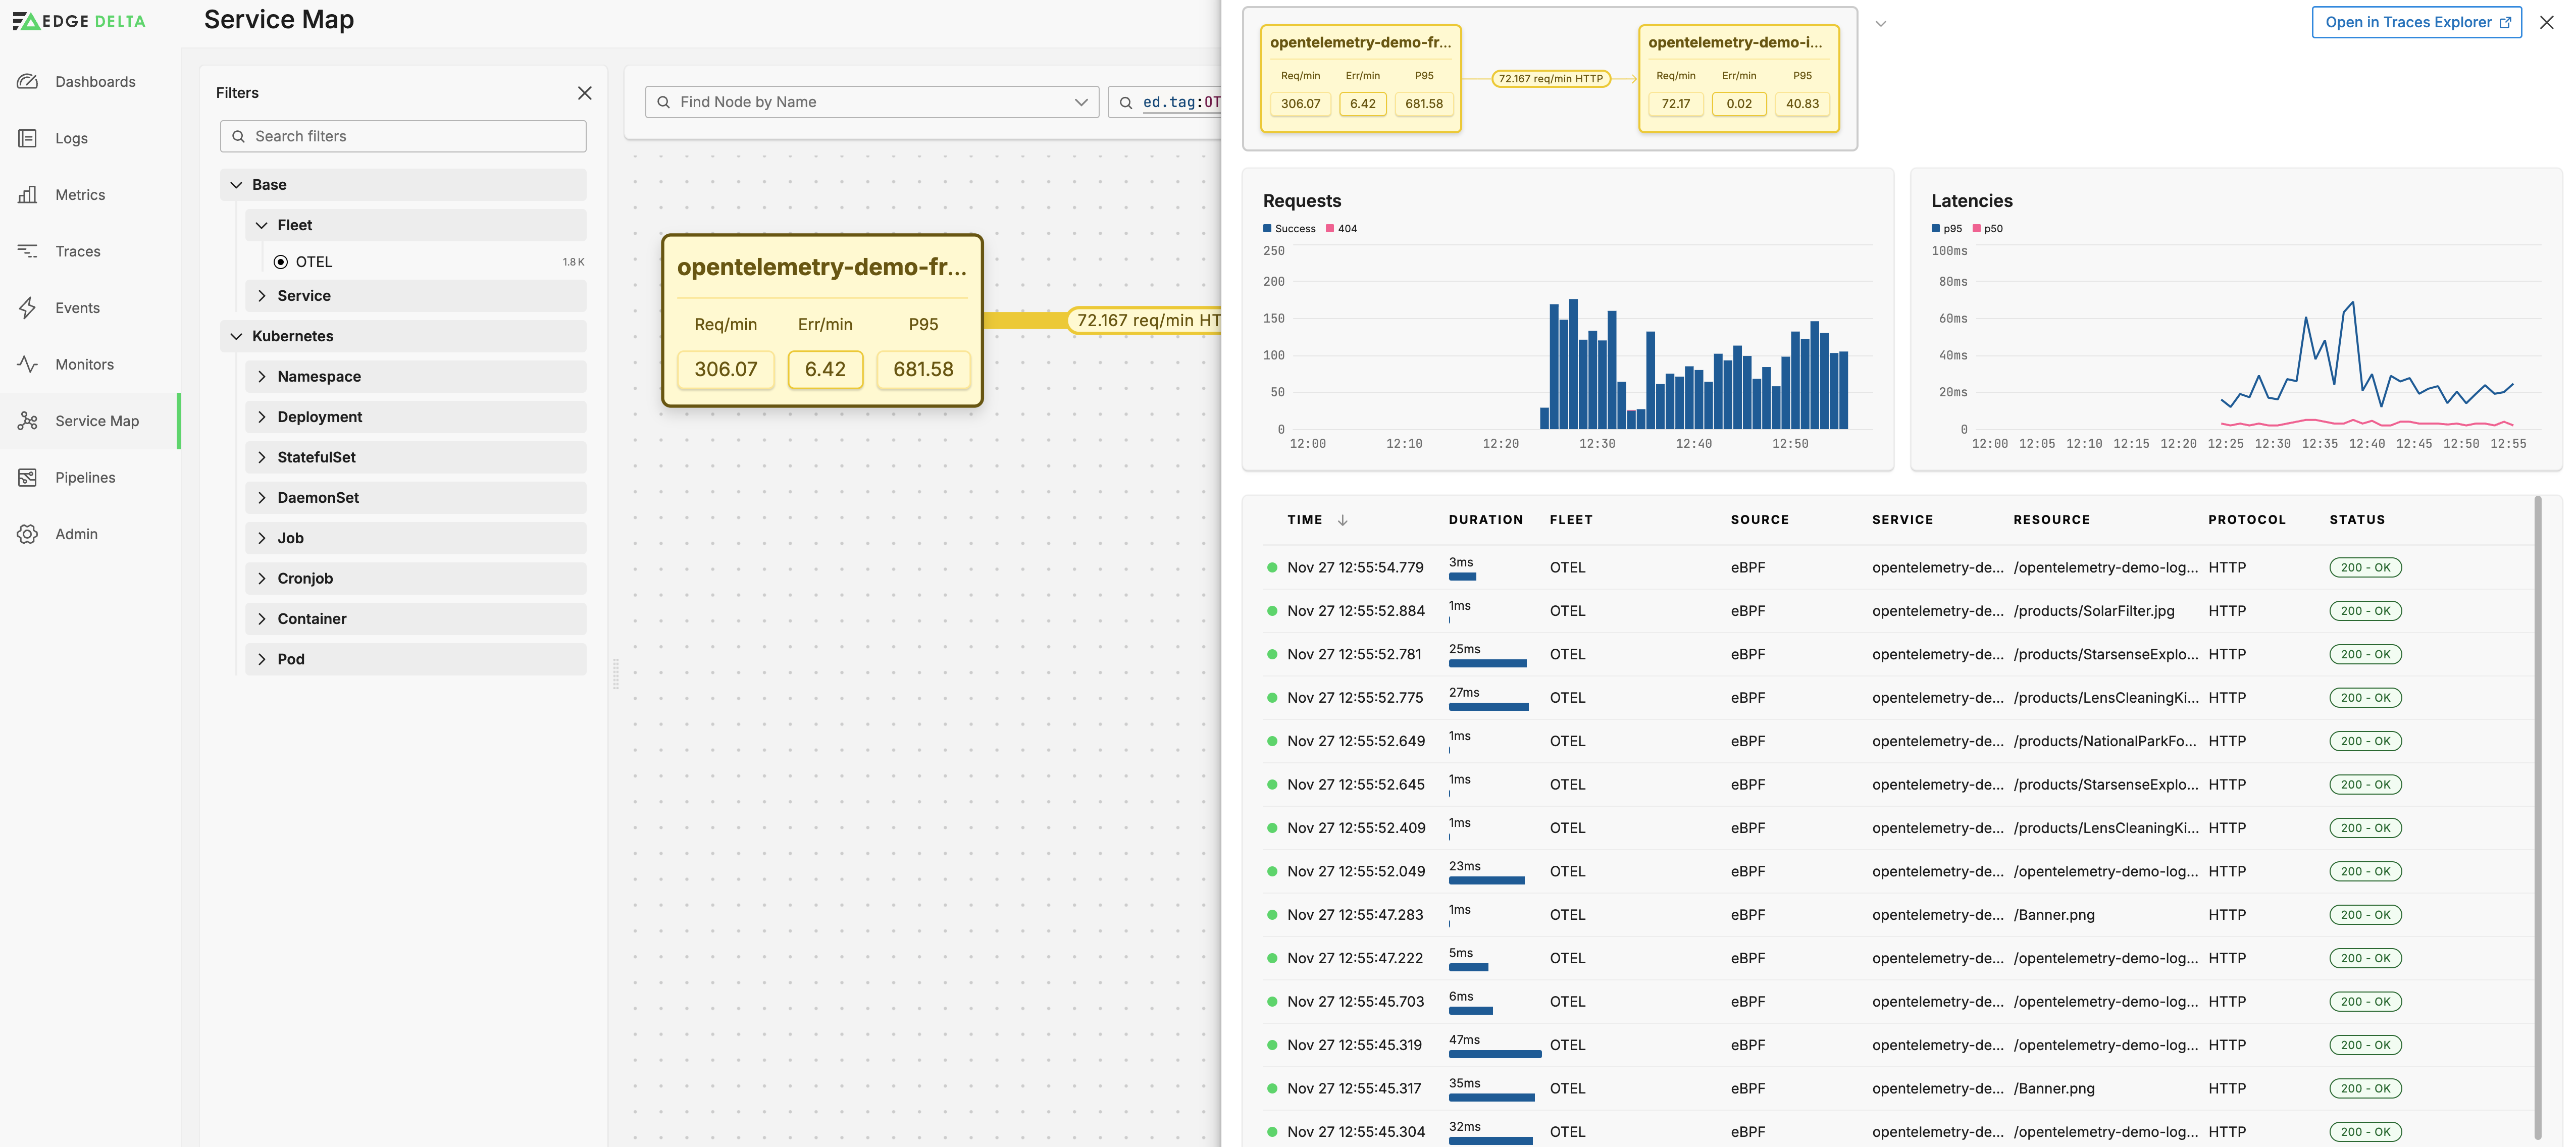
The source and destination services are listed as well as metrics and the trace table for trace traffic along the connection. As with the service view, you can open the view in the Traces Explorer, or click a trace to view its details.
Unknown Services
You may notice some downstream consumer services are marked as Unknown Service, and their details pane lists a URL of Other:

This arrangement helps prevent service map noise from beyond the context of the selected pipeline. You can enable resolution of unknown services by specifying their domain in the Kubernetes Kubernetes Service Map source node:
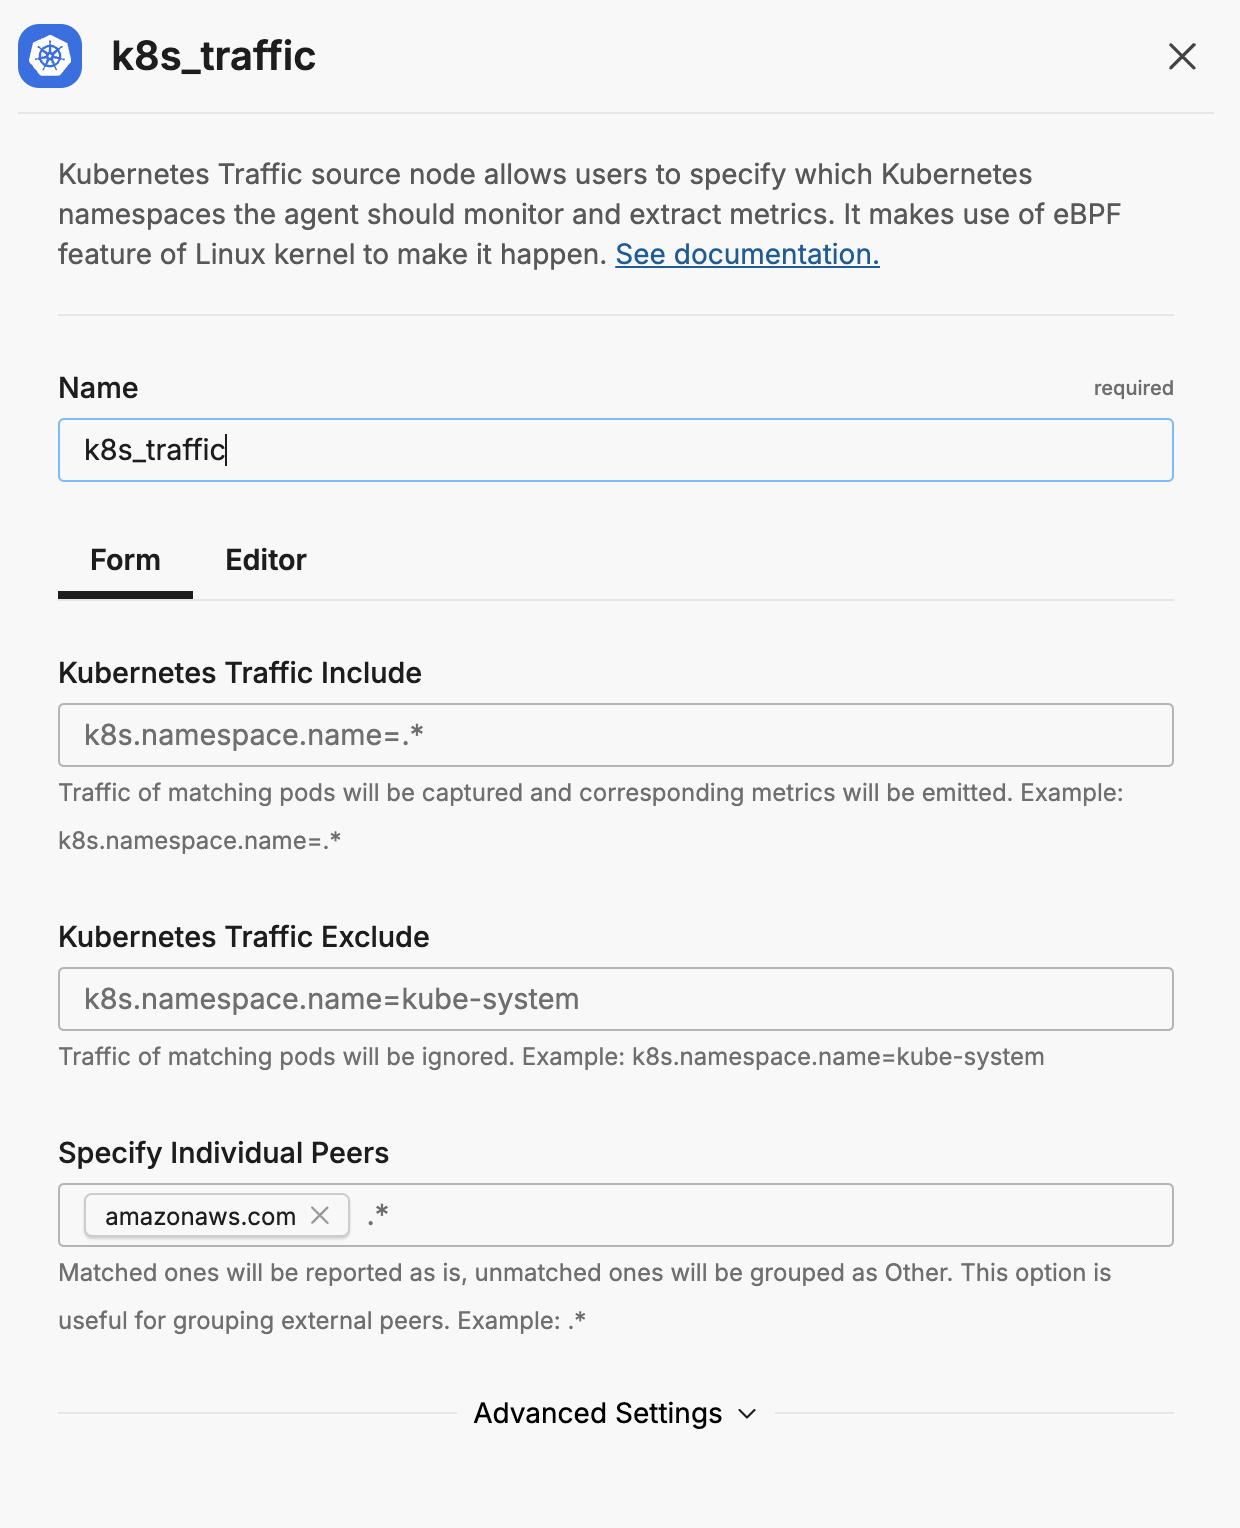
In this instance, all clients and servers with URLs ending in amazonaws.com (their domain) will have their Fully Qualified Domain Name (FQDN) resolved in the service map, rather than appearing as Unknown Services.
Service Map Example
Suppose there’s a sudden increase in error rates reported for a critical buyer webpage service in an e-commerce application. Using the service map, you can:
- Identify Affected Services: Use the service map to see which services are directly connected to the
buyerwebpage service. - Analyze Metrics: Check the performance metrics for these services. If you notice a spike in latency or errors upstream, this could indicate the source of the problem.
- Dive into Traces and Logs: Open the service details to access traces associated with failed requests to understand the specific journey of transactions that lead to errors.
- Correlate this with logs to identify error messages or anomalies during these requests.
- Cross-Reference External Factors: If there is a connection to an external service, you can confirm if recent changes or outages in this service have corresponded with the timeline of errors.
Troubleshooting
If the service map is not visible, troubleshoot with these steps:
- Ensure the pipeline includes the k8s_traffic_input node, and that it is connected to the metrics destination.
- Verify in the metric inventory that
k8s.traffic.communication.countandk8s.traffic.communication.latency.p95have data points. - Confirm that the correct pipeline is selected in the filters pane.